Author: Long Yue
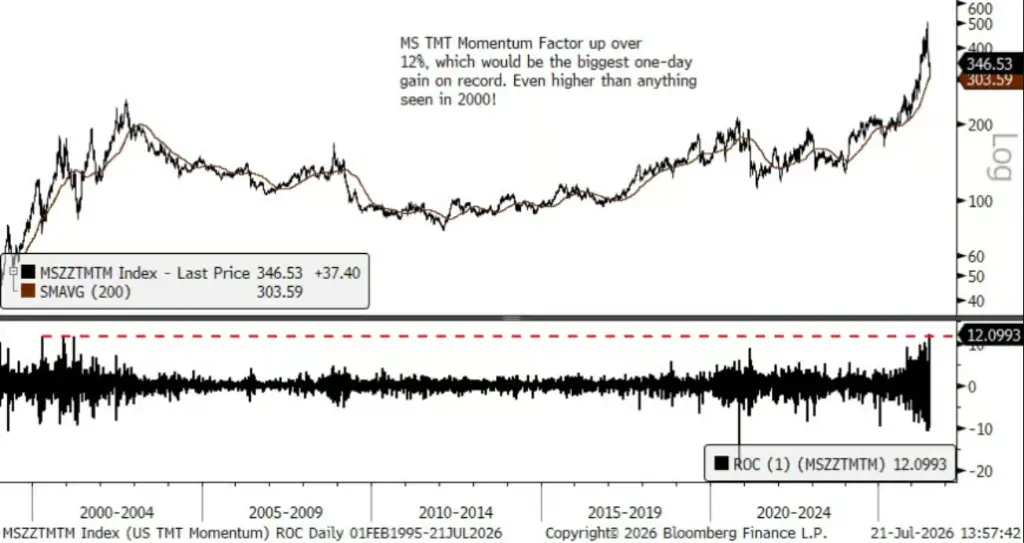
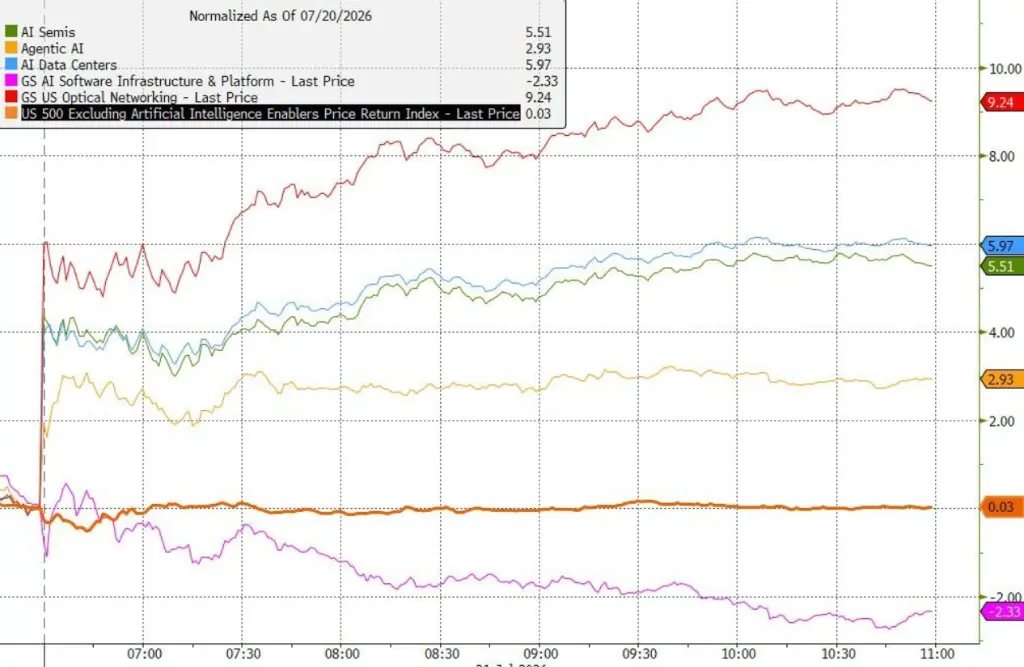
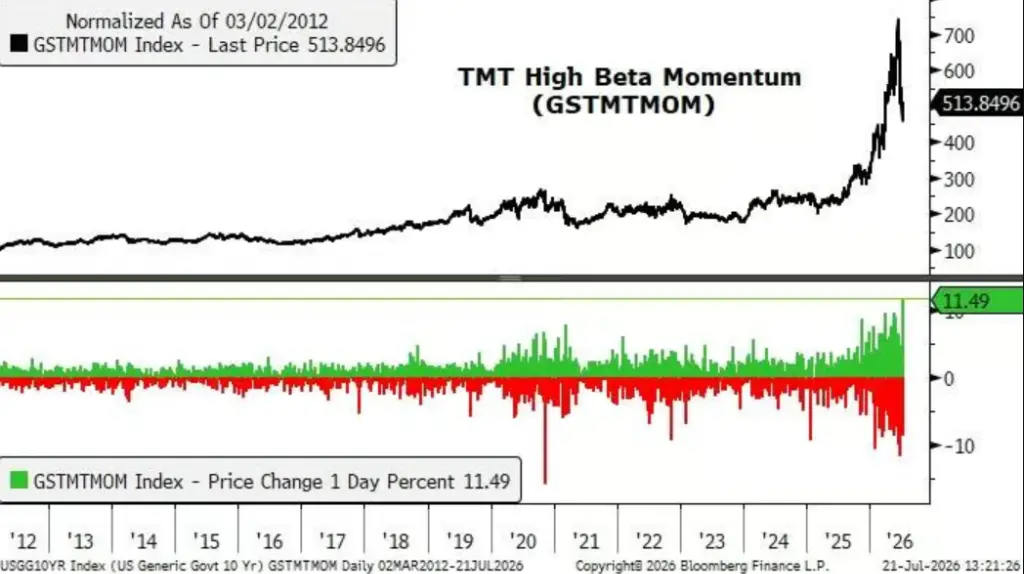
U.S. tech momentum stocks staged a sharp rebound on Tuesday (July 21). Morgan Stanley's TMT momentum factor surged over 12% in a single day, marking the largest single-day gain on record, even surpassing any single-day performance during the 2000 internet bubble. Goldman Sachs' high beta momentum long index (GSCBHMOM) rose about 8.5% in a single day, the strongest single-day performance since April 2025; the long-short high beta momentum index (GSPRHIMO) increased by 9.5%, the strongest since 2021, close to historical highs since 2003.
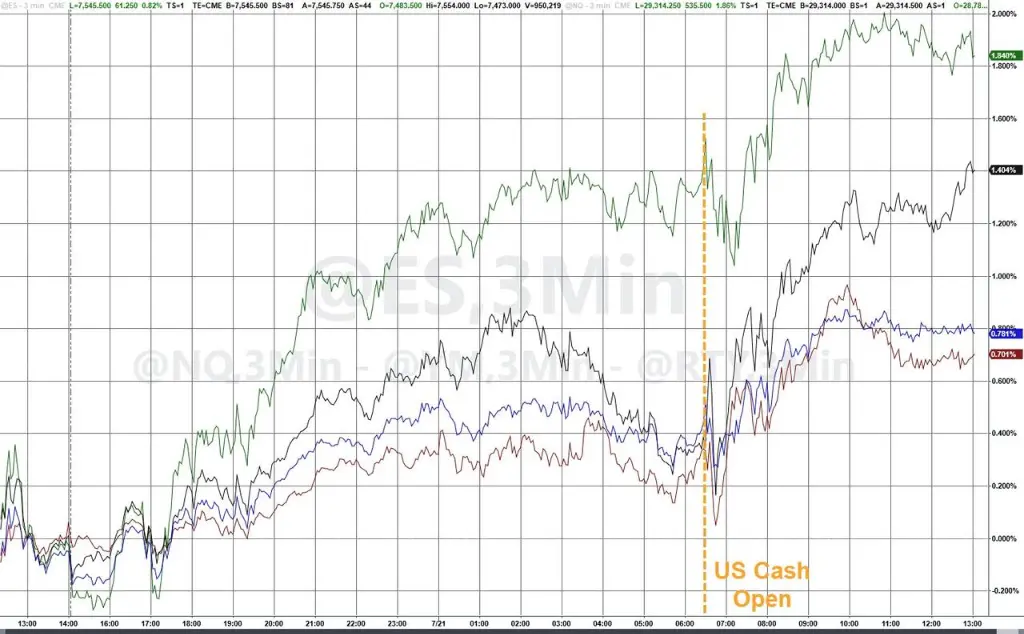
The Nasdaq Composite Index rose about 1.3% that day, leading the three major indices. The semiconductor sector was the biggest driver— the Philadelphia Semiconductor Index rose 4.6% in a single day, and the VanEck Semiconductor ETF increased about 4.5%. Micron Technology rose over 10%, Intel rose about 8.6%, SanDisk rose about 14%, Cerebras Systems surged about 18%, and Cipher Mining rose over 11%.
This rebound occurred after three consecutive trading days of decline and also followed a cumulative drop of 33% in momentum stocks.
Why is there this rebound? Bears are "squeezed"
To understand this rebound, one must first understand how deep the previous declines were.
Goldman Sachs data shows that high beta momentum stocks dropped 33% in just a few trading days, marking one of the worst pullbacks since the bursting of the internet bubble. The high beta momentum index fell below the 200-day moving average and hit its lowest point since January, with the level of overselling being the most severe since August last year.
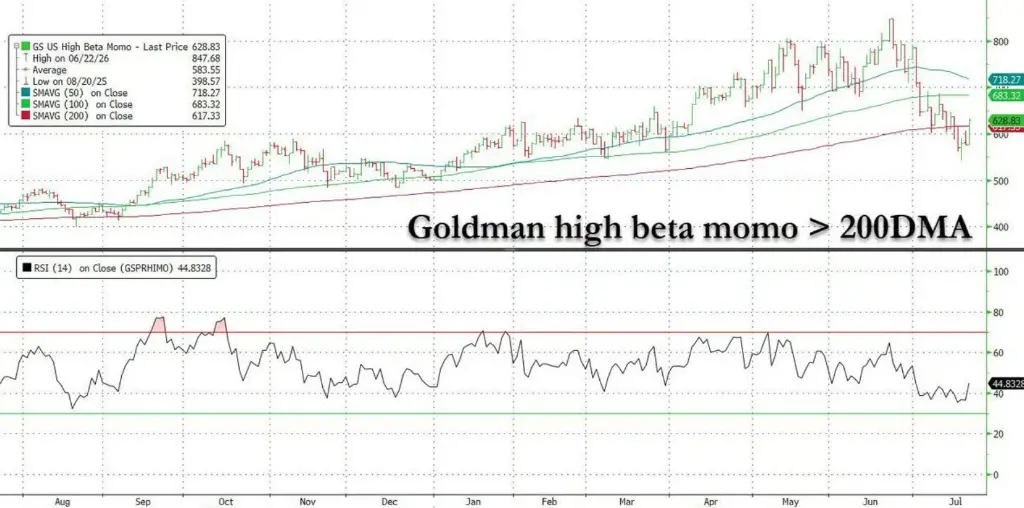
The deeper the drop, the greater the rebound potential—this is the fundamental logic of the market.
This rebound is largely a "short squeeze" scenario. Many investors who shorted momentum stocks, especially chasers and panic sellers from South Korea and Japan, have suffered heavy losses over the past two weeks—South Korea even saw large-scale margin call events, severely impacting local retail investors. When these bears are forced to cover their shorts, buying pressure creates a self-reinforcing upward spiral.
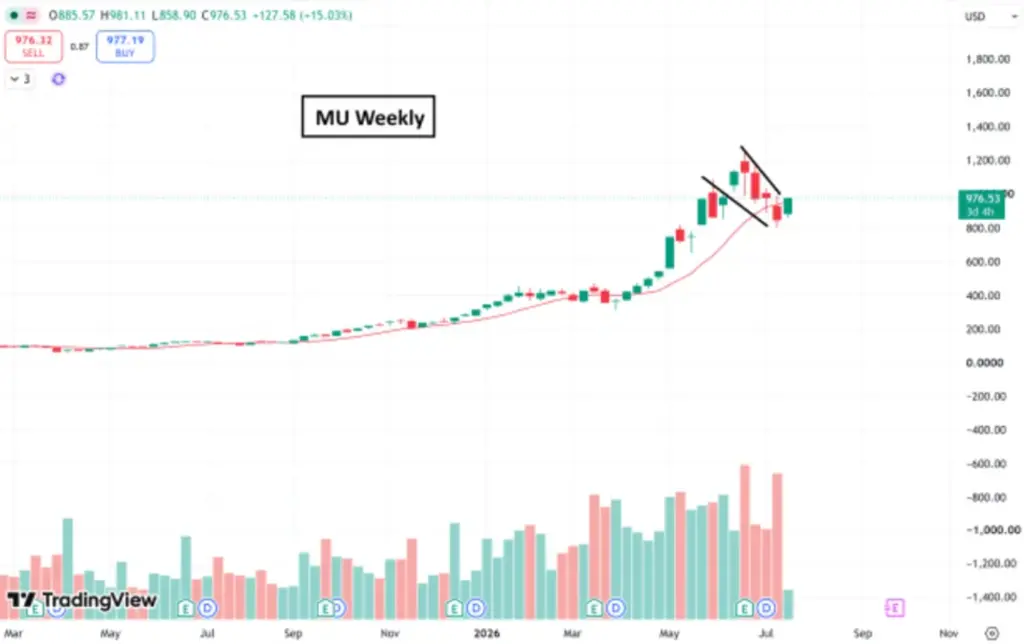
Zacks Investment Research analysis points out that Micron Technology had previously broken the "head and shoulders" neckline on the daily chart, indicating a bearish technical pattern. However, on Tuesday, the stock surged over 10%, retracing back above the neckline. "False breakouts often trigger violent counter-movements, as late-to-the-game bears and shorts get trapped."
Market breadth remains weak, the strength of the rebound is questionable
While the numbers of the rebound look startling, the internal structure is not healthy.
BTIG strategist Jonathan Krinsky analyzed that the overall trading volume on Tuesday was relatively low, with SPY, QQQ, and S&P 500 spot trading volumes down 20% to 30% from their 20-day averages. Meanwhile, although the S&P 500 index rose nearly 1% that day, the number of declining stocks still outnumbered advancing ones—this year has seen the most instances of price diverging from market breadth, and this phenomenon occurred again on Tuesday.
Goldman trader data shows that overall exchange trading volume is about 17% lower than the 20-day average, and the liquidity on market makers' books is only $6.83 million, with market activity rated just 3 out of 10.
In other words, this rebound resembles a concentrated outburst of a few heavyweight stocks rather than a broad recovery.
Bloomberg macro strategist Michael Ball analyzes, "It is too early to announce that the adjustment has ended." The demand for put options on semiconductor ETFs and previous AI star stocks remains high, indicating negative gamma exposure for the Nasdaq, semiconductor ETFs, and related stocks, which means that market makers will chase gains and panic sell rather than stabilize volatility—this amplifies both rises and falls.
BTIG warns: rebound has hit key resistance, suggests to take profit on highs
Not everyone is optimistic about this rebound.
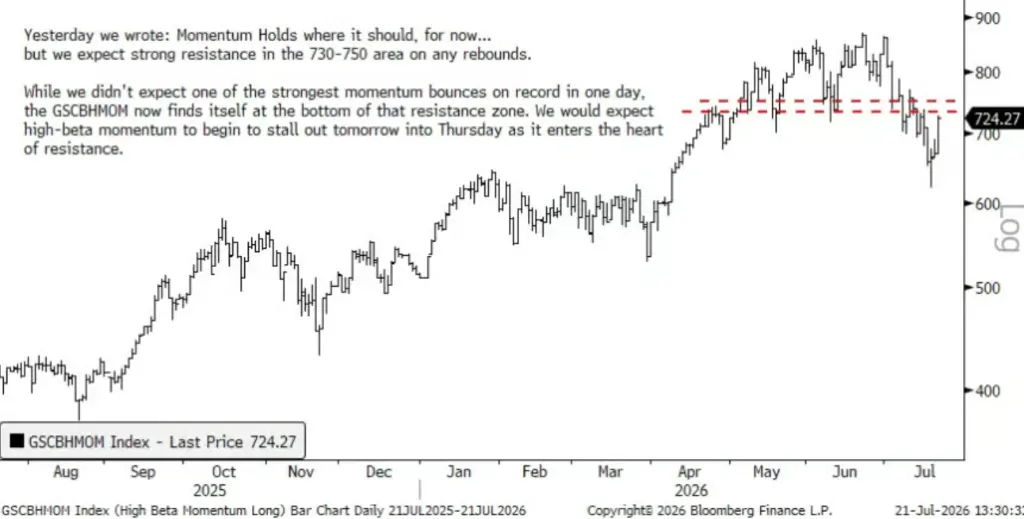
BTIG's Jonathan Krinsky clearly warns, suggesting to "take profits on highs (fade)." He previously predicted that the rebound of momentum stocks would encounter strong resistance in the 730 to 750 range, and Tuesday's rebound pushed the GSCBHMOM right to the lower edge of that resistance zone.
Krinsky stated: "Extreme volatility, combined with historical stock differentiation, signals that the market is undergoing a comprehensive adjustment." He anticipates that high beta momentum stocks will begin to stagnate as they enter the core of the resistance range from Wednesday to Thursday.
According to historical data, since 1999, the high beta momentum long index has only seen a single-day gain of over 7% above the 200-day moving average 10 times. Three of those occurrences were this year, three in early 2021, and three in early 2000. Krinsky points out that this data "indicates both the rarity of this market and the continued presence of statistical features reminiscent of the 1999 to 2000 period."
Goldman Sachs, UBS: Momentum sell-off nearing its end, suggest gradual accumulation
In contrast to BTIG's cautious approach, both Goldman Sachs and UBS believe that the current momentum sell-off is nearing its end and suggest that investors seize the opportunity.
Goldman's Julia Mensch mentioned in a report that Goldman indicated last week that the momentum sell-off has "entered its later stages." She wrote: "As positions have been largely cleared (Goldman prime broker data indicates that momentum exposure is at the 64th percentile of the past year, and the 93rd percentile of the past five years), and there are no new fundamental catalysts behind this sell-off, we believe that momentum has room to revert to long-term trends, and this sell-off may present a good opportunity to increase momentum exposure or buy AI stocks on dips."
UBS hedge fund equity derivatives sales chief Michael Romano also expressed similar views in a client report, suggesting that the improvement in AI fundamentals is a buy signal. However, he also advised investors to "accumulate slowly rather than going all in at once."
Romano wrote: "De-risking of momentum is still a compelling judgment. Gradual accumulation is a prudent move." He expects the momentum sell-off to bottom out by the end of July (if it hasn't yet) and noted: "Once the market turns, I expect liquidity to drive prices upward beyond expectations."
However, Goldman also maintains a cautious stance—given the recent high volatility and the intensive earnings reporting season approaching, Goldman advises investors to gain exposure through "limited loss structures" rather than holding long positions outright.
Earnings season is the next key variable
The sustainability of this rebound largely depends on this week's earnings reports.
According to Reuters, 113 S&P 500 component companies (accounting for about 18% of S&P 500 market value) will release earnings this week. Among them, Alphabet's (GOOGL) earnings report is considered "the most significant data point of the week", with the market focusing on its full-year capital expenditure guidance for 2026—generally expected to be raised, which will provide crucial hints on the direction of AI spending.
LPL Financial Chief Technical Strategist Adam Turnquist stated: "The focus is not just on the total amount of capital expenditure, but the next point of attention will be ROI and the quality of expenditures; we believe this will become a core topic in the second half of the year."
He also noted: "We expect continued volatility in the semiconductor sector as overbought conditions need to be digested, profit-taking pressure will emerge, and crowded positions will need to be cleared. From a fundamental perspective, we believe there is no substantive change."
According to Reuters, so far, 66 S&P 500 companies have reported earnings, with about 88% of these companies exceeding analysts' expectations. 3M (MMM) rose over 9% in a single day, and General Motors (GM) increased about 5%, both gaining popularity due to better-than-expected earnings.
Bonds and macro: another hidden risk
While the stock market is in a frenzy, the bond market is sending warnings.
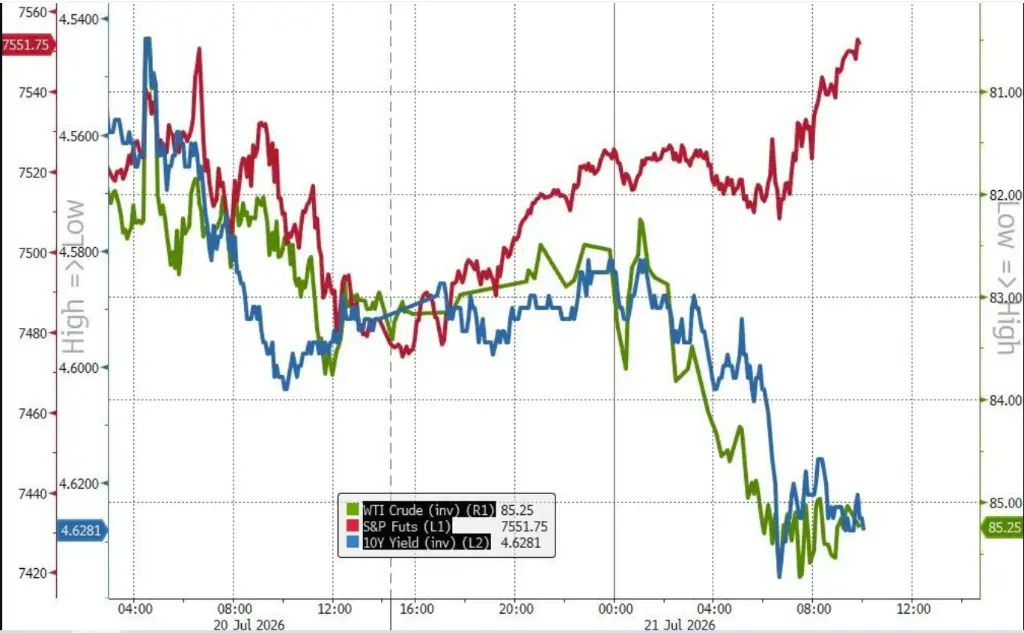
On that day, U.S. Treasury yields rose across the board, with the short-end 2-year yield up 5 basis points and the 30-year yield up 2 basis points, with long-end yields rising to a two-month high, erasing the bond gains from last week's lower-than-expected inflation data.
Oil prices are one of the driving forces. Brent crude futures closed above $90 a barrel for the first time since June 11. The situation in the Middle East continues to escalate—Houthi forces in Yemen announced the blockade of the southern entrance to the Red Sea, and two oil tankers carrying Saudi oil turned back in the Red Sea. Kpler's MarineTraffic data shows that even before the blockade was announced, cargo throughput through the Strait of Mandeb had decreased by 34% in the past two weeks.
RBC Capital Markets interest rate strategist Izaac Brook stated: "Today's market movement is mainly the result of sustained increases in energy prices. The volatility in interest rates was amplified due to breaking through technical levels of high interest—2-year yields at 4.20% and 10-year yields at 4.60%—and the typical low liquidity trading environment of summer."
Bloomberg's Cameron Crise warned, long bond yields are at a critical point of turning 5% from a resistance level to a support level, with the next obvious target being 5.5%—"this will impact the stock market, especially when the economy outperforms expectations, pushing yields higher and adversely affecting stocks."
Goldman Sachs IG credit head Kevin Boova also warned that the credit spreads for mega-cap tech companies have reached new highs, "the mega-cap cloud computing/AI/data center sector feels somewhat vulnerable again."
免责声明:本文章仅代表作者个人观点,不代表本平台的立场和观点。本文章仅供信息分享,不构成对任何人的任何投资建议。用户与作者之间的任何争议,与本平台无关。如网页中刊载的文章或图片涉及侵权,请提供相关的权利证明和身份证明发送邮件到support@aicoin.com,本平台相关工作人员将会进行核查。


