Author: 0xWeilan

The information, opinions, and judgments regarding the market, projects, and currencies mentioned in this report are for reference only and do not constitute any investment advice.
According to Coinbase quotes, BTC reached a four-year low of $15,460.00 per coin on November 21, 2022. We consider this day as the end of the previous cycle and the start of the current cycle.
From that day until September 30 of this year, BTC has been operating in turmoil for 1,044 days, which is close to the peak of the previous two cycles (about 1,060 days after the low). Using the method of calculating based on historical patterns, BTC is expected to reach the peak of this cycle in October 2025.
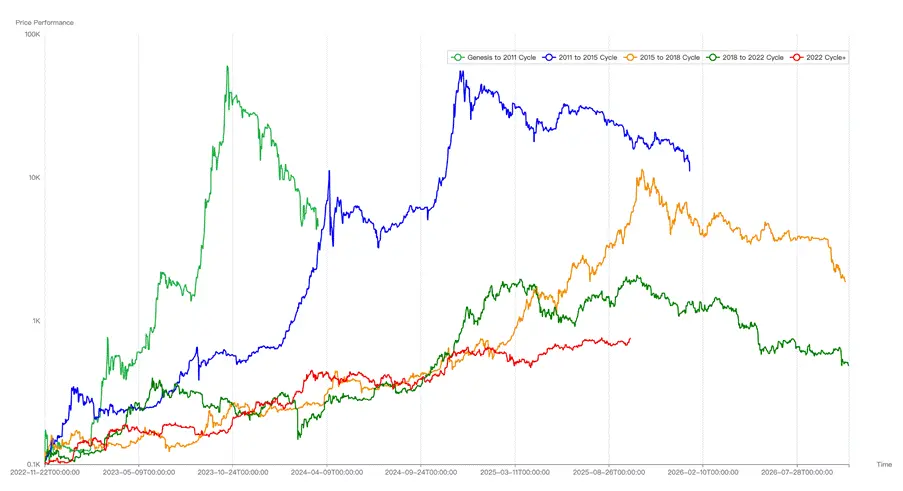
Comparison of BTC Price Trends in the 5th Cycle
The "cyclical law" of BTC originates from the speculative frenzy brought about by consensus diffusion and halving, and it remains the most valued cyclical indicator for traditional large holders of BTC. This group has played a decisive role in shaping the previous BTC peaks. It is the frenzied profit-taking sell-offs from this group that drain liquidity and ultimately lead the market to complete the formation of the cycle peak.
Currently, this group is intensifying its sell-offs, and it seems that the "peak" is about to arrive. However, other peak indicators such as rapid price surges and sudden increases in new addresses have not yet appeared. This is puzzling: will this "cyclical law" continue to suppress the market and shape the cycle peak, or will it become ineffective? Will the BTC bull market that started in November 2022 end in October?
In this report, EMC Labs uses its self-developed "BTC Cycle Multi-Factor Judgment Model" to conduct a comprehensive analysis of BTC price trends since the beginning of this cycle, clarifying which market forces and underlying logic have truly driven the cycle forward, and ultimately providing our analysis and judgment on whether BTC will peak in October.
Phase One (2022.11~2023.09): Accumulation by Long-Term Holders
Looking back at history, the bankruptcy of one of the main buyers in the previous cycle, FTX, and its lender Voyager Digital, marked the completion of the cycle's clearing. After the bankruptcy of FTX, the BTC price fell from the bottom range of $20,000 to $15,476 (Coinbase data, same hereafter), with the lowest point occurring on November 21, 2024.
The bankruptcy of institutions like FTX intensified the market's bottoming process, but the fundamental force determining the end of the cycle was the profit-taking sell-offs by long-term holders (long-term investors). During market euphoria, short-term traders rush to buy while long-term holders sell; when the market cools, short-term traders sell while long-term holders increase their positions.
Position Changes of Long-Term Holders in the Previous Cycle
As in previous cycles, long-term holders began accumulating chips during the bear market phase of the last cycle. As the market entered the bottom phase, the scale of short-term losses began to decrease, and the buying power of long-term holders began to transform into upward price momentum, pushing BTC and the crypto market away from the bottom and into a new cycle.
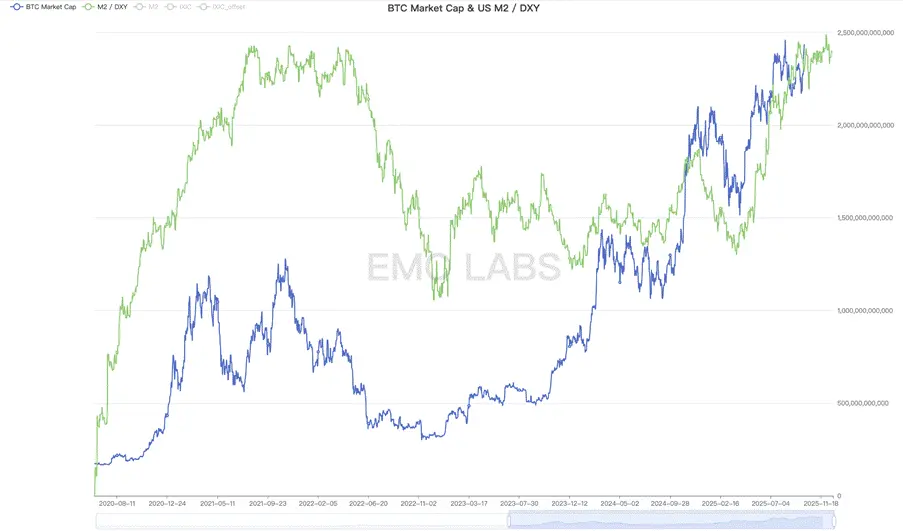
At the same time, the post-pandemic era saw the Federal Reserve's interest rate hike cycle nearing its end, officially concluding on July 26, 2023. Due to anticipatory trading, the Nasdaq Composite Index bottomed on October 13, 2022, and emerged from the bottom range in January 2023. BTC's price essentially synchronized with this, leading the official end of interest rate hikes by about 9-10 months.
As the interest rate hike cycle neared its end, the tightening of monetary policy led to bankruptcy cases among regional banks in the U.S. (Silicon Valley Bank, First Republic Bank), forcing the U.S. government to urgently release liquidity. The U.S. M2/DXY index began to bottom out and rebound, providing an external environment for the U.S. stock market and BTC to rebound.
U.S. M2/DXY
We define "2022.11~2023.09" as the first phase of this cycle. Along with the improvement in macro liquidity, the tension generated by the internal holding structure of the crypto market became the fundamental driving force behind the rise in BTC prices during this phase.
The Federal Reserve officially ended its interest rate hikes in July 2023, and the accumulation behavior of long-term holders continued until the end of September 2023.
At this time, the future influential DATs company and BTC Spot ETF had not yet become dominant forces, and the retail trading crowd that chases highs and sells lows had not yet awakened. During this phase, the issuance of stablecoins was in a shrinking state, and funds were still flowing out of the crypto market. The periodic accumulation by long-term holders was the main force driving the market upward.
In the first phase, BTC rebounded from a low of $15,476.00 to a maximum of $31,862.21, with a maximum increase of 105.88%.
Phase Two (2023.10~2024.03): BTC Spot ETF
U.S. inflation continued to decline, and the brief rebound in CPI from July to September 2023 was considered a false alarm, with July ultimately confirmed as the end month of the Federal Reserve's current interest rate hike cycle.
As market expectations changed, risk assets began to attract capital, and the shift in risk appetite prepared BTC for the start of the second phase of the market.
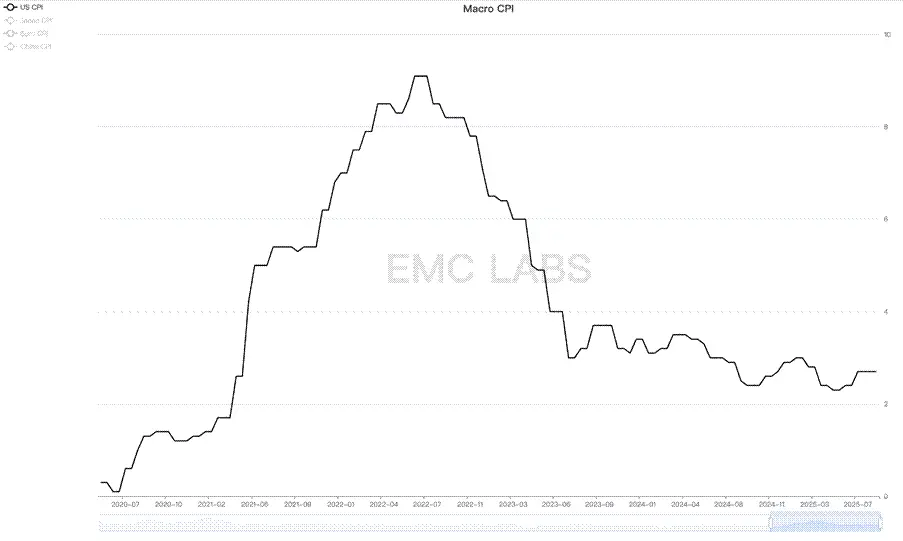
U.S. CPI
What truly drove BTC to start the second phase of this cycle was the anticipation of the approval of the BTC Spot ETF and the fifth halving of BTC in April 2024.
Traditional Wall Street asset management giants like BlackRock and Fidelity submitted applications for BTC Spot ETFs to the SEC in June 2023, and speculative trading funds began to gather in secret.
Dividing the second phase of the market by the SEC's approval of the BTC Spot ETF on January 10, 2024, the phase can be further divided into two halves: the first half (2023.10~2024.01.10) was dominated by speculative funds betting on ETF approval, while the second half (2024.01.10~2024.03.14) was led by incremental funds (over $12 billion) brought in by the ETF channel.
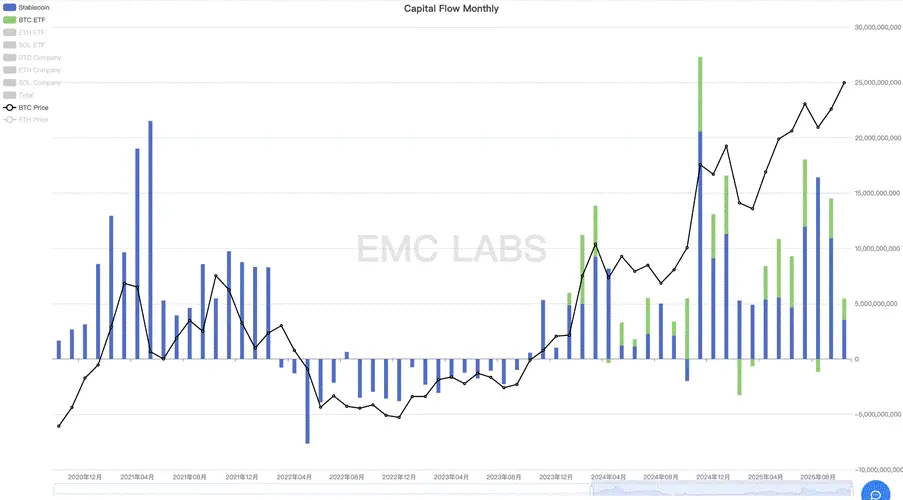
Monthly Statistics of BTC Spot ETF and Stablecoin Channel Fund Flows
In addition, the stablecoin channel completely broke free from the outflow trend in October, restoring inflows. By the end of March, a total of over $26 billion in new issuances was added, making it one of the main driving forces in the first half of the phase.
Since the launch of this phase's market in October 2024, long-term holders began to reduce their positions, and by the end of the market, the reduction scale reached as much as 900,000 coins.
The market in this phase was jointly dominated by speculative/investment funds from the BTC Spot ETF channel, on-site speculative/investment funds (manifested as a large issuance of stablecoins), and the reduction of long-term holders. The buying power exceeded the selling power, leading to a significant upward movement in BTC prices, and the market was very vigorous.
In the second phase, BTC rose from a low of $26,955.25 to a maximum of $73,835.57, with a maximum increase of 173.92%.
Phase Three (2024.04~2024.09): Halving Rebalancing
In the analysis of the second phase, we pointed out that the investment/speculative funds based on the traditional narrative of BTC halving are also important factors determining the market. This is clearly reflected in the market of the third phase.
On April 19, 2024, BTC completed its fourth halving, reducing the block reward from 6.25 BTC to 3.125 BTC. Although over 95% of BTC has already entered circulation, the impact of halving on the actual supply of the market has significantly decreased, but the speculative market surrounding the halving has indeed overdrawn BTC's upward space. From April 2024 to September, BTC entered a prolonged period of 7 months of oscillation and adjustment.
From the funding statistics, it can be seen that after BTC reached a phase high in March, the inflow of funds from the BTC Spot ETF channel shrank but remained at a high level, while the stablecoin channel experienced a greater degree of shrinkage, even turning into outflows at one point. 
Monthly Statistics of BTC Spot ETF and Stablecoin Channel Fund Flows
During this period, although the Federal Reserve had already stopped raising interest rates, rate cuts had not yet started, and the inflow of funds from the ETF channel significantly decreased. Coupled with the exit of on-site funds as the halving approached, the overdrawn market had to revise downward to seek a new price balance.
The market was able to rebalance without falling into a bear market, with the stabilizing force coming from long-term holders. We noticed that after entering April, along with the retreat of liquidity, long-term holders stopped reducing their positions and began to accumulate again after July. The behavior of long-term holders aligned with the historical characteristics of this group, sketching out a phase bottom range for the market.
In the third phase, the highest price was $109,588, the lowest price was $74,508, with a maximum decline of 32.01%, which did not exceed the BTC bull market correction threshold.
Phase Four (2024.10~2025.01): Trump's Crypto-Friendly Policies
Since the cessation of interest rate cuts in July 2023, the federal interest rate has remained high at 5.25-5.50 to suppress CPI declines. High interest rates gradually harmed the job market, and the Federal Reserve finally resumed rate cuts at the monetary policy meeting in September 2024, completing a 75 basis point cut by the end of the year.
The rate cuts boosted the overall market's risk appetite, with funds pouring into the crypto market through the BTC Spot ETF and stablecoin channels. By the end of January 2025, the management scale of 11 BTC Spot ETFs in the U.S. exceeded $100 billion, setting multiple historical records. This indicates that the narrative of BTC as "digital gold" has gained favor on Wall Street, and BTC is transitioning from an alternative asset to a mainstream asset.
In addition to rate cuts, another catalyst for BTC's rise is the U.S. presidential election. In this election, Republican candidate Donald John Trump underwent a 180-degree shift in his attitude towards cryptocurrencies, becoming the most "crypto-friendly" presidential candidate in the U.S. His family business even issued a MEME token called Trump after his victory.
After taking office, Trump signed an executive order supporting digital assets and blockchain technology, established a cross-departmental working group to review existing regulatory policies, announced the establishment of a "Bitcoin Strategic Reserve" and "U.S. Digital Asset Reserve," and signed the "GENIUS Act" to promote the compliant development of stablecoins. Additionally, he appointed "crypto-friendly" individuals as Secretary of the Treasury and SEC Chairman, effectively promoting the development of crypto assets and blockchain technology in the U.S. The friendliness of the attitude and the density of the policies are unprecedented, and even Satoshi Nakamoto would find it hard to believe.
With Trump's campaign, massive funds rapidly flowed into the crypto market through ETF and stablecoin channels, forming the largest scale of capital inflow in this cycle so far. At the same time, long-term holders initiated sell-offs again to lock in profits.
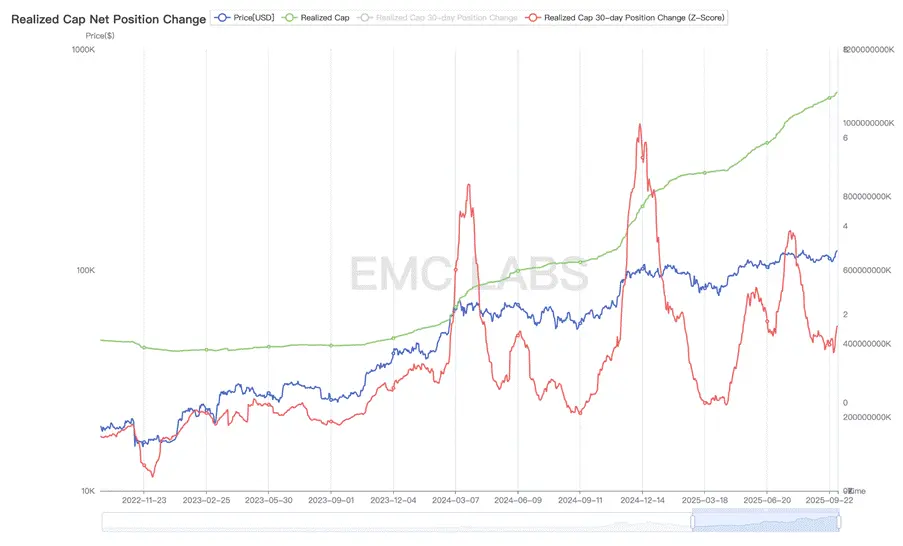
Statistics on the Realization of Value on the Bitcoin Network
Driven by the U.S. crypto-friendly policies, crypto assets gradually became mainstream assets in the U.S. In addition to the BTC Spot ETF, dozens of DATs companies, represented by Strategy, joined the competition to accumulate BTC and other crypto assets. These two groups have become the largest buyers in the BTC market.
The BTC held by BTC Spot ETF and DATs companies has exceeded or approached 5%.
With the large-scale involvement of BTC Spot ETF and DATs companies, BTC has entered a major turnover era. A large amount of BTC is being transferred from early holders to the custody accounts of BTC Spot ETF and DATs companies. This has caused the BTC held by centralized exchanges, commonly used by early crypto holders, to begin to decline significantly in this phase. By the end of September 2025, over 400,000 BTC had flowed out of the management addresses of centralized exchanges, valued at over $40 billion at $100,000 each.
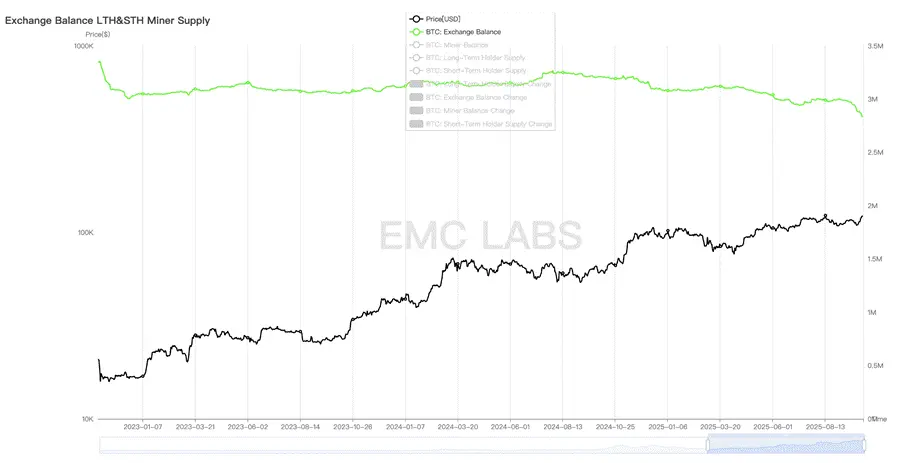
Statistics on BTC Holdings in Major Crypto Exchanges
In this phase and beyond, this outflow continues, indicating that BTC is currently undergoing a historic turnover. Early investors (including those holding for over 7 years) are cashing out substantial profits, while traditional funds are transitioning into long-term investors of this asset. The behavior of early investors is greatly influenced by the halving cycle, while DATs companies seem inclined to continue buying for long-term holding, and the behavior of holders in the BTC Spot ETF channel is more influenced by the performance of U.S. stocks.
This change in holding structure complicates the cyclical shaping of BTC.
The market dynamics during this period stem from the speculative behavior driven by expectations of interest rate cuts and Trump's crypto-friendly policies, resulting in record capital inflows into the crypto market.
In the fourth phase, BTC prices rose from a low of $63,301.25 to $109,358.01 (recorded on January 20, 2025, the day Trump took office), with a maximum increase of 72.76%.
Phase Five (2025.02~2025.04): Black Swan
In our research framework, the fifth phase is characterized by a mid-term adjustment formed by external black swan events combined with a return of emotions after passionate speculation. The market turmoil caused by the pause in interest rate cuts and the tariff war reached a threshold both in time and space, ultimately forming this special phase.
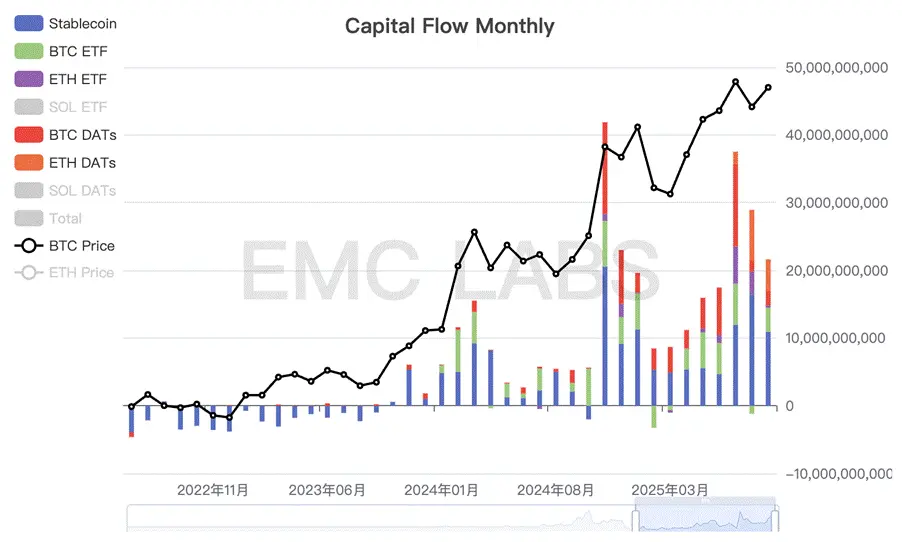
Monthly Statistics of Capital Flows in the Crypto Market
Because the U.S. stock and crypto markets had priced in the continuation of interest rate cuts, when the Federal Reserve stopped cutting rates in January 2025 and refocused on the mission of reducing inflation, the historically high U.S. stocks and BTC entered an unpredictable state. When Trump announced a tariff rate that far exceeded expectations, the market plunged into a crash mode.
The Nasdaq experienced a maximum adjustment of nearly 17% from its peak, while BTC saw a maximum adjustment of 32%. Although BTC's decline was significant, it did not exceed the correction threshold in a bull market.
Ultimately, as the panic caused by the tariff war and concerns about a hard landing of the U.S. economy subsided, both the U.S. stock and crypto markets achieved a V-shaped reversal in April, continuously reaching new historical highs after July.
Behind the V-shaped reversal, funds from DATs companies, the BTC Spot ETF channel, and stablecoin channels surged in buying, while long-term holders timely returned to accumulation after the decline, once again acting as a stabilizing force in the market.
In the fifth phase, the highest price was $73,777, the lowest price was $49,000, with a maximum decline of 33.58%, which did not exceed the scale of BTC's bull market correction.
Phase Six (2025.05~): Old Cycle and New Cycle
The market crash caused by the black swan was gradually recovered by bottom-fishing funds and long-term accumulation, and by July, BTC had reached a historical high of $123,000.
At this point, long-term holders initiated the third major sell-off of this cycle, which continues to this day. The receiving parties are the funds from DATs and the BTC Spot ETF channel.
Before the interest rate cut in September, anticipatory trading continued to dominate the market, with significant capital inflows from July to September, but the inflow scale decreased, leading to a slight adjustment in BTC after the rate cut. Long-term sell-offs became the main activity affecting market movements.
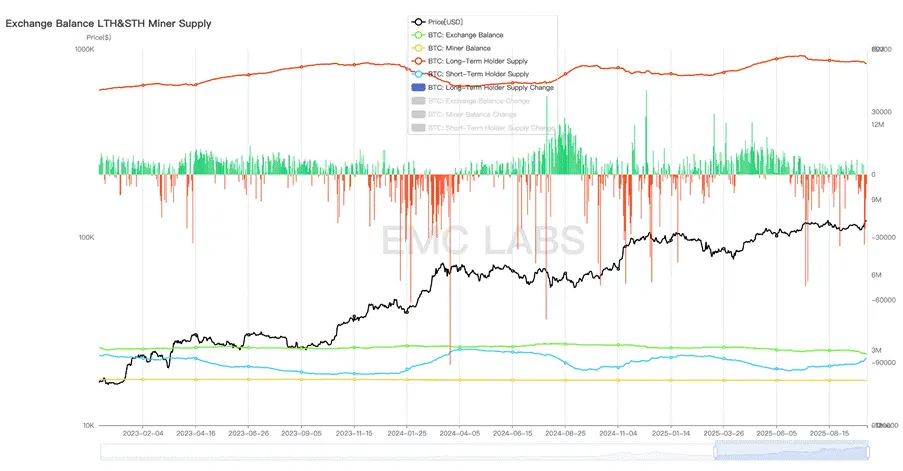
Statistics on Changes in Long-Term Holder Positions in BTC
Since the beginning of this cycle, with the third wave of increases, long-term holders are undergoing a third round of large-scale sell-offs. According to on-chain data, long-term holders have locked in profits of over 3.5 million BTC in this cycle, reaching the threshold seen in previous cycle peaks. As of today, long-term holders are still continuing to sell BTC significantly.
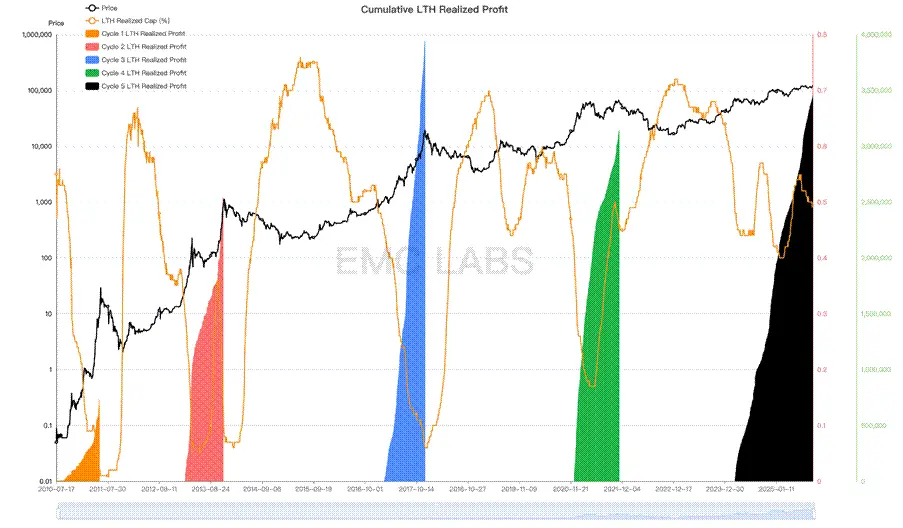
Statistics on Realized Profits of Long-Term Holders in BTC (BTC)
In the bull and bear cycles formed by previous BTC halvings, the halving and the accumulation and distribution of chips by long-term holders were decisive factors in forming the cycle, while the speculative sentiment surrounding the halving that drives new investors to enter is a necessary condition for forming the cycle peak. In previous cycles, this speculative influx of new investors was manifested by a surge in new addresses for Bitcoin network wallets.
However, with the diffusion of BTC consensus, the scale of new addresses that BTC can stimulate to create in each cycle has stagnated. Since 2024, the number of new BTC addresses has fallen to levels seen during previous bear markets. Of course, this cannot simply be interpreted as a decrease in new participants entering, as after the approval of 11 BTC Spot ETFs in the U.S. in January 2024, many investors began to participate through ETF channels, significantly reducing the creation of BTC wallet addresses.
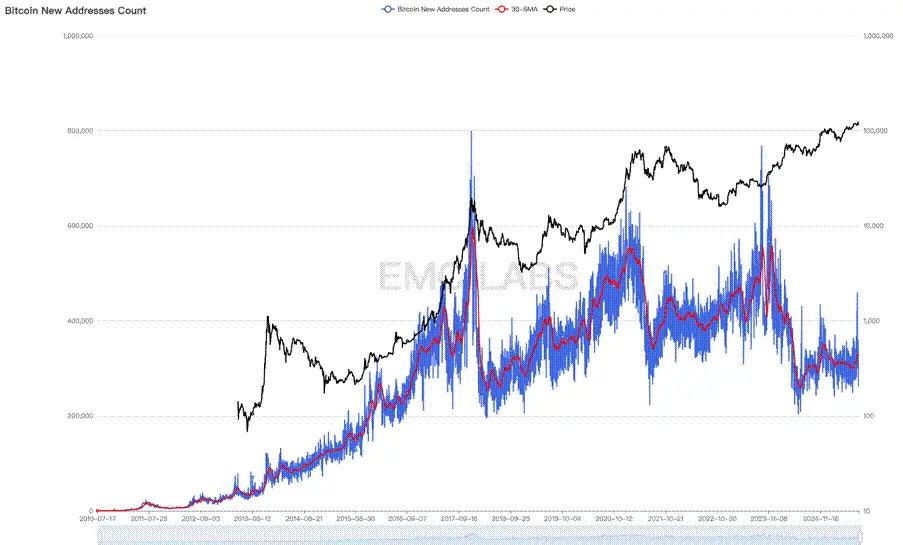
Statistics on New Addresses on the Bitcoin Network
However, when observing the largest SCP platform, Ethereum, we can notice that the new addresses in this cycle have shown a similar situation.
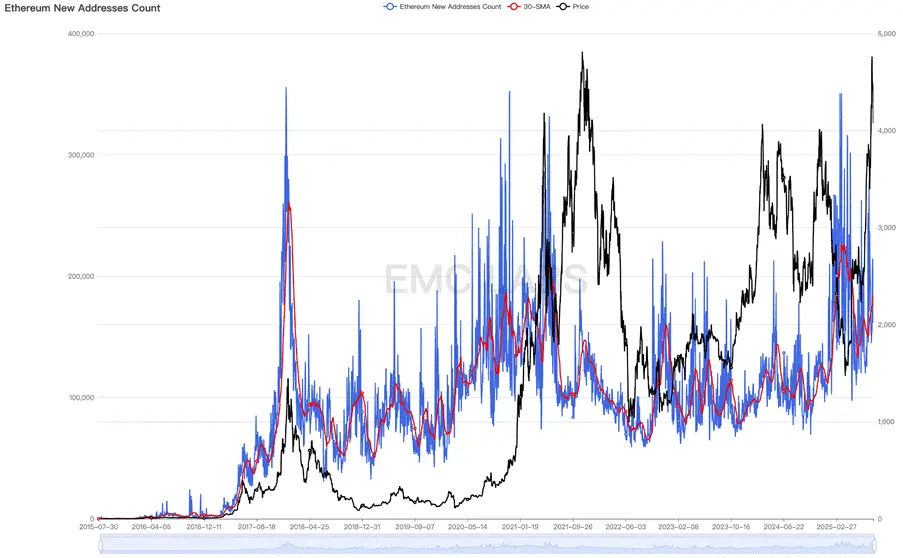
Statistics on New Addresses on Ethereum
This leads us to believe that the structure of the BTC market has undergone a dramatic change, and the entire crypto market is entering a new stage of development. Simply predicting the market peak according to cyclical laws or thoughtlessly buying coins in pursuit of hot trends and expecting high returns has become outdated.
BTC may have already exited the old cycle and entered a new cycle, with its peak formation method, peak timing, and bear market correction amplitude potentially undergoing a complete change.
Conclusion
From the above review and observations, we draw a preliminary conclusion: the upward momentum of this bull market mainly comes from the impetus of industrial policies and incremental funds from traditional channels. The halving and industrial innovations have not brought in massive capital inflows as in the past, thus failing to trigger a comprehensive bull market in the Crypto market where all coins soar.
Although during this bull market, innovations in subfields such as Ethereum Layer 2, BTC Ordinals, Restaking, Solana revival, and DePhin have occurred, the funds attracted by these innovations are pulse-like and extremely limited compared to the previous ICO and DeFi frenzy.
This has resulted in most coins and tokens in the crypto market experiencing only pulse-like phase increases since BTC restarted the new cycle bull market in November 2022, with even the most consensus-driven and widely used SCP platform token, ETH, at one point falling back to the pre-bull market starting price in 2025.
BTC is moving out of the old cycle and entering a new cycle, with funds from DATs companies and the BTC Spot ETF channel attempting to reshape the logic and form of the cycle under the influence of market sentiment and their own logic. However, the long-term holders of BTC, who have played a decisive role in the cyclical movements over the past 16 years, still hold over 15 million BTC, accounting for 70% of the issued BTC, and this group continues to act according to cyclical laws.
Factors supporting the notion that the peak has not yet been reached or that a new cycle has begun include: the outstanding fundraising ability and long-term holding strategy of DATs companies, the ongoing introduction and implementation of crypto-friendly policies in the U.S., and the trend of high-risk asset allocation triggered by the resumption of the interest rate cut cycle.
Whether the long-term holders will sell off to drain liquidity and complete the formation of the old cycle peak, or whether the buying power in a rate-cut environment will bury the selling pressure and follow U.S. stocks into a long bull new cycle remains an ongoing game.
We tend to believe that the cycle will be appropriately extended, and that BTC peaking in October is still a low-probability event. However, if long-term holders persist in continuous sell-offs, the bull market ending this year is a high-probability event. The time and space for the bear market adjustment after the bull market may also be significantly reduced, depending on the behavior of new buyers.
The end has already begun.
EMC Labs (Emerging Labs) was established in April 2023 by crypto asset investors and data scientists. It focuses on blockchain industry research and investment in the crypto secondary market, with industry foresight, insights, and data mining as core competencies, aiming to participate in the thriving blockchain industry through research and investment, and to promote the well-being of humanity through blockchain and crypto assets.
免责声明:本文章仅代表作者个人观点,不代表本平台的立场和观点。本文章仅供信息分享,不构成对任何人的任何投资建议。用户与作者之间的任何争议,与本平台无关。如网页中刊载的文章或图片涉及侵权,请提供相关的权利证明和身份证明发送邮件到support@aicoin.com,本平台相关工作人员将会进行核查。


