Author: doug funnie
Compiled by: Tim, PANews
Why I don't think we've reached the peak of the bull market?
I haven't made such predictions since the beginning of 2024.
What we will discuss:
- On-chain indicators
- Monthly RSI indicator
- Business cycle correlation (Purchasing Managers' Index PMI)
- 50-week moving average support
- Recent headlines
- "The chart has already shown signs"
- Total cryptocurrency market cap (excluding Bitcoin)
- Social media
1) On-chain indicators
It is important to be clear that all of these will show diminishing returns.
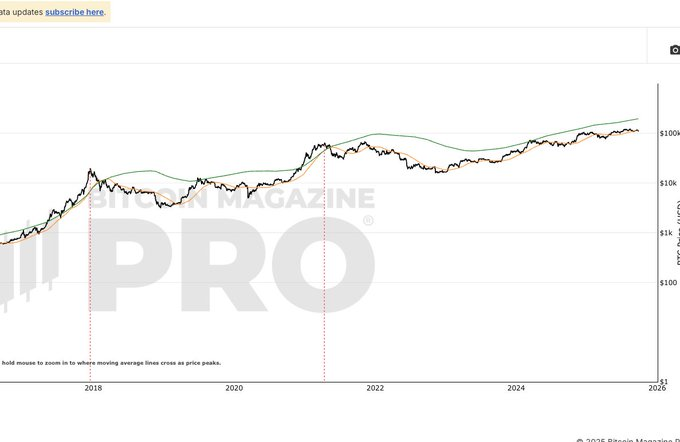
First is the Pi cycle top. Although the orange line crossed above the green line before the top formed, the degree of crossing has diminished over the past three cycles. Assuming a super diminishing returns effect exists, they may not even intersect. Currently, the green line is at 190,000, and the orange line is at 112,000. The green line continues to rise over time and is about to reach 200,000 and continue higher.
Even considering a -50% diminishing returns effect, this surge would bring Bitcoin to about $150,000. We are currently at $109,000. The gap today is vast, enough to fit an aircraft carrier in between:
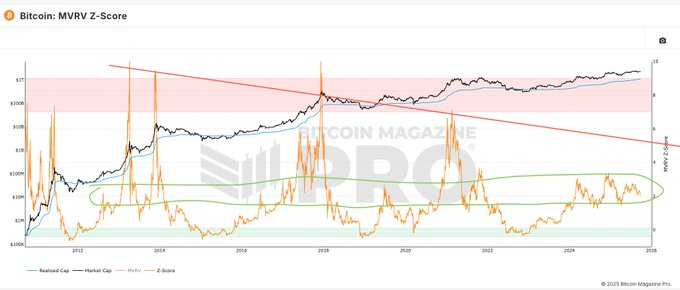
MRVZ
This indicator uses several criteria to identify market tops. The current value, while slightly rising, is still in the "cycle noise range," similar to the bizarrely elongated 2019 market, and is far from the level of the last aggressively fitted trend line of this indicator.
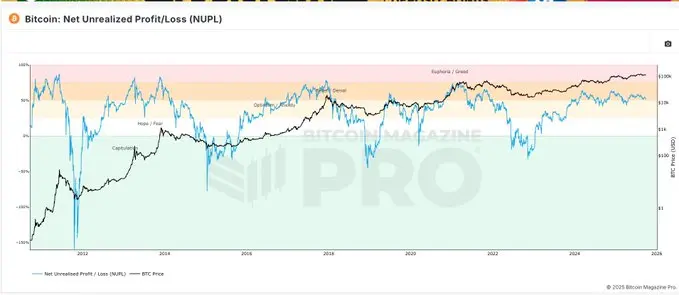
NUPL
The "diminishing returns" feel of this indicator is not as strong: it measures the proportion of profitable addresses. When almost everyone is in profit, the market is on the edge of danger. The last cycle peaked at 75%, while this cycle's local peak is around 65%. Currently, this number is 50%.
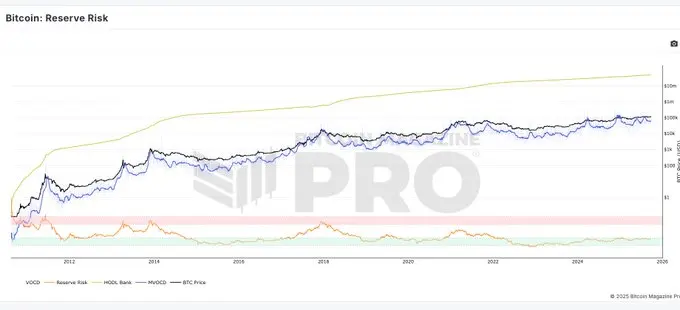
Bitcoin Reserve Risk
This indicator has indeed performed well in predicting local tops. It successfully captured the turning points in March 2024 and January 2025, and it also signaled in late July (after which liquidity sharply shrank). Right now, it is completely quiet.
Other on-chain indicators reflect similar situations.
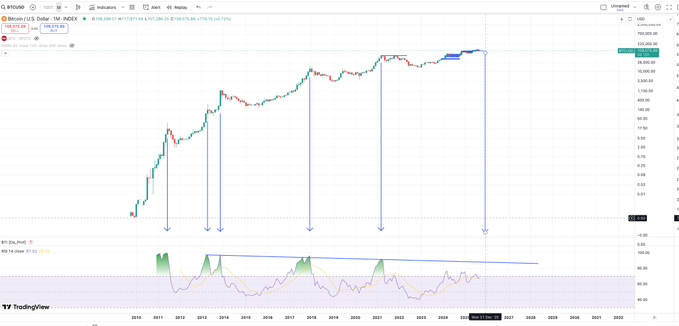
2) Monthly RSI indicator
Let's look at another reliable indicator from past cycles: the monthly RSI index. Whether at a parabolic peak or distribution phase, this indicator must reach this level at the end of historical cycles. If it rises at the fastest pace in history, the earliest point it could reach this value is around December:
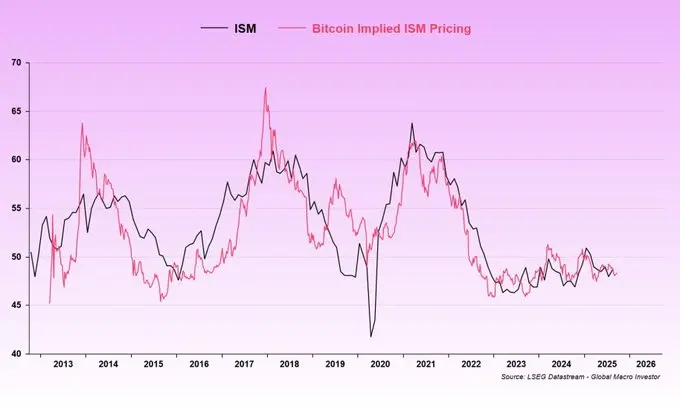
3) Business cycle correlation (Purchasing Managers' Index PMI)
Macro analyst Julien Bittel often discusses topics related to this index, and we owe him for that. His view aligns perfectly with the statement that "we are currently in a distorted, elongated version of 2019, just lagging a few quarters behind the business cycle." While other sources of liquidity + a once-in-a-generation ETF cycle + frenzied positive regulatory news have driven Bitcoin significantly higher, we have yet to see the ISM index peak sharply.
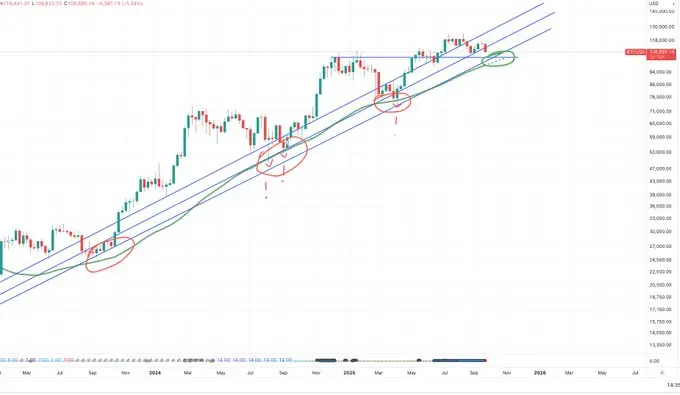
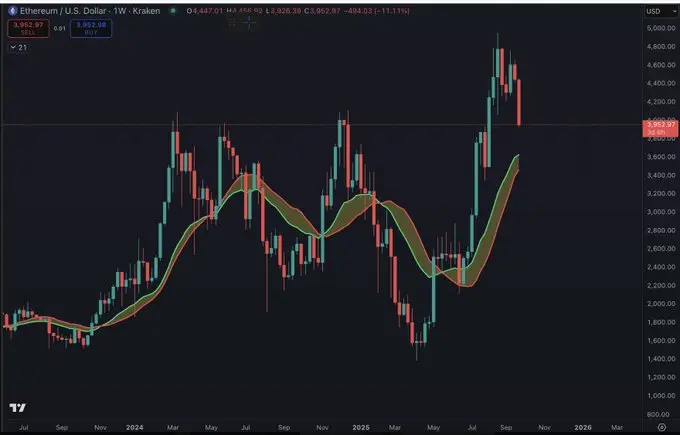
4) 50-week moving average support
In classic technical analysis, a crypto bull market is generally considered to have officially ended only when the weekly closing price falls below the 50-week moving average. Currently, Bitcoin's price is still about $10,000 away from this average, and if it weren't for long-term market research and diligent record-keeping (or having an excellent memory), people might have forgotten that we have dipped below this average twice, even piercing it multiple times with lower shadows. Right now, this moving average is trending upward and is about to resonate with the support level in the 98k to 104k range. Historical precedents exist.
5) Recent headlines
Cryptocurrency has experienced an unusually deep plunge, while the stock market continues to rise. We just received news that the SEC (yes, the "legalizing crime" SEC from Trump's administration) is investigating over 200 potential insider trading cases involving DATs (crypto treasuries). These DATs seem somewhat bubbly to me, which may explain the relative weakness in cryptocurrencies, while potentially creating a "ripping off the Band-Aid" moment of acute pain, as prices are still far from key support levels, which may allow for recovery space.
6) "The chart has already shown signs"
This pullback has already "appeared on the chart." Unless we are in the final weeks of a parabolic surge, ETH (and altcoins) will always retest support here, leading to an increase in Bitcoin's market cap share.
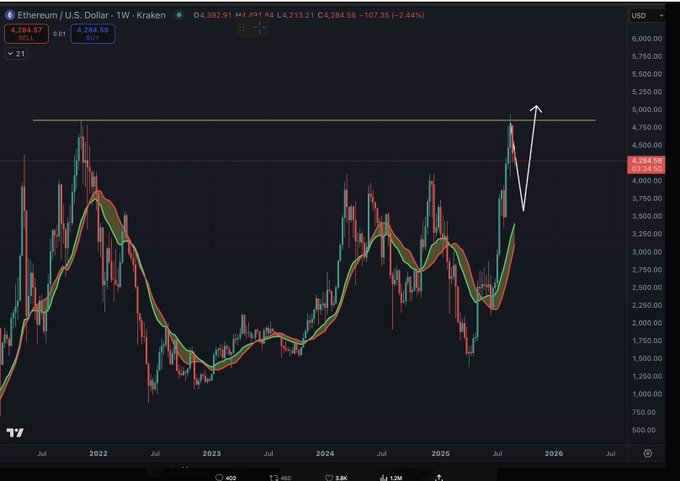
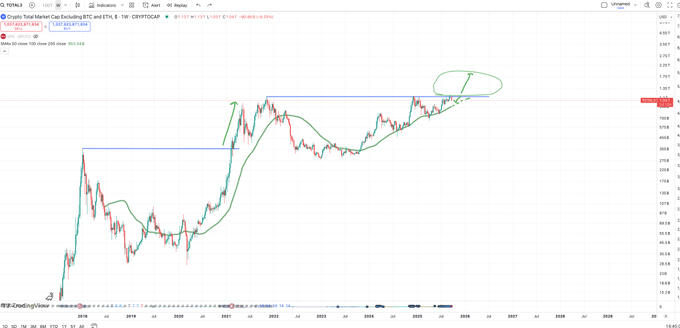
7) Total cryptocurrency market cap (excluding Bitcoin)
The total market cap (altcoins) has once again faced significant resistance at previous historical highs, while Ethereum is also pulling back from its highs. The 50-week moving average is steadily rising, and it seems to be retesting this average, with a potential upward breakout still months away. This looks more like a bullish pattern rather than a signal of "cycle ending."
8) Social media
Coinbase's app store ranking is outside the top 200, while Phantom and Moonshot are ranked quite high. I'm not sure if we really need retail investors to enter in order to reach a peak, nor do I think these apps need to break into the top three (or even need to return to the top spot), but the current ranking is as cold as the far side of Pluto.
Meanwhile, the viewership metrics for YouTube channels are still at bear market levels, just for reference.
免责声明:本文章仅代表作者个人观点,不代表本平台的立场和观点。本文章仅供信息分享,不构成对任何人的任何投资建议。用户与作者之间的任何争议,与本平台无关。如网页中刊载的文章或图片涉及侵权,请提供相关的权利证明和身份证明发送邮件到support@aicoin.com,本平台相关工作人员将会进行核查。


