Source: The DeFi Report
Original Title: Does Bitcoin Follow Gold?
Compiled and Organized by: BitpushNews

Year-to-date (YTD), gold has risen by 39%, while Bitcoin has only increased by 19%. The last time gold outperformed Bitcoin in a bull market was in 2020. In the first half of that year, gold rose by 17%, while Bitcoin increased by 27%.
What about the second half of 2020? Bitcoin soared by 214%, while gold only gained 7%.
This raises the question: Are we currently in a similar phase where Bitcoin is about to experience an incredible outperformance?
This report will delve into the relationship between Bitcoin and gold, revealing everything you need to know.
Disclaimer: The views expressed in this article are those of the author and should not be considered investment advice.
Let's get started.
Correlation Analysis
What Drives Gold Prices?
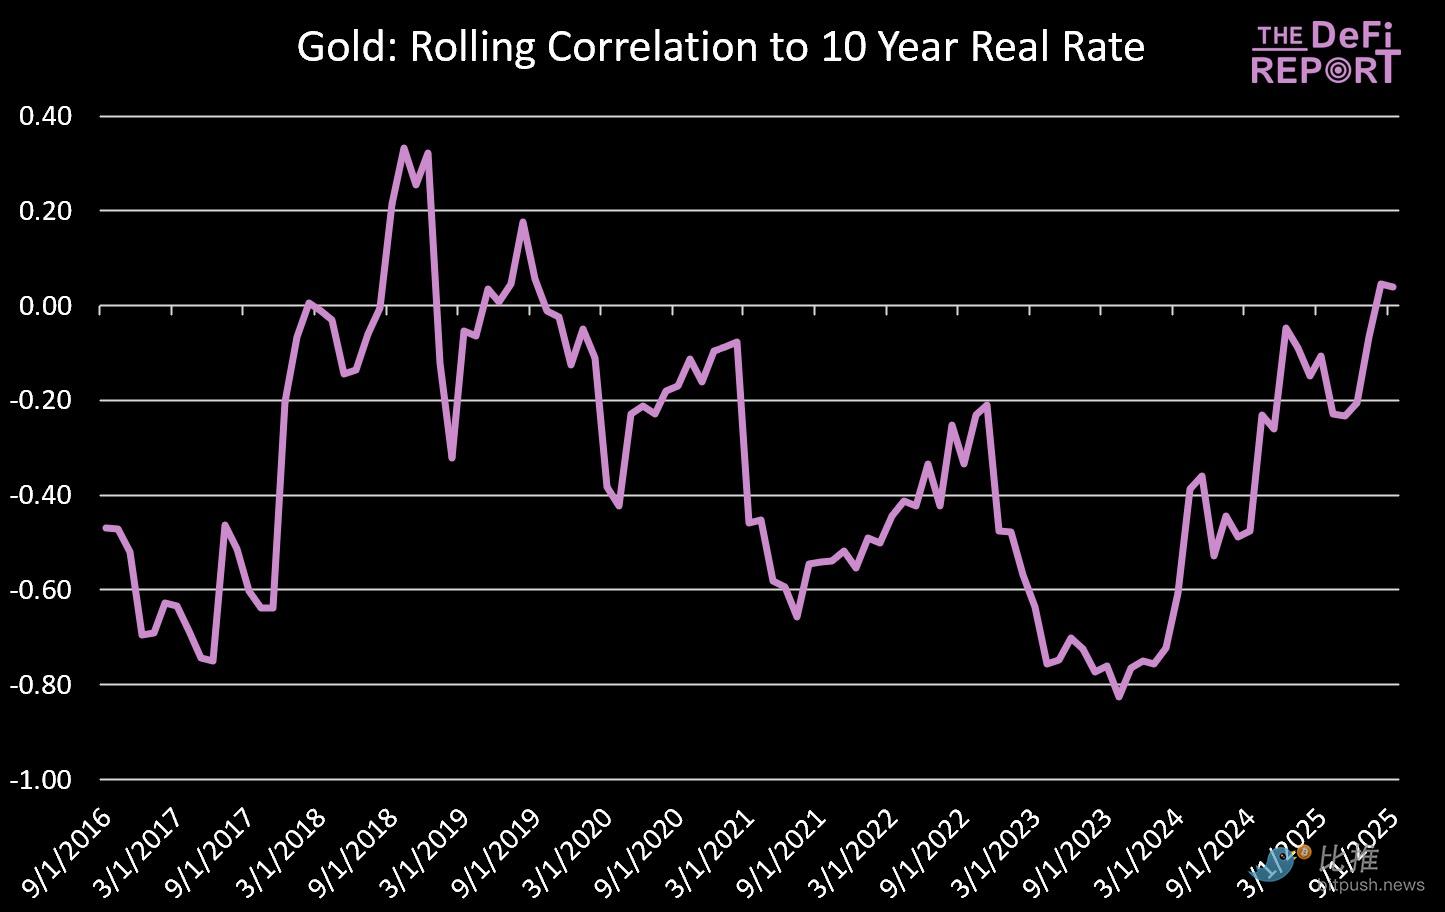
Gold vs. 10-Year Real Interest Rates Data Source: The DeFi Report
The above chart indicates a negative correlation between gold prices and real interest rates (based on monthly return changes and 10-year real interest rate changes).
In simple terms:
- When real interest rates decline (the nominal yield minus the inflation rate decreases), gold tends to perform well.
- When real interest rates rise (yields increase relative to inflation), gold often struggles (because gold itself does not generate income).
However, this relationship has recently decoupled, with both gold and real interest rates rising together—this movement may have been triggered after the U.S. expelled Russia from the SWIFT system in February 2022.
Currently, the R² value is 0.156, meaning that 15.6% of the movement in gold prices during this period can be statistically explained by changes in real interest rates.
Importance:
We are entering a period where real interest rates may decline—historically, this is a favorable setup for gold. For investors, this suggests that as inflation expectations stabilize above 2% and nominal yields decline, the upward momentum for gold may continue.
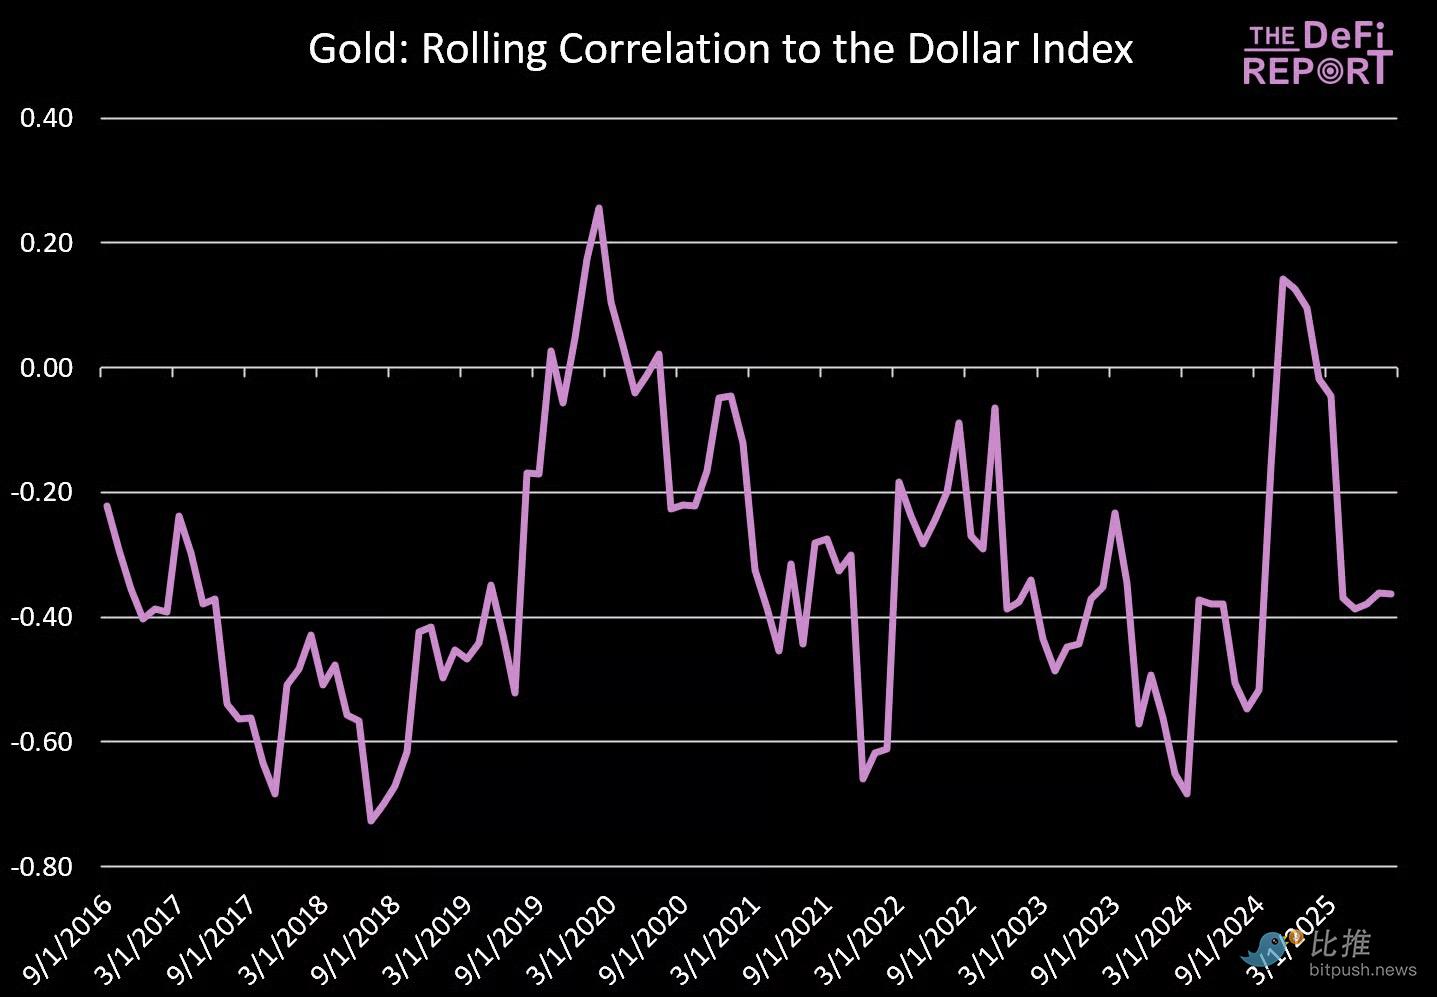
Gold vs. U.S. Dollar Index Data Source: The DeFi Report, FRED
Similar to its relationship with real interest rates, gold has historically maintained a negative correlation with the U.S. dollar index.
- When the dollar declines, gold tends to rise (as is currently the case).
- When the dollar strengthens, gold usually faces pressure.
The R² value is 0.106, indicating that approximately 10.6% of the movement in gold prices during this period can be statistically explained by fluctuations in the dollar.
Bitcoin vs. 10-Year Real Interest Rates
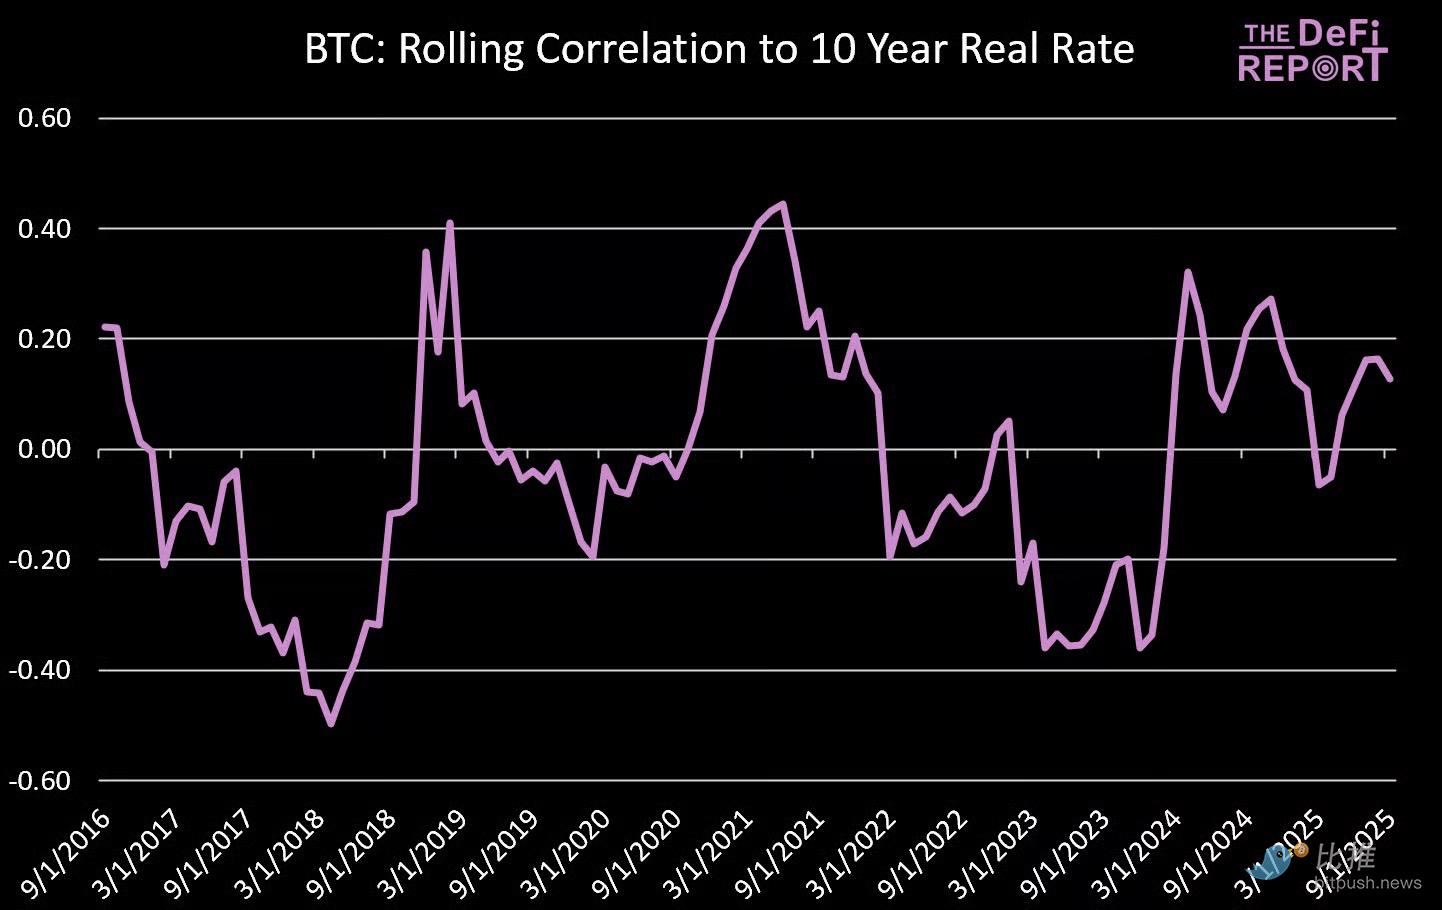
Data Source: The DeFi Report, FRED
Unlike gold, there is no significant relationship between Bitcoin and 10-year real interest rates.
Sometimes, Bitcoin rises as real interest rates decline. Other times, the opposite occurs. This inconsistency suggests that Bitcoin's price movements are not driven by the same macroeconomic factors that affect gold.
The R² value of 0.002 confirms this—real interest rates can hardly explain Bitcoin's returns.
Bitcoin vs. U.S. Dollar Index
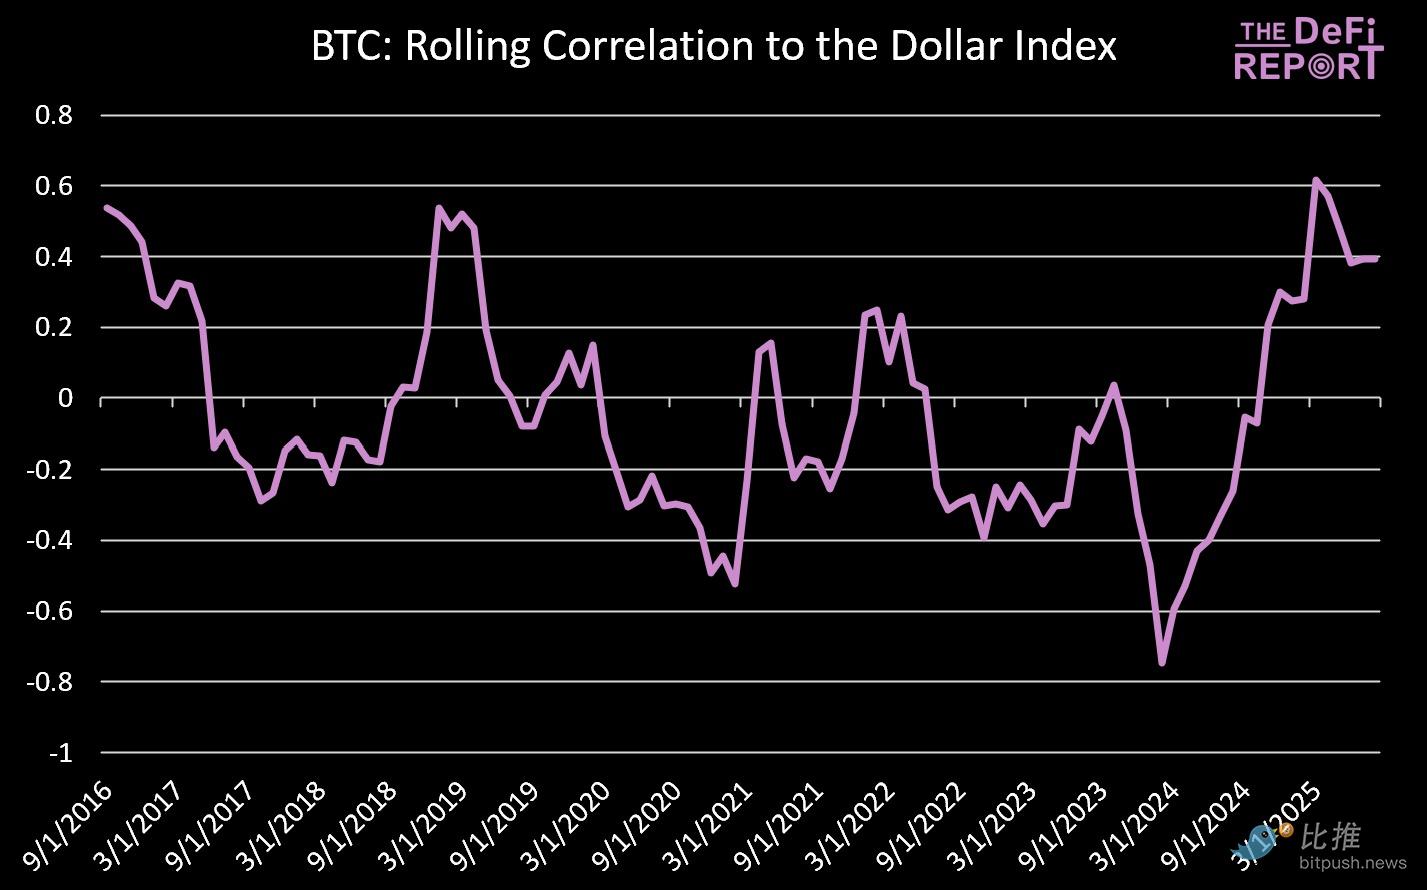
Data Source: The DeFi Report, FRED
There is also no consistent relationship between Bitcoin's price movements and the U.S. dollar index.
Sometimes, Bitcoin is negatively correlated with the dollar (rising when the dollar weakens), while at other times, it rises alongside the dollar. This inconsistency further indicates that Bitcoin is not driven by the same currency dynamics that affect gold.
The R² value of 0.011 reinforces this point—dollar fluctuations can only explain 1% of Bitcoin's returns.
Importance:
Unlike gold (which is typically measured in terms of dollar strength or weakness), Bitcoin's driving factors are different: adoption cycles, liquidity flows, on-chain reflexivity, and other unique factors/narratives.
Its lack of correlation with the dollar further confirms that Bitcoin is becoming a distinct asset class, rather than just "digital gold."
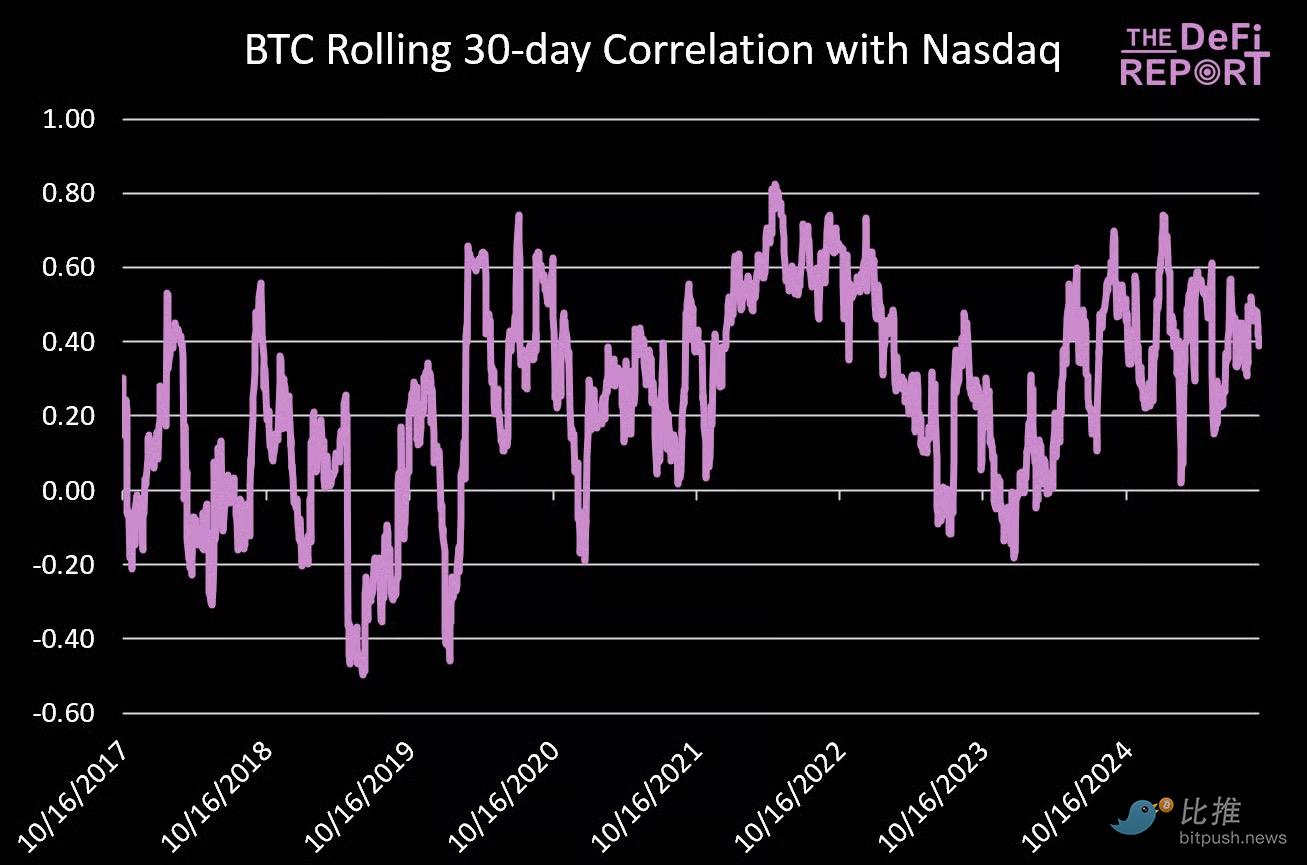
Bitcoin vs. Nasdaq Index
Data Source: The DeFi Report
Compared to macro drivers (such as real interest rates or the dollar), Bitcoin shows a stronger positive correlation with the Nasdaq index.
Since 2017, this relationship has remained consistent, with an R² of 0.089, meaning that approximately 8.9% of Bitcoin's price movements can be statistically explained by fluctuations in the Nasdaq index.
In contrast, during the same period, the R² for gold and the Nasdaq index is only 0.006—less than 1% of gold's returns are related to tech stock performance.
Bitcoin vs. Gold Correlation
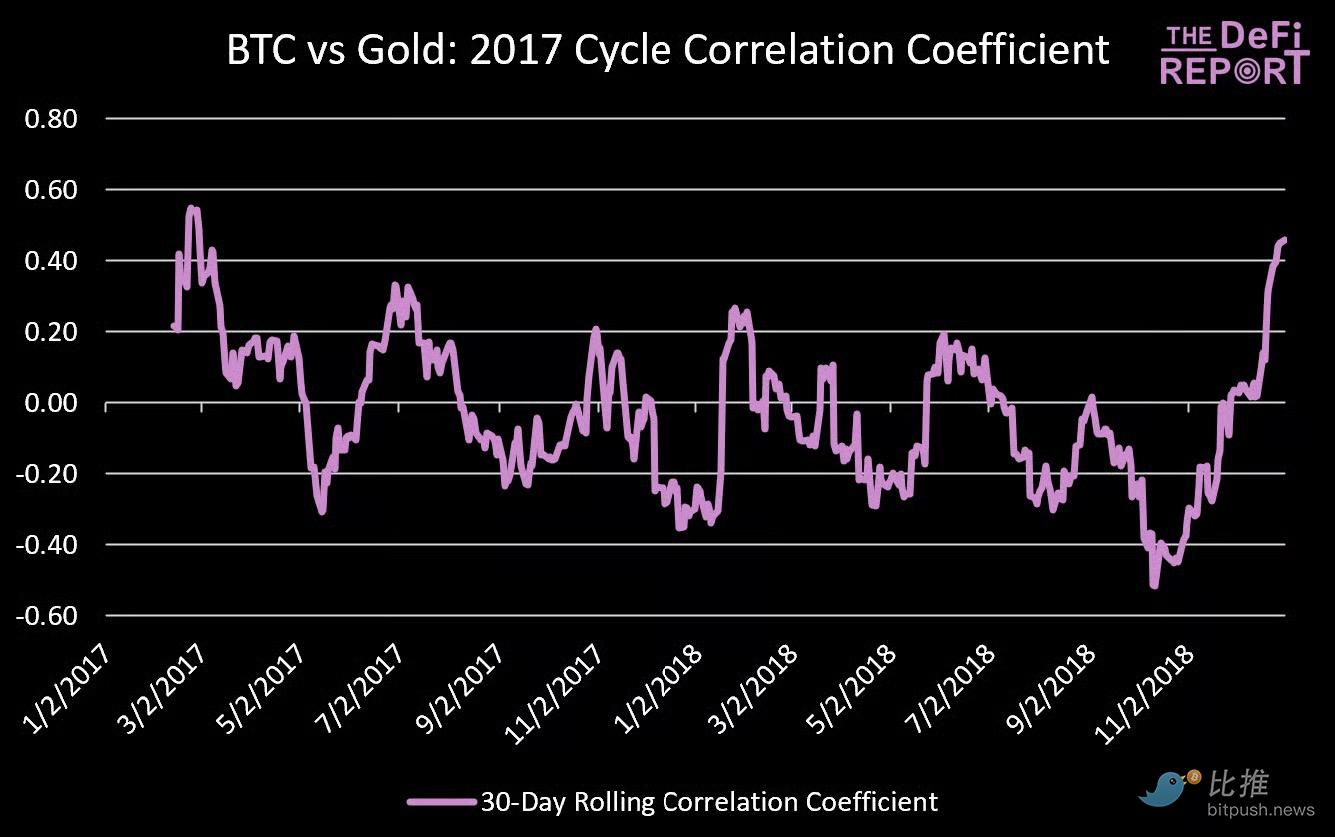
2017 Cycle Data Source: The DeFi Report
During the bull market cycle of 2017, Bitcoin and gold exhibited a weak correlation.
The R² for this period was only 0.033, meaning that from 2017 to 2018, gold could only explain about 3.3% of Bitcoin's price movements.
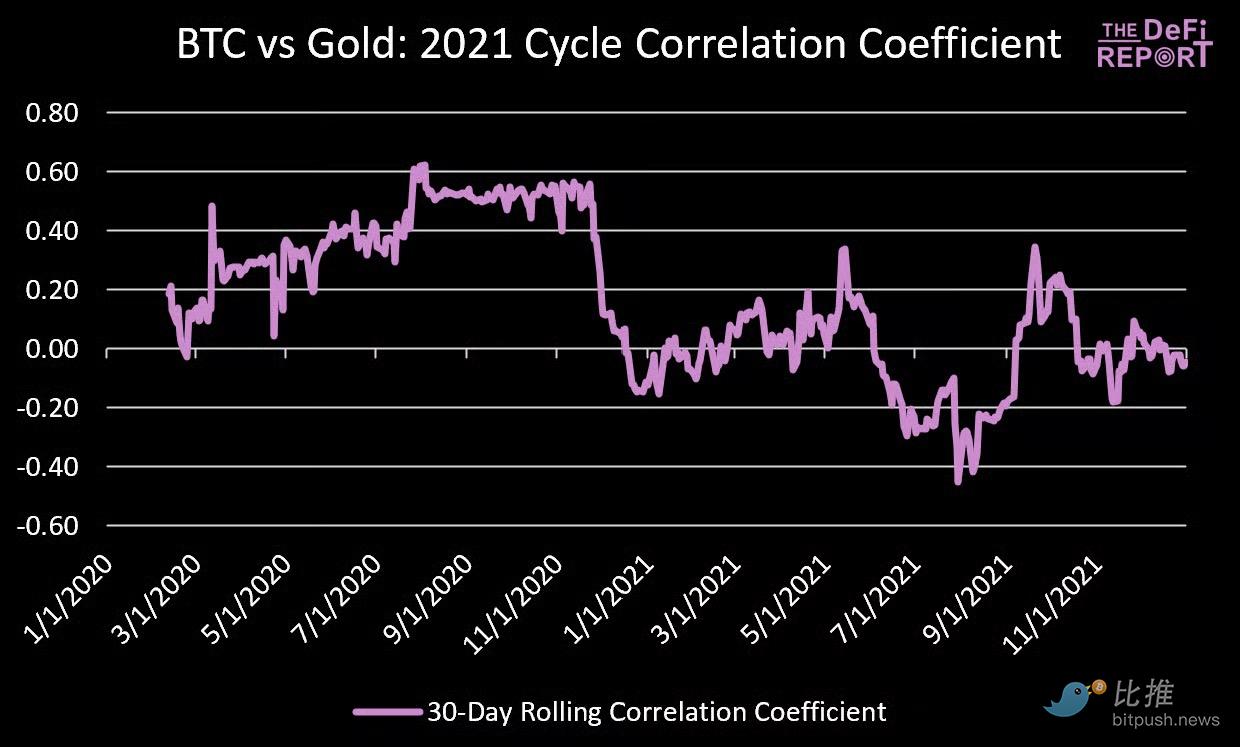
2021 Cycle
Data Source: The DeFi Report
Based on a 30-day rolling correlation, Bitcoin and gold show a slightly stronger relationship, particularly in 2020, when both assets rose together.
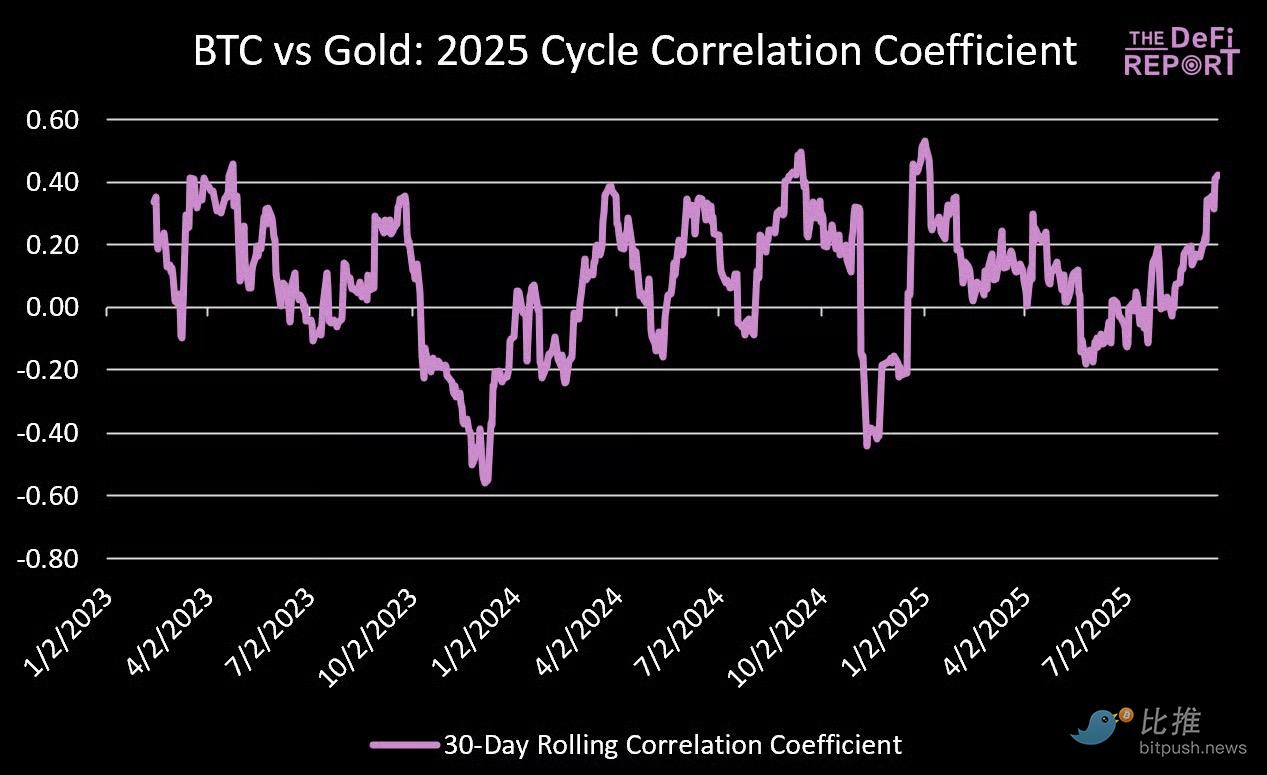
2025 Cycle
Data Source: The DeFi Report
In this cycle, the correlation between the two has weakened.
The R² for this period is 0.015—indicating that gold can only explain 1.5% of Bitcoin's price movements in this cycle.
Beta Coefficient
As analyzed above, the correlation between Bitcoin and gold is very weak.
So what about the beta coefficient? Does Bitcoin act like a "leveraged gold bet"?
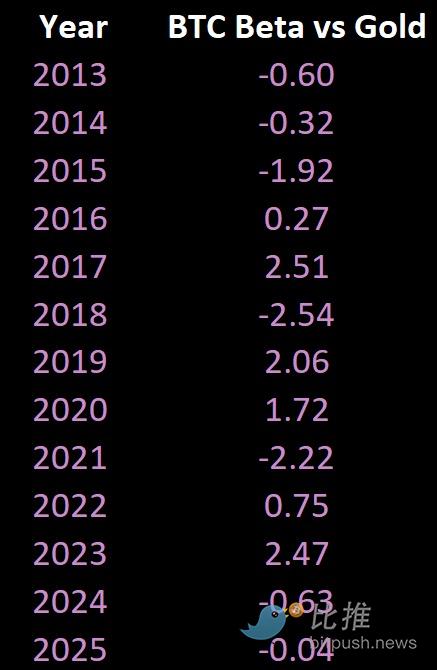
Data Source: The DeFi Report (monthly)
The answer is complex. It has indeed played such a role in 2017, 2019, 2020, and 2023.
However, in 2015 (a down year for Bitcoin), 2018 (another down year), and 2021 (a year of significant Bitcoin gains), Bitcoin's price movements were in stark contrast to gold's direction.
Bitcoin vs. Gold Returns
"Gold bugs" are thrilled because this year, gold has outperformed Bitcoin (39% vs. 19%). Since January 1, 2023, gold has risen by 102%, and the gold mining sector has performed even better (VanEck's Junior Gold Miner ETF, GDXJ, has risen 122% YTD).
We have even seen some cryptocurrency investors begin to add gold to their portfolios.
But if you own Bitcoin, do you really need to allocate gold in your portfolio?
This section of the report aims to answer that question.
Data Source: The DeFi Report
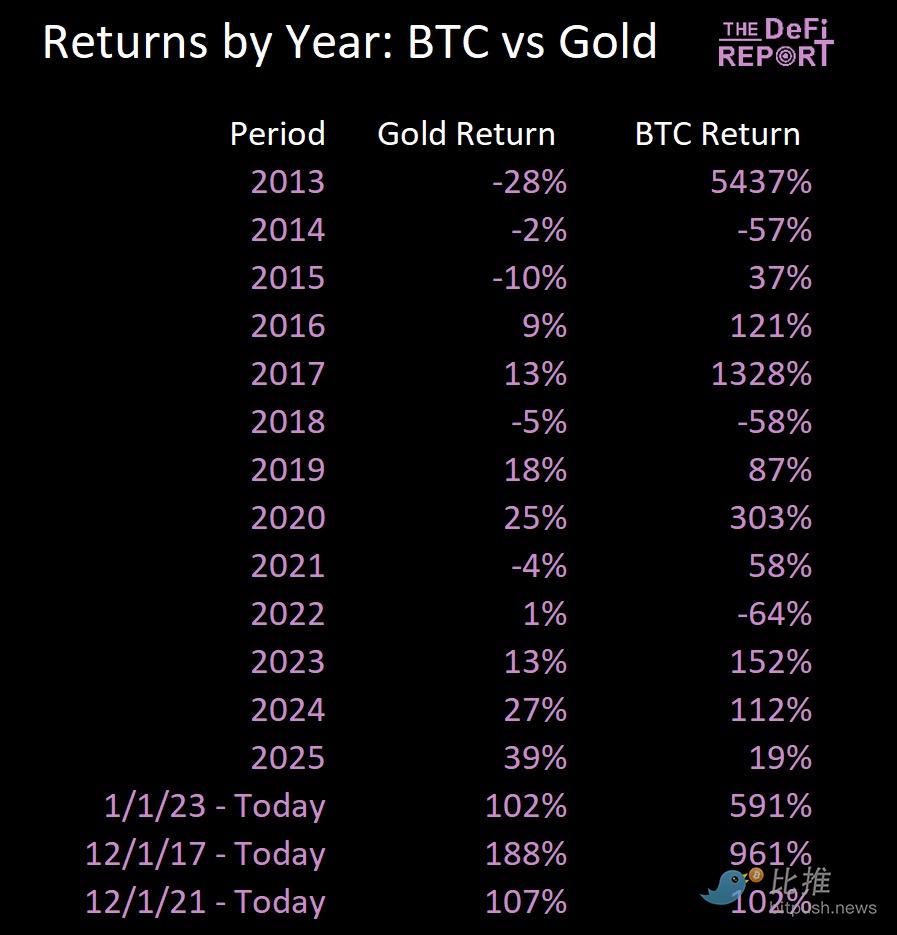
Data Source: The DeFi Report
Historically, Bitcoin has had superior returns (and volatility) compared to gold.
But how does it compare to gold's returns when adjusted for risk?
Risk-Adjusted Returns
- Sharpe Ratio: Measures the return per unit of risk (measured by volatility, including both upside and downside).
- Sortino Ratio: Measures the return per unit of downside risk. Unlike the Sharpe Ratio, it only accounts for "bad" volatility (i.e., downside volatility).
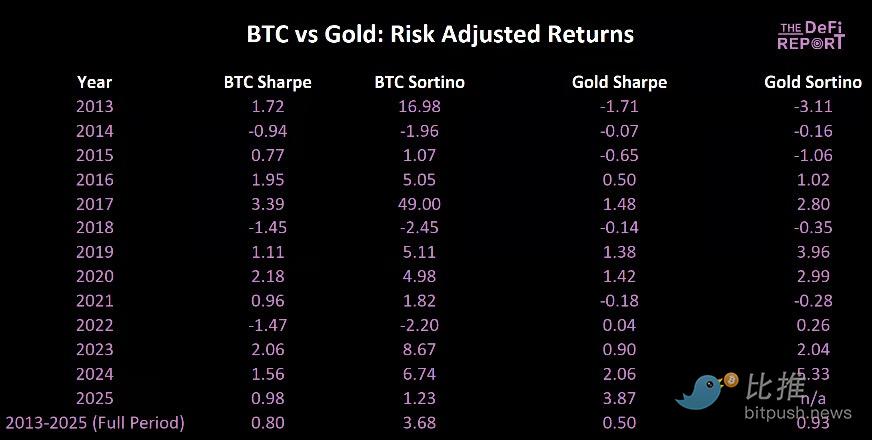
Data Source: The DeFi Report
We can see that Bitcoin tends to generate excellent risk-adjusted returns in bull market years (2017, 2020, 2023). However, in bear market years (2014, 2018, 2022), its high volatility leads to negative Sharpe ratios.
That said, the Sharpe ratio is not the best metric for measuring Bitcoin, as it penalizes all volatility (including upside volatility).
This is why we prefer to use the Sortino ratio to measure Bitcoin (which only penalizes downside volatility).
We can see that Bitcoin generates an excellent Sortino ratio, indicating that its volatility is a feature rather than a flaw.
For reference, a Sortino ratio above 2.0 is considered outstanding.
Impact of 5% Allocation
 Data Source: The DeFi Report
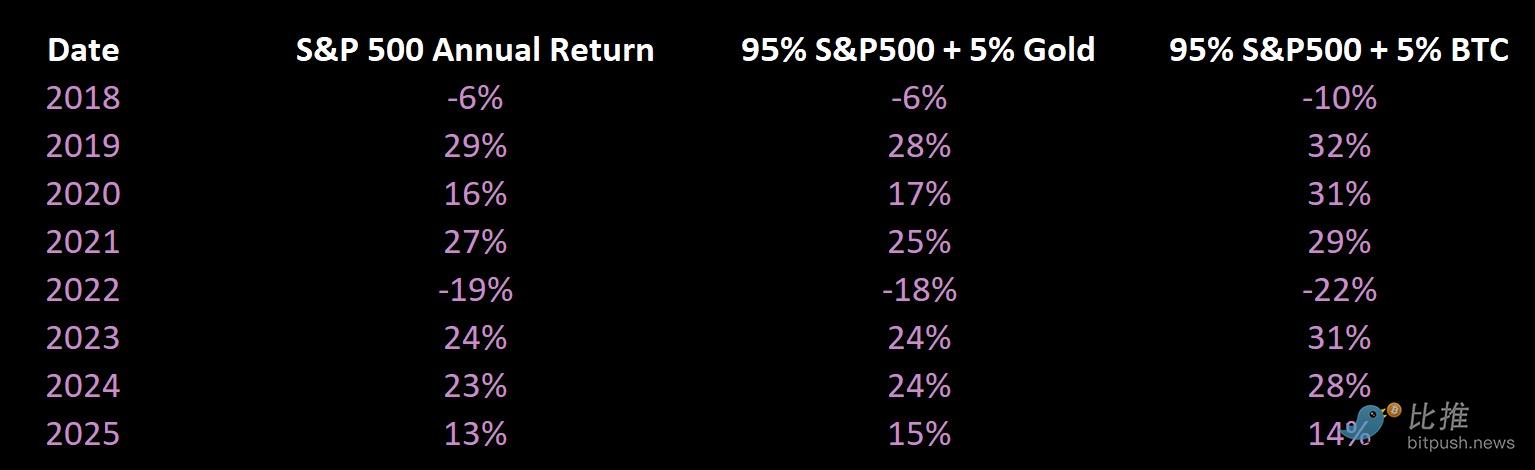
Total return since January 1, 2018 (5% allocation):
- 100% S&P 500 Index: 149%
- 95% S&P 500 + 5% Gold: 152%
- 95% S&P 500 + 5% Bitcoin: 199%
If the allocation to Bitcoin and gold is 10%:
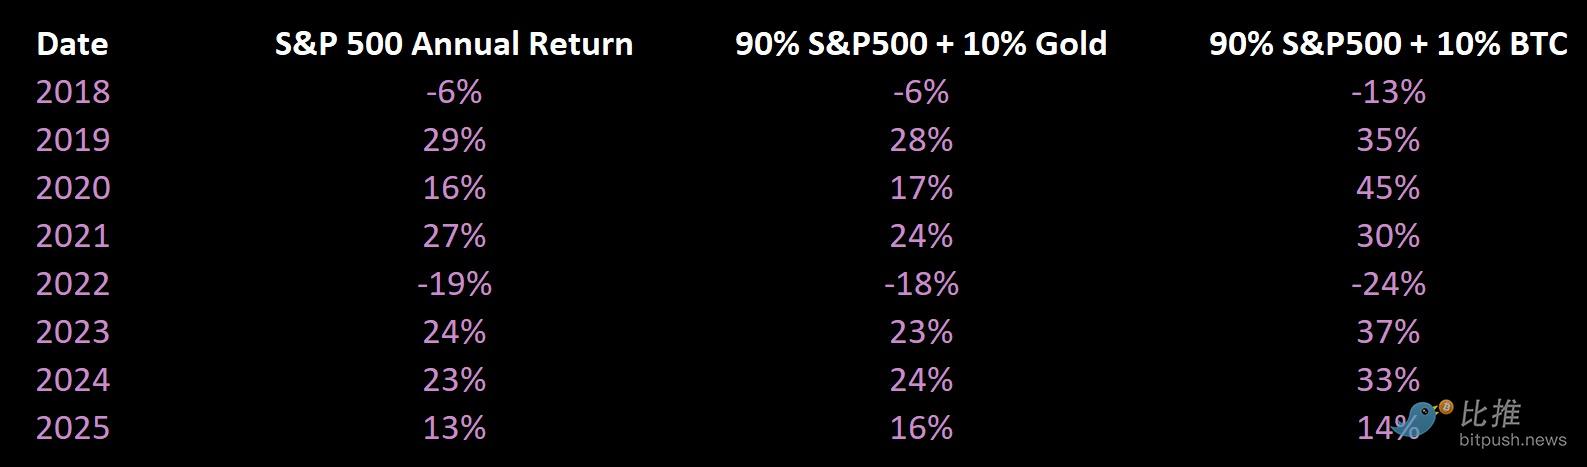
Total return since January 1, 2018 (10% allocation):
- 100% S&P 500 Index: 149%
- 90% S&P 500 + 10% Gold: 155%
- 90% S&P 500 + 10% Bitcoin: 253%
If you are primarily a cryptocurrency investor, should you own gold?
In our view, if you seek excess returns and can tolerate some volatility, Bitcoin is the superior asset. If your main goal is to preserve value, then gold certainly has a place.
In many ways, we believe the advantages of these two assets are generationally specific. Millennials and Gen Z tend to favor Bitcoin due to its asymmetric upside potential. The Baby Boomer generation may prefer gold for its inflation-hedging properties (with less upside potential but a proven track record of value preservation).
We have held gold in the past, but for the following reasons, we have shifted our "hard currency" allocation 100% to Bitcoin:
- Asymmetric upside potential: Bitcoin has a very low global penetration rate compared to gold.
- Superior scarcity: A hard cap of 21 million coins, with supply being inelastic to demand.
- Portability: Bitcoin is a hard currency asset that comes with a global payment network and accounting system.
- Divisibility: Gold is not easily divisible or fractionalized.
- Transparency and verifiability: The circulating supply of gold is unknown, and verifying its purity and ownership requires third-party trust.
- Liquidity with 24/7/365 market access.
- Demographics: Bitcoin is global and has stronger brand equity among younger generations.
- Financialization: Bitcoin is increasingly being integrated into the global financial system.
Conclusion
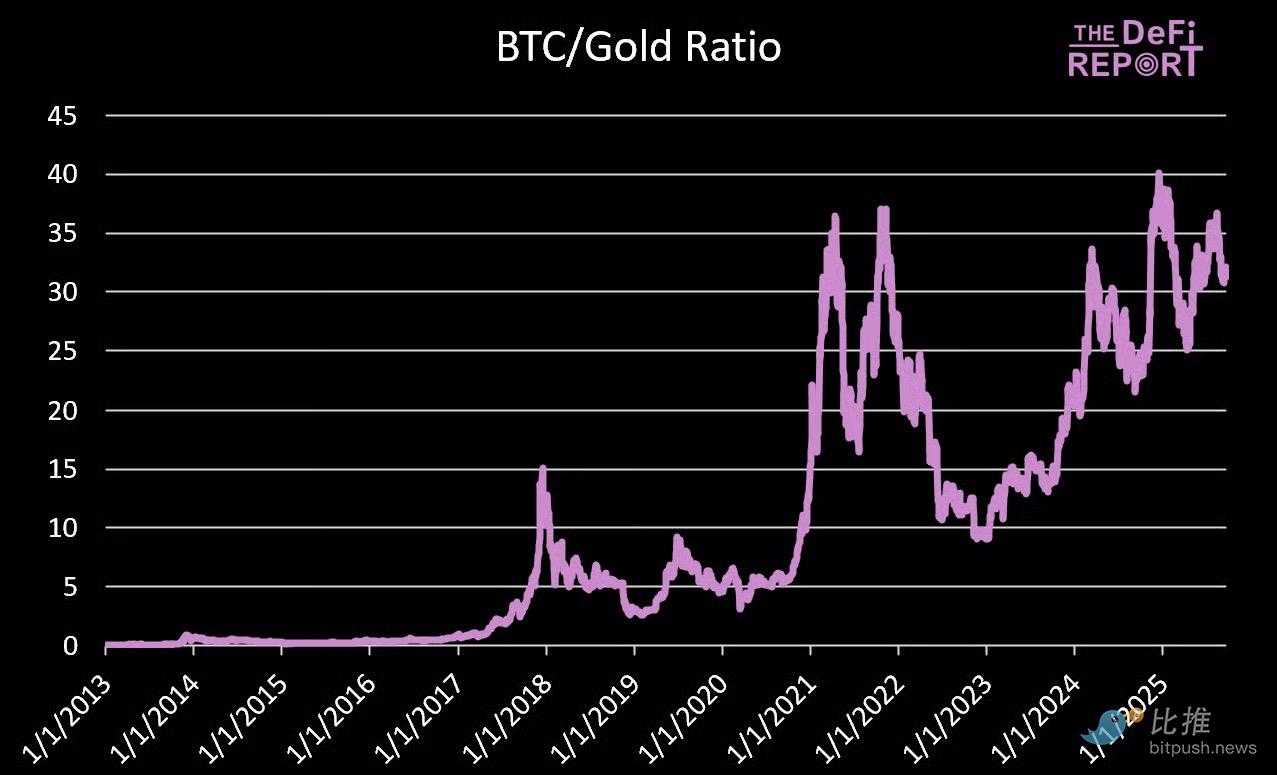
In the 21-year cycle, it feels like "gold has led Bitcoin." However, it is difficult to find conclusive evidence of a lasting connection between these two assets.
Bitcoin is often referred to as "digital gold" due to its "hard currency" characteristics.
But its trading behavior bears almost no resemblance to gold—gold serves as an inflation hedge due to its negative correlation with the dollar and real interest rates.
In contrast, Bitcoin is rising as a distinct asset class—its driving factors include technological adoption, financialization, global liquidity, reflexivity, and adoption cycles.
免责声明:本文章仅代表作者个人观点,不代表本平台的立场和观点。本文章仅供信息分享,不构成对任何人的任何投资建议。用户与作者之间的任何争议,与本平台无关。如网页中刊载的文章或图片涉及侵权,请提供相关的权利证明和身份证明发送邮件到support@aicoin.com,本平台相关工作人员将会进行核查。


