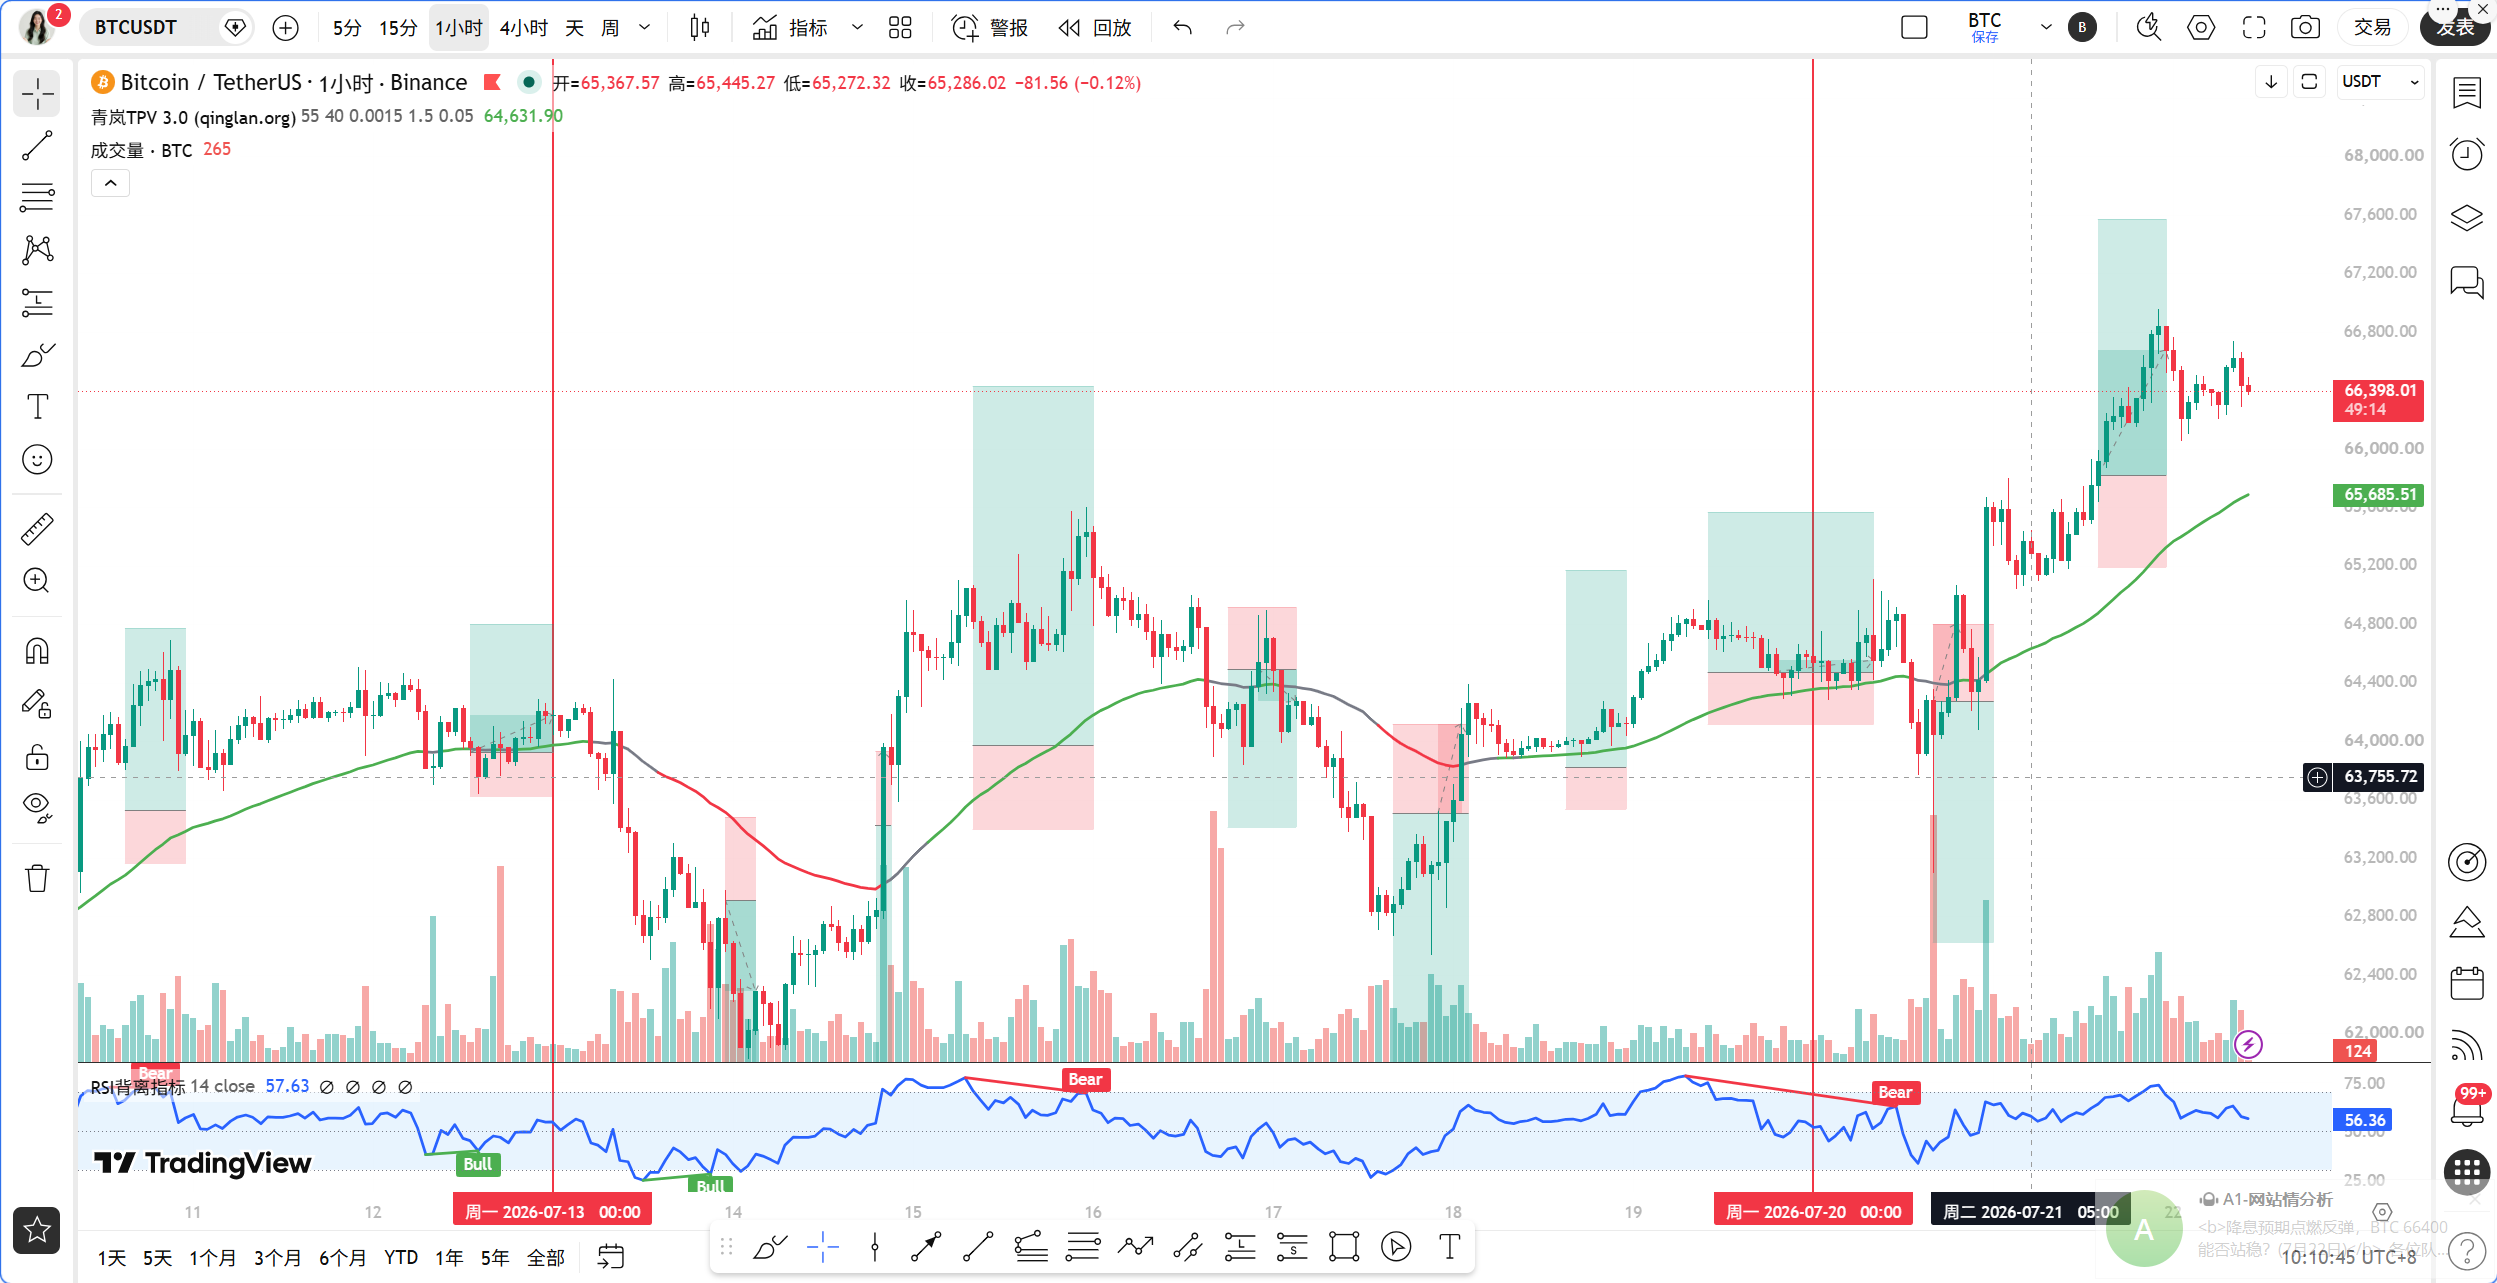
Dear teammates, I am Qinglan. This morning at 10:00, the BTC price was 66415 USDT, and market sentiment was wavering between bearish and bullish. In the focus news, the probability of a Federal Reserve rate hike in July has dropped to 21.9%, with expectations for a rate cut heating up, which is directly beneficial for risk assets. However, on the other hand, whales are closing their positions with losses in ETH and Satsuma is delisting BTC, casting a shadow over the market. This tug-of-war between bulls and bears is exactly the moment that tests our trading system. Today, I will use the TPV system to break down the market and find the key support and resistance levels.
Current time: July 22, 10:10, BTC price 66415 USDT.
Overview of multi-period status. On the daily level, the price is above MA5 and MA10, with MACD column at 414.54 and RSI at 69.25, indicating a strong bullish trend, but RSI is approaching 70, posing a risk of being overbought. On the 4-hour level, the price is above MA5 and MA30, with MACD column at 128.68 and RSI at 70.37, also showing strong bullishness, but RSI is similarly high. On the hourly level, the price is above MA5 and MA30, with MACD column at -57.11 and RSI at 46.03, indicating a decrease in momentum, showing signs of a top divergence. On the 15-minute level, the price is fluctuating around MA30, with MACD column at -9.68 and RSI at 55.43, leaning towards neutral in the short term. Overall, the larger cycle is bullish, but the smaller cycle lacks momentum and requires caution for a pullback.
Verification of TPV signals. First, let's look at the core rules; the current 1-hour EMA55 is 65716.12. In the past 8 one-hour candles, the closing price was greater than EMA55 8 times, crossing it 0 times, and the price is 1.06% away from EMA55, which does not meet the oscillation threshold and is in a unilateral bullish trend. Regarding the conditions for going long, the price is stable above the 1-hour EMA55, with two consecutive candles closing above EMA55, satisfying condition 1. In terms of support stabilization, the recent price has rebounded from around 65000, forming an effective low point, satisfying condition 2. For momentum, although the 1-hour MACD column is negative, it has shortened for two consecutive periods, and RSI has risen from below 30, satisfying condition 3. Therefore, the TPV system gives a bullish signal. However, it should be noted that the 15-minute MACD column is still shortening, indicating short-term pullback pressure.
On-chain and fund perspectives. The Fear and Greed Index is at 33, in the fear zone, indicating cautious market sentiment, which is often a signal of the bottom region. BTC's 24-hour fluctuation is 1.61%, with a mild rebound. The funding rate shows that bearish sentiment is weakening, and the market is warming up. BlackRock withdrew 1789 BTC from Coinbase Prime, increasing their holdings by 119 million dollars, with institutions continuously increasing their positions, which is a long-term positive. However, whales closing positions with losses in ETH and Satsuma liquidating BTC indicates that short-term selling pressure remains. The battle between bulls and bears is intense, and it is necessary to pay attention to breakthroughs at key positions.
Key support and resistance levels. The resistance level above is at 67000, which is the previous high and a psychological barrier. If it breaks out with volume, look for 68000. The support level below is at 65700, which is the 1-hour EMA55, marking the boundary between bulls and bears. If it breaks below, it may retest 65000. The mid-range of 66300-66500 is the current oscillation range, and we need to wait for a directional choice.
Trading strategy. Direction: Buy on dips. Entry conditions: Wait for the price to pull back near the 1-hour EMA55, specifically in the 65700-65800 range, showing a long lower shadow or a bottoming signal while the 15-minute MACD column turns from negative to positive. Set the stop-loss at 65300, below the previous low. The first target is 67000, and the second target is 68000. If the price breaks directly above 67000, wait for a pullback confirmation before chasing long, with a stop-loss set below 66500. Note that if the price breaks below 65700 and cannot recover quickly, the bullish signal will be invalidated, and we will turn to a wait-and-see position.
Risk warning: The rate cut expectations may be over-digested by the market, and if the Federal Reserve sends a hawkish signal, BTC may quickly pull back.
Follow Qinglan's cryptocurrency class to grasp more trading opportunities! Welcome to visit the official website www.qinglan.org
📊 Qinglan TPV trading strategy backtest reference
🕒 Last backtest time 07-22 07:00:01
Total analysis: 3119 Backtests: 2354 Accuracy rate: 76.6% (1804/2354)
免责声明:本文章仅代表作者个人观点,不代表本平台的立场和观点。本文章仅供信息分享,不构成对任何人的任何投资建议。用户与作者之间的任何争议,与本平台无关。如网页中刊载的文章或图片涉及侵权,请提供相关的权利证明和身份证明发送邮件到support@aicoin.com,本平台相关工作人员将会进行核查。