Academician of the cryptocurrency circle: On July 22, the technical pattern of Bitcoin (BTC) harbors signs of a potential reversal, has the future direction become clear? Latest market analysis and operation suggestions explanation
Currently, Bitcoin is at 66500, not rising decisively and not falling sharply, essentially the main force is washing out the weak hands. Several friends in the crypto community who added me recently always think about bottom-fishing and peak-escaping, constantly swayed by the red and green bars, fearing being trapped when chasing high, and fearing missing out when shorting, ultimately just getting slapped from both sides. Everyone knows I've been going north when below 60,000; they always watch and watch. The crypto world is most abundant in opportunities, but the most lacking in discipline and patience. Remember: earn money within your understanding, be a bit slower and steadier, only by staying alive will you have the chance to turn things around.
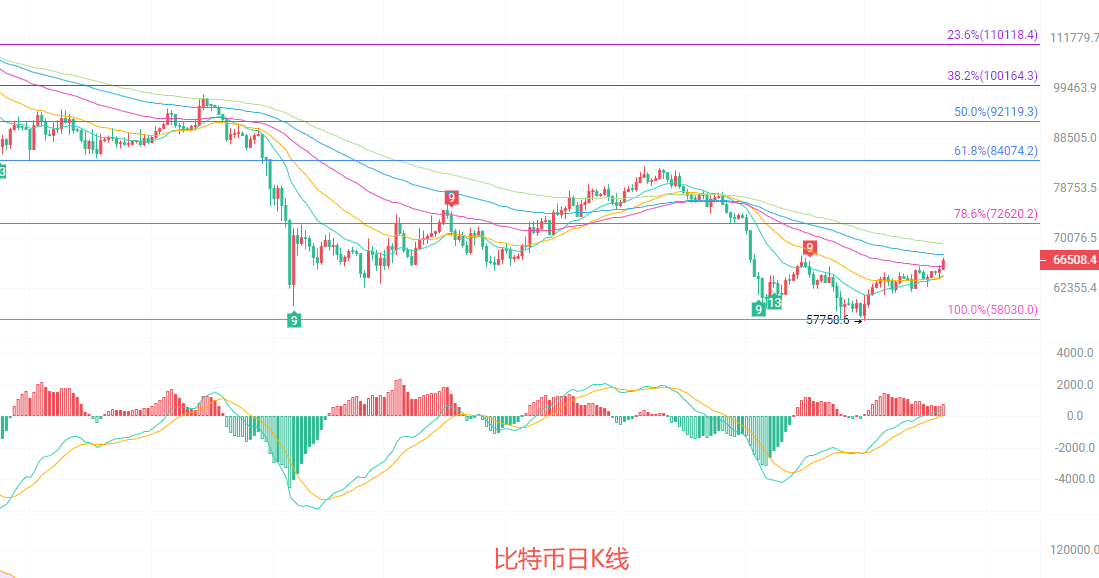
The daily candlestick is currently in a critical game zone. The current price has broken through the BOLL middle track at 63819, touching the upper track above 66121, with the Bollinger Bands opening up slowly, and short-term bullish momentum still being released. The MACD indicator shows that the DIF and DEA have formed a golden cross, with the red bars continuing to increase in volume; the trend at the daily level has shifted from bottom repair to a bullish bias. However, note that the Fibonacci 78.6% resistance level above is around 72620, which is still a significant distance from the current price; below, the EMA15 and EMA30 form strong support, as long as this moving average group is not broken, the daily bullish structure remains intact.
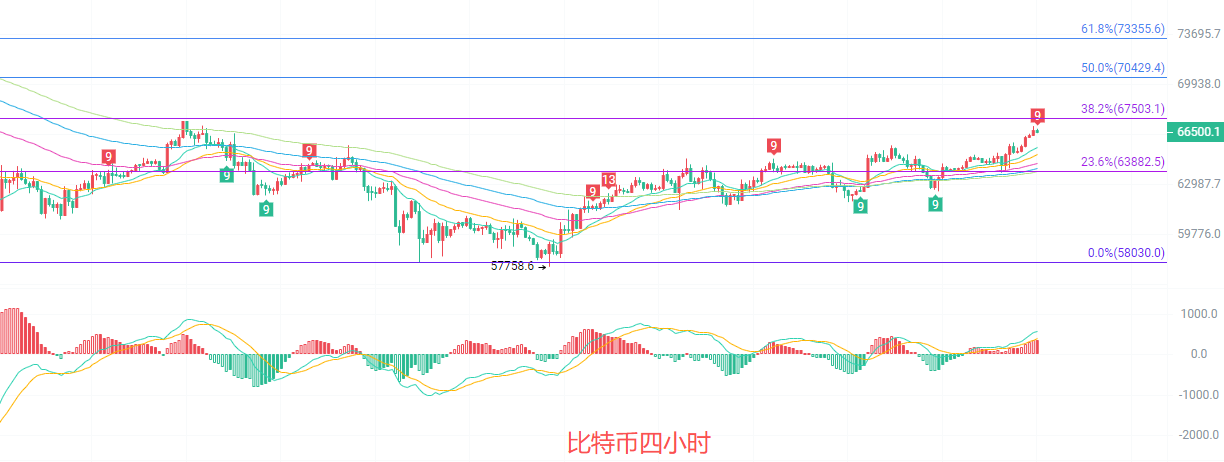
The four-hour candlestick is currently testing the Fibonacci 38.2% resistance level at 67503, facing slight pressure in the short term. The EMA moving average group is showing a bullish arrangement, with prices firmly holding above EMA15 and EMA30, indicating strong support from the moving averages. The MACD indicator's DIF and DEA golden cross continues, the red bars have shrunk in volume but have not shown a turning signal, indicating that the bullish momentum has weakened but has not reversed. The upper Bollinger Band is around 66632, almost level with the current price; a short-term breakthrough of the upper band would open up upward space, while if it faces resistance and falls back, attention should be paid to the support strength around the middle track at 65108.
Short-term reference:
Do not break below 64300 to 64700, stop loss at 63900, target looking at 66000 to 67500.
Do not break above 67000 to 67500, stop loss at 68000, target looking at 65500 to 64500.
Specific operations should mainly rely on real-time market data for more information details can be consulted with the author; articles may be published with a delay, suggestions are for reference only and risks are borne by oneself.

Warm reminder: The above content is solely created by the author of the public account, the advertisements at the end of the article and in the comment section are unrelated to the author; please be cautious in discerning, thank you for reading.
免责声明:本文章仅代表作者个人观点,不代表本平台的立场和观点。本文章仅供信息分享,不构成对任何人的任何投资建议。用户与作者之间的任何争议,与本平台无关。如网页中刊载的文章或图片涉及侵权,请提供相关的权利证明和身份证明发送邮件到support@aicoin.com,本平台相关工作人员将会进行核查。