Good early morning, teammates. I am Sister Qinglan. The focal point of the market this early morning is very clear. One is that a giant whale is long on BTC with 4x leverage, holding a position worth 150 million dollars, and the unrealized profit has expanded to 60 million dollars, targeting directly at 300 million dollars. The other is the escalation of geopolitical conflicts, with the Iranian Revolutionary Guard striking U.S. military radars, causing WTI crude oil to soar 3% and break through 85 dollars, increasing the risk-averse sentiment. These two pieces of news, one is a strong stimulus from the funds side, and the other is a black swan from the macro perspective, jointly pushing BTC to the position of 66637. Can it stabilize above 67000 tonight, or will there be violent fluctuations at the high? Sister Qinglan will break it down with data.
Current BTC price is 66637 USDT, as of 00:13 on July 22. This position is just stuck near the key pressure zone on the daily chart, with intense long-short battles underway.
First, let's look at the multi-timeframe status. On the daily chart, MA5 is at 65076, MA10 at 64512, the moving averages are in a bullish arrangement, MACD bar value is 406.39, in positive and expanding state, RSI is at 63.95, which is in a strong zone but not overheated. Overall, the daily trend is bullish, but the price is somewhat deviated from MA5, indicating a technical correction is needed. On the 4-hour chart, MA5 is at 66282, MA10 at 65669, MACD bar value is 181.67, RSI is at 73.64, close to the overbought zone. The 4-hour shows that short-term momentum remains strong, but RSI is relatively high, requiring caution for potential pullbacks. On the 1-hour chart, MA5 is at 66700, MA10 at 66473, MACD bar value is 47.86, RSI has risen to 81.39, indicating serious overbought territory. On the 15-minute chart, MACD bar value is -27.41, showing a slight topside divergence, RSI is at 53.80, indicating a deceleration in short-term momentum. In summary, the daily and 4-hour bullish patterns remain unchanged, but the 1-hour and 15-minute charts have presented overbought and divergence signals, indicating short-term pullback pressure.
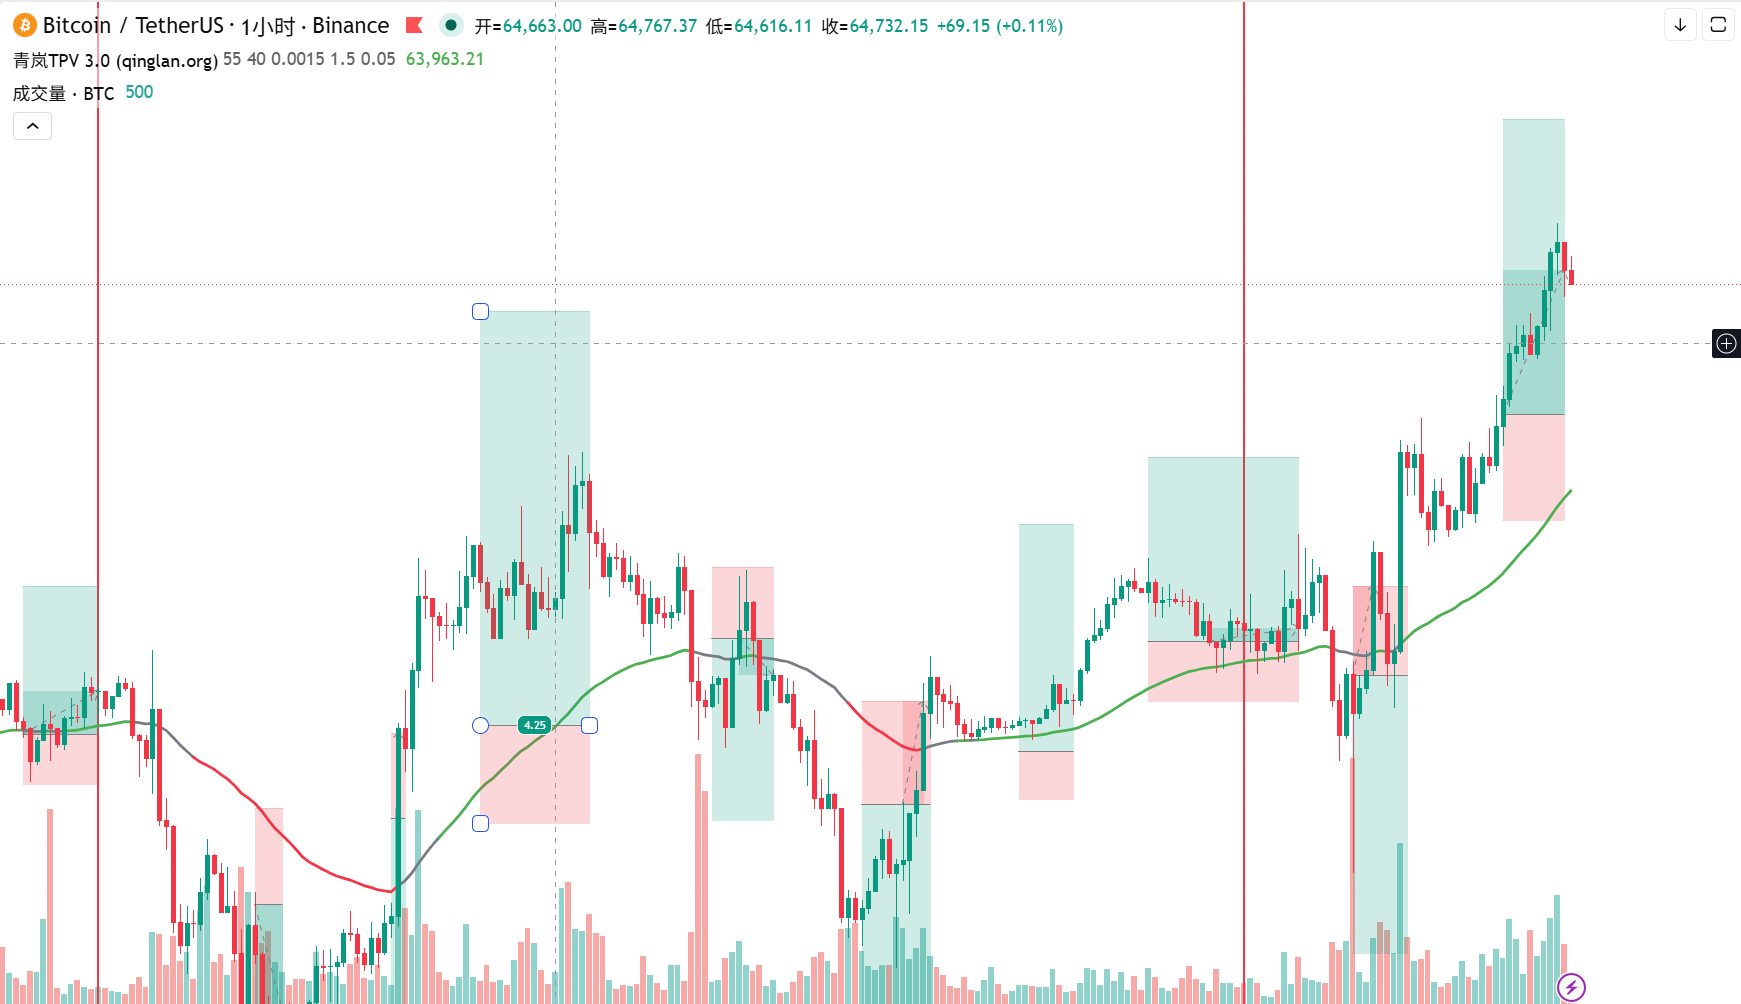
Next is the signal verification of the Qinglan TPV system. First, let's look at the trend positioning. Current price 66637 is far above the 1-hour EMA55 at 65373, with a margin of 1.93%, and all the closing prices of the past 8 1-hour candles are above EMA55, with zero crossings. This fully aligns with a one-sided bullish trend and does not meet the conditions for a sideways market. Therefore, the current main direction is bullish, but we need to wait for pullback stabilization signals. For long conditions, first, the price remains above EMA55, which is already satisfied. Second, support stabilization, currently the price is around 66600, and there has been no significant long lower shadow or bottom formation, waiting for clearer stabilization signals. Third, the downward momentum should weaken, currently the 1-hour MACD bars are positive, but the RSI at 81 indicates excessive momentum rather than weakening, thus we need to wait for the RSI to fall below 70 after a pullback, and for the MACD bars to shorten. For short conditions, first, pressure is applied below EMA55, which is not satisfied. Second, pressure meets resistance, currently the price is in the 66600-66800 area, which is a previous dense trading area, indicating pressure, but there have been no significant long upper shadow or top formation. Third, weak rebounds, currently RSI is at a high position, but MACD bars are still expanding, indicating rebound momentum has not weakened. Therefore, the current signal given by the TPV system is: a clear bullish trend, but short-term overbought, not advisable to chase longs, wait for pullback stabilization before entering.
In terms of on-chain and funds, the fear and greed index is at 25, classified as extreme fear. This data is interesting, as the price is rising, but market sentiment is extremely fearful, indicating that retail investors are still hesitant while whales are accumulating. BTC’s market share is 56.89%, at a high level, indicating funds are still concentrating in BTC. A whale making a long position on BTC at 4x leverage with expanded unrealized profits is a strong bullish signal, but high leverage also means great risk of liquidation in case of a pullback. Regarding geopolitical risks, the surge in oil prices and the demand for safe-haven assets is theoretically beneficial for BTC, but we also need to be cautious about the potential for global liquidity tightening due to escalating geopolitical conflicts, which could suppress risk assets.
In terms of key attack and defense levels, the first resistance level above is in the 66800-67000 region, which is a previous high point and near the upper band of the 4-hour Bollinger Bands. If it breaks through 67000 with volume, the next target is 68000. The first support level below is at 66000, which is the resonance position of 1-hour MA10 and 4-hour MA5. If it breaks below 66000, the next support is at 65373, i.e., 1-hour EMA55. If this level is also lost, the trend may turn bearish.
In terms of trading ideas, Sister Qinglan provides a specific plan. The direction is to focus on bullish positions through pullbacks, not chasing highs. Entry conditions are to wait for the price to pull back to the 66000-66200 area, showing a 15-minute bottom formation or a long lower shadow, while the RSI falls below 50, and the MACD bar turns from negative to positive. Set stop-loss at 65800, that is, below the 66000 integer level. The first target level is at 66800, the second target level is at 67200. If the price breaks through 67000 directly and stabilizes, a small position can be taken, with stop-loss set at 66700, aiming for 67500. If the price breaks below 65800, give up the long position and maintain a wait-and-see stance.
In terms of risk reminders, geopolitical conflicts and soaring oil prices may trigger market volatility, and the positions of high-leverage whales could become a fuse for market manipulation, so please strictly control your position and ensure proper risk control.
Follow Qinglan Crypto Classroom to grasp more trading opportunities! Visit the official website www.qinglan.org
📊 Qinglan TPV Trading Strategy Backtest Reference
🕒 Last Backtest Time 07-21 07:00:39
Total Analysis: 3095 Backtests: 2345 Accuracy Rate: 76.5% (1795/2345)
免责声明:本文章仅代表作者个人观点,不代表本平台的立场和观点。本文章仅供信息分享,不构成对任何人的任何投资建议。用户与作者之间的任何争议,与本平台无关。如网页中刊载的文章或图片涉及侵权,请提供相关的权利证明和身份证明发送邮件到support@aicoin.com,本平台相关工作人员将会进行核查。