Bitcoin has once again exhibited an "independent trend".
Written by: Bootly, BitpushNews
On Tuesday, Wall Street closed with the storage chip sector continuing to face heavy losses.
The Dow initially closed down 0.25%, the S&P 500 fell 0.45%, and the NASDAQ dropped 1.16%. The pullback in storage chip stocks intensified—SanDisk (SNDK.O) fell 7%, Western Digital (WDC.O) declined nearly 8%, Micron Technology (MU.O) dropped 4.7%, and SpaceX (SPCX.O) plummeted nearly 7%.
Bitcoin briefly reached a two-week high of $64,597 during trading before retreating slightly, ultimately stabilizing above $63,500.
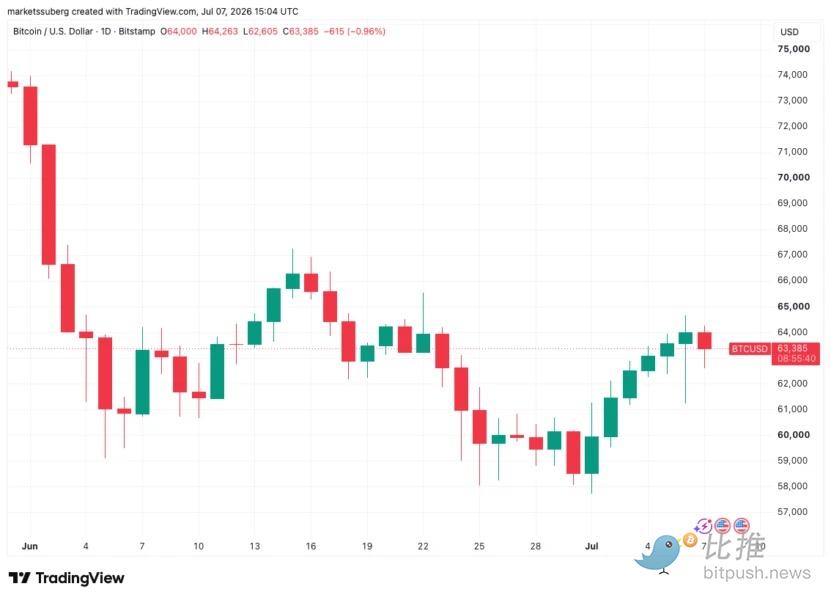
On a day when the NASDAQ fell over 1% and the chip sector collectively collapsed, Bitcoin's decline was much smaller than that of tech stocks—once again showing a "relatively independent" trend.
The Truth Behind the Short-term Rebound: Dominated by Short Covering
What exactly is the driving force behind this rebound?
On-chain data indicates that Bitcoin futures open interest (OI) has decreased from a peak of 776,000 BTC on July 3 to 740,000 BTC, suggesting that derivatives traders have not participated in this rally. Meanwhile, the negative premium on Coinbase indicates that the spot buying demand from U.S. investors remains weak.
In other words, this rebound is more a result of short squeezing—rather than fresh long positions entering the market.
Analysts from Bitfinex stated in a report: "This support level has not been confirmed until there is sustained structural institutional demand from BlackRock's IBIT."
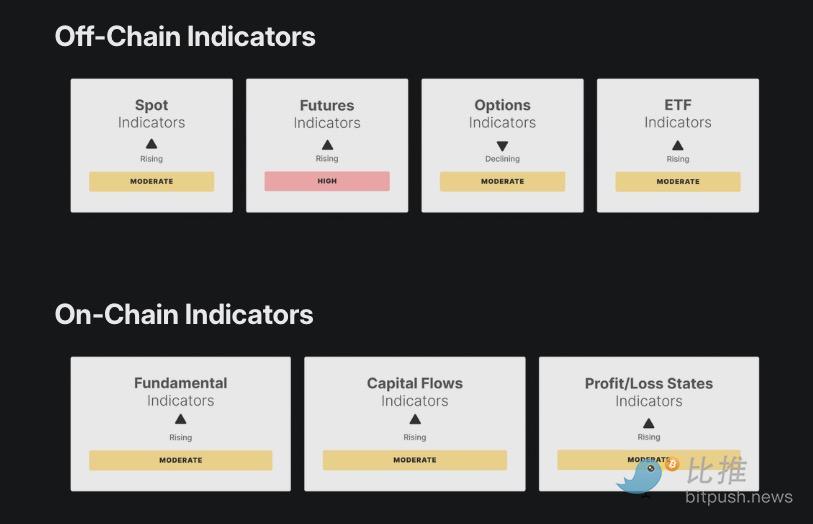
The Glassnode market report also pointed out that the current market's coin-to-coin trading volume remains sluggish, while the open interest and long funding rates for contracts have increased.
ETF Funding: Trend Not Confirmed
One point that still needs observation is the shift in ETF fund flows.
On Monday (July 6), the U.S. spot Bitcoin ETF recorded a net inflow of $265.7 million, the largest single-day net inflow since May. Of this, BlackRock's IBIT contributed $209.4 million. In terms of other products, Fidelity's FBTC saw an inflow of $9.7 million, ARK 21Shares' ARKB had an inflow of $33 million, and Grayscale Bitcoin Mini Trust had an inflow of $42.3 million—only Grayscale's flagship product GBTC continued to see an outflow of $44.5 million.
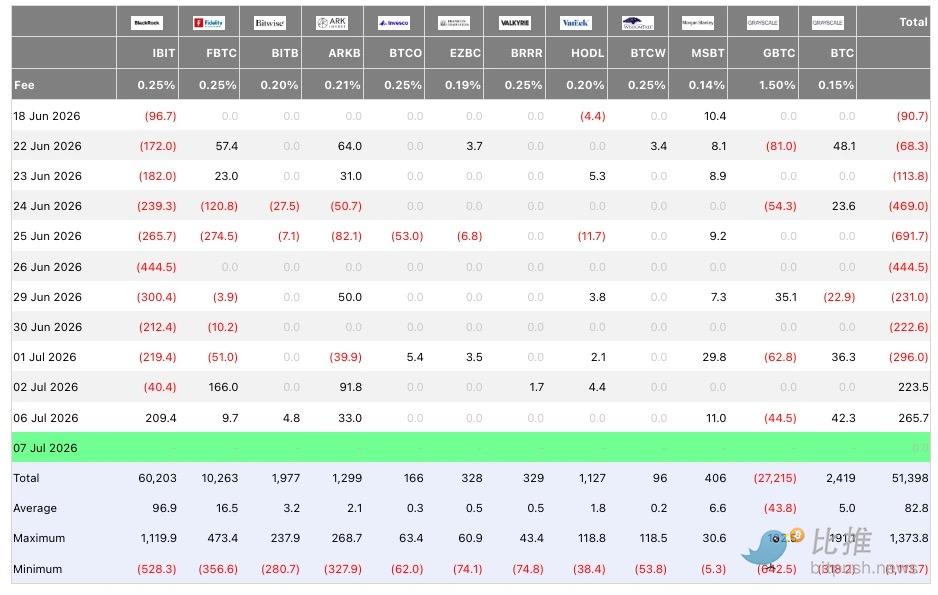
This marks the second consecutive trading day of positive inflow, following eight weeks of consecutive net outflows for the U.S. spot Bitcoin ETF. In June, the ETF experienced record net outflows of approximately $4.5 billion.
However, one data point is worth noting: as of the week ending July 4, despite the inflows of the past two days, the weekly net outflow still reached $526.6 million, marking the eighth consecutive week of net outflows. The current phase remains a "repair observation window," rather than a "confirmed turning point."
MicroStrategy Sells Bitcoin: Timing Not Friendly to Bulls
MicroStrategy sold 3,588 BTC last week, cashing out approximately $216 million to pay preferred dividends.
Notable analyst Ali pointed out on X that the timing of this sale "is not very friendly to bulls"—the TD Sequential indicator happened to flash a sell signal at the same time. The combination of technical signals and institutional sell-offs has indeed put pressure on market sentiment. Martinez described this combination as "not the situation bulls want to see."
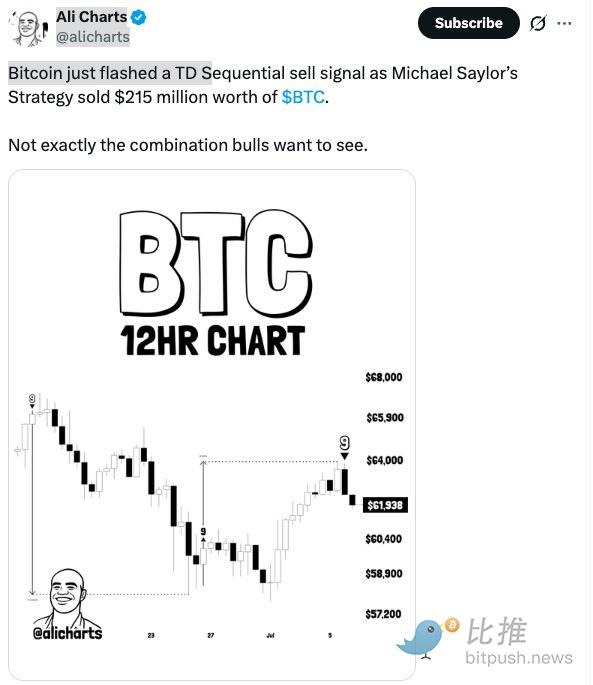
But setting aside short-term noise, there are several key data points worth noting:
First, the proportion is very small. As of July 5, MicroStrategy still holds 843,775 BTC, plus $2.55 billion in cash. The 3,588 BTC sold only account for about 0.4% of the total holdings.
Second, the purpose is clear. Saylor confirmed on X that this sale was specifically to pay dividends on digital credit securities, which is part of capital structure management, not a strategic shift.
Third, the net buyer status remains unchanged. MicroStrategy purchased 85,296 BTC in the second quarter, selling only 3,620 BTC during the same period, with a buy/sell ratio of 22.5:1.
Technical Analysis: Volatility Dominates
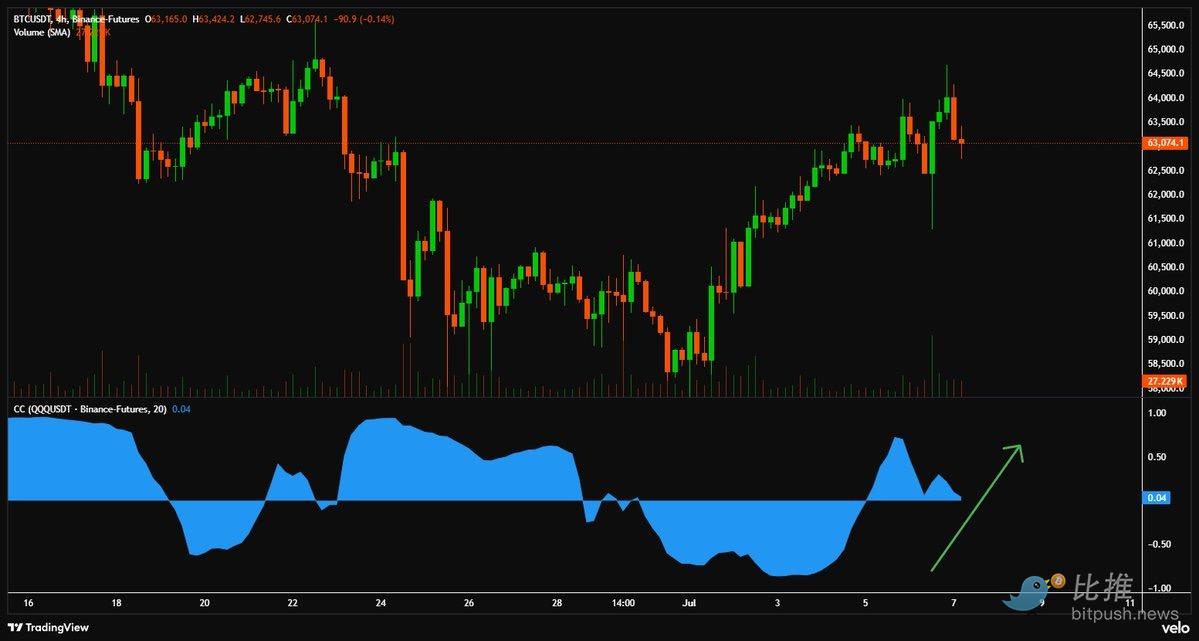
Well-known trader Daan Crypto Trades shared a chart on X that shows the correlation between Bitcoin and the NASDAQ, which flipped from -0.87 to +0.72 in just a few days.
What does this mean? -0.87 indicates almost inverse volatility: when U.S. stocks rise, Bitcoin falls; when U.S. stocks fall, Bitcoin rises, resembling a hedging tool. +0.72 means both move in the same direction: when U.S. stocks rise, Bitcoin also rises; when U.S. stocks fall, Bitcoin falls too, like a tech stock.
However, curiously, this correlation has now returned to a neutral state. So you can observe a split market: although the NASDAQ fell more than 1%, Bitcoin also retraced but the decline was much smaller than that of tech stocks, remaining solidly above $63,000. It neither completely followed the drop nor exhibited a fully independent trend—this is the neutral state. How direction is chosen in the next few days is very critical.
Daan also pointed out a key point: since 2025, Bitcoin has not had a fixed correlation for most of the time, but 2026 has proven one thing—Bitcoin can indeed chart its own course for several months without following U.S. stocks.
Returning to technical analysis. The most important defense line is in the range of $62,700 to $62,900, where the 200-week moving average and other key technical levels converge. If it holds, the next target for bulls is the macro resistance level of $69,000; if it fails to hold, it may accelerate its decline towards $58,500.
Additionally, Bitcoin's 30-day implied volatility just jumped to 40%, ending a six-day decline. This indicates that the market is uncertain about the short-term direction, with everyone waiting for a clear signal.
So how do we view the next steps? The core variable remains the ETF.
If ETF funds can continue to flow back, Bitcoin will have the confidence to challenge $69,000; if the inflows of the past couple of days are merely fleeting, then this rebound is likely just a dead cat bounce.
免责声明:本文章仅代表作者个人观点,不代表本平台的立场和观点。本文章仅供信息分享,不构成对任何人的任何投资建议。用户与作者之间的任何争议,与本平台无关。如网页中刊载的文章或图片涉及侵权,请提供相关的权利证明和身份证明发送邮件到support@aicoin.com,本平台相关工作人员将会进行核查。


