Written by: Trend Research
Bank of America’s latest Flow Show has a title that pricks at every word: Post-bubble.
Analyst Hartnett did not use questions and did not add words like "possibly" or "maybe" for cushioning. In his view, the current U.S. stock market is not in a "suspected bubble," but has already entered the historical script after a bubble burst. He flipped through history from 1929 to 2015, excavating the performance patterns of assets after each major bubble peaked, and then drew a roadmap for today’s market.
The core trading strategy of this map is compressed into one sentence: Long the "humiliated," short the "arrogant."
A set of disturbing data
First, let’s look at the current "abnormality."
The S&P 500 index stands at a historical high. This fact itself is not a problem; the problem lies in the number of stocks participating in this party: among all the constituents of the S&P 500, only 21 (4%) are hitting new highs at the same time. 222 stocks have fallen more than 20% from their respective peaks, and 109 stocks have fallen more than 40%.
This 4% figure, Hartnett especially annotated with a historical reference: in March 2000, at the peak of the Internet bubble, only 20 stocks in the S&P 500 were reaching new highs. In other words, today’s market concentration has returned to the level of the peak of the Internet bubble.
Emerging markets are even more extreme. Out of 1224 EM stocks, only 21 (less than 2%) are at historical highs.
While the index is celebrating, the vast majority of stocks are silent.
The historical script after the bubble
Hartnett conducted a systematic review of every major bubble peak since 1929, and there are two main conclusions.
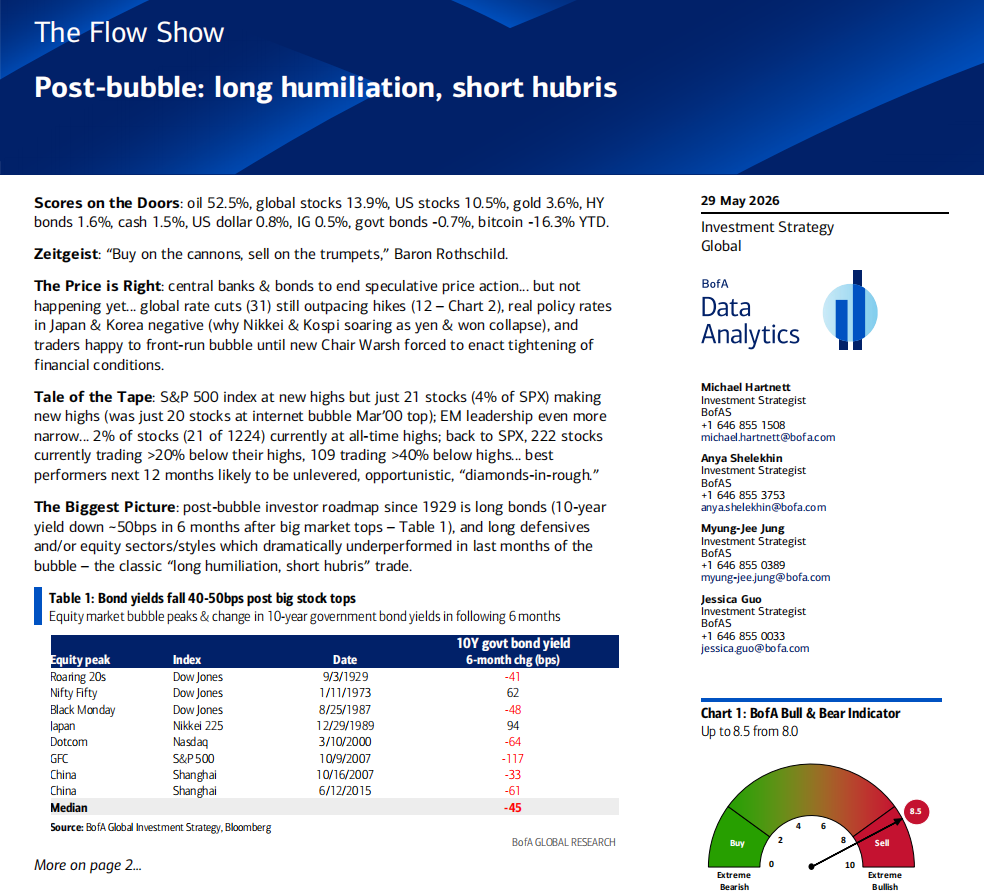
First: After a bubble bursts, bonds almost always rise. He compiled data on changes in the 10-year government bond yield within 6 months after eight major stock market peaks, showing a median decline of 45 basis points. The logic is not hard to understand: the bursting of the bubble leads to a decline in risk appetite, funds flow into safe-haven assets, bond prices rise, and yields fall. In six of the eight instances, yields decreased, with only 1973 and 1989 as exceptions (affected respectively by stagflation and Japan’s unique situation).
Second: The sectors that suffered the most during the bubble perform the best after the bubble bursts. Every round of bubbles has its "favorites" as well as its "discarded." After the bubble ends, the offensive and defensive roles reverse.
Looking specifically at a few rounds: In the roaring twenties of 1929, the main characters of the bubble were utilities, telecommunications, industries, and banks; after the bubble burst, these sectors underperformed across the board, whereas the previously neglected energy stocks became winners. During the 2000 Internet bubble, the Nasdaq doubled in the 6 months before the peak, while the equal-weighted S&P 500 actually declined in the last 12 months of the bubble; after the bubble burst, the Nasdaq fell 60% within a year, while the humiliated defensive sectors rebounded strongly (utilities up 25%, consumer staples up 24%), and the equal-weight S&P actually rose in 2000. In the 2006 to 2007 China bull market, materials and industries gained three times in 12 months, then dropped 65% to 85% after the bubble burst, while previously underperforming consumer staples, utilities, and technology sectors went against the trend.
Who corresponds to the "humiliated" today? Hartnett gave a clear indication: Since the Nasdaq surged 80% from its low in April 2026, the worst-performing sectors have been consumer staples, financials, and healthcare. According to the historical script, they are the sectors most likely to outperform after the bubble ends.
The next phase of AI investment: from "builders" to "users"
This is the most insightful part of the entire report for cryptocurrency and technology investors.
Hartnett noted that the penetration of tech companies in the credit market has reached astonishing levels: the tech industry accounts for 10% of the U.S. investment-grade bond market and 8% of the high-yield bond market. This means that tech companies are not only highly concentrated in the stock market but also massively leveraging in the bond market.
His judgment is: the leadership in AI investment is shifting. It is moving from the "spenders" (capital expenditures by large tech companies) and "builders" (semiconductors) to the "users of AI" (application layer). The best way to participate is through small-cap growth stocks, rather than continuing to bet on large tech.
The historical anchor point for this analogy is the post-bubble period of the "Nifty Fifty" in the 1970s: from December 1974 to May 1981, small-cap growth stocks outperformed the S&P 500 by over 1000%. Hartnett hinted that a similar structural rotation may be brewing.
Capital flows: Smart money is quietly turning
This week’s capital flow data hides several signals worth noting.
Global stocks experienced a net outflow of $7 billion, the first in 9 weeks. The Japanese stock market saw an outflow of $8.2 billion, the largest single-week outflow since May 2025. Chinese funds had an outflow of $14 billion, with a cumulative outflow of $218 billion since January 2026. Europe has seen net outflows for 7 consecutive weeks.
Meanwhile, bonds have had net inflows for 57 consecutive weeks (with $23.6 billion this week). Investment-grade bonds have seen inflows for 8 weeks in a row, and emerging market bonds have seen inflows for 7 weeks. Notably, Bank of America private clients are withdrawing from cash at record levels while simultaneously buying long-term Treasury bond ETFs (TLT, JAAA, VGIT) at record levels.
Translating these data: institutional funds are migrating from stocks to bonds, especially extending durations. Private clients' cash positions have dropped to a historical low (9.6%), while stock positions have risen to a historical high (66%). Everyone is fully invested, and everyone is optimistic.
This is precisely why Hartnett is sounding the alarm.
Bull-bear indicator triggers "sell" signal
Bank of America’s Bull & Bear indicator has risen from 8.0 to 8.5, further entrenched in the contrarian "sell" zone. This indicator triggers a sell signal when it exceeds 8.0.
Among the six components of this indicator, fund manager positioning is at the 98th percentile (extremely bullish), bond fund flows are at the 85th percentile (extremely bullish), hedge fund positioning is at the 72nd percentile (bullish), and the technical aspect of the credit market is at the 77th percentile (bullish). None of the six components show pessimism.
Since 2002, this indicator has triggered a total of 17 sell signals, after which global stocks averaged a downturn of 2% to 3% within 2 to 3 months, with a hit rate of about 60% and the maximum drawdown reaching 15% to 20%.
June: Concentrated event risk explosion
Hartnett used the term: chockablock.
On June 10, U.S. CPI (expected around 4%), on June 11, ECB rate hike, June 15 G7 summit, June 16 Bank of Japan rate hike, June 17 Warsh’s first FOMC press conference, June 18 UK by-election, along with large-scale stock issuance windows.
In a context where everyone is fully invested and all indicators are extremely optimistic, any "surprise" from an event can become the spark for profit-taking. Hartnett’s suggestion is direct: take profits and operate in reverse during yield declines and stock market increases.
The political context he provided is also worth noting: Trump’s economic approval rating has fallen to 35%, and his inflation approval rating has dropped to 28%, both hitting new lows. The political cost of the Iranian conflict is backfiring on the White House.
Winners and losers of 2026
As of May 27, the year-to-date performance ranking:
The biggest winners are oil (+54.4%) and the South Korean stock market (+111.6%). The worst performers are Bitcoin (-16.3%) and the Indian stock market (-10.4%). The Chinese stock market has fallen 7.9%, with a cumulative outflow of $218 billion from Chinese funds. Gold has risen only 2.5%, showing a lackluster performance after the war premium faded.
An counterintuitive fact: Among all major asset classes, Bitcoin is the worst-performing asset of 2026, and the gap is significant. The second worst is the Indian stock market, which has only lost two-thirds of Bitcoin’s decline.
For cryptocurrency investors, this report has an uncomfortable implication: Bitcoin has been at the bottom among all assets year-to-date, with continued net outflows (this week $1.2 billion). Within Bank of America’s framework, the high correlation between cryptocurrencies and risk assets means that if the "post-bubble" script really plays out, Bitcoin may not be spared.
Disclaimer: This article is a compilation and interpretation of third-party brokerage research reports by Trend Research. The ratings, target prices, earnings forecasts, and related judgments cited in the text reflect the views of the brokerage analysts and represent the positions of their respective institutions, not the views of Trend Research, nor does it constitute any investment advice.
The market carries risks, decisions should be made independently. This article should not be used as a basis for buying or selling any securities.
免责声明:本文章仅代表作者个人观点,不代表本平台的立场和观点。本文章仅供信息分享,不构成对任何人的任何投资建议。用户与作者之间的任何争议,与本平台无关。如网页中刊载的文章或图片涉及侵权,请提供相关的权利证明和身份证明发送邮件到support@aicoin.com,本平台相关工作人员将会进行核查。


