Author: Elad Gil (Data Analysis: Shreyan Jain)
Translation: Deep Tide TechFlow
Deep Tide Guide: The Elad Gil team has tracked the global unicorn market valuation distribution for six consecutive years. Data from 2025 points to a clear conclusion: the San Francisco Bay Area is becoming a super cluster for generative AI, concentrating 91% of the global AI unicorn valuation within an hour's drive. Meanwhile, the speed of new unicorn births is slowing down, but the average valuation of existing unicorns has reached a six-year high. This report reveals with hard data that the power center of the global entrepreneurial ecosystem is accelerating towards the United States and the Bay Area.
All data is as of December 31 of the corresponding year, and "2025" refers to the market valuation at the point of December 31, 2025 / January 1, 2026.
In the past two years, we have experienced a market correction in the post-zero interest rate era, the explosive rise of frontier AI laboratories like OpenAI and Anthropic, and ongoing debates surrounding the "AI bubble." Data shows that the San Francisco Bay Area has evolved into an AI super cluster, with 91% of global AI private market valuations concentrated within an hour's drive radius.
For analyses from previous years, see: 2019, 2020, 2021, 2023.
Core Findings
- Generative AI has turned the Bay Area into a super cluster. The Bay Area currently accounts for about 39% of the global unicorn valuation, over four times that of the second city, and this number was only 29% a year ago. When focusing specifically on generative AI unicorns, the Bay Area's share is as high as 91%.
- The absolute dominance of American unicorns. The United States added nearly $1.2 trillion in unicorn valuation over the past year, accounting for about 65% globally. Europe has surpassed China in market valuation share, but it's only around 10%.
- A new generation of unicorns is more concentrated in the U.S. and the Bay Area. Among unicorns born in 2023 and afterward, the U.S. accounts for 83% of the total market valuation, while that of those born in 2022 and earlier is only 60%. The Bay Area's share is even more pronounced: 63% for the new generation, 33% for the old generation.
- The birth rate of new unicorns is slowing down. Between 2022 and 2025, only about 300 new unicorns were added, whereas there were over 900 added in the previous three years.
- But existing unicorns are worth more than ever. The total number of unicorns grew only 6% year-on-year, but total market valuation increased by 33%. The average valuation of each unicorn reached the highest level in six years.
- Valuation growth is primarily driven by AI companies. In 2025, the average valuation of generative AI unicorns increased by about $2.2 billion year-on-year, while non-AI unicorns saw only about $400 million. The share of generative AI in global unicorn valuations skyrocketed from 2% in 2024 to 22%. The concentration in the Bay Area will only continue to expand.
- Unicorn centers cluster around specific industries. Among the top ten unicorns in the Bay Area, six are AI companies; New York's top ten have seven fintech/crypto companies; Los Angeles's top five include three defense/aerospace companies (SpaceX, Anduril, Relativity, which account for 83% of Los Angeles's total valuation), with four consumer companies in the top ten.
Data Explanation
All original data comes from CB Insights and can be viewed here. A few notes:
There is a lag in the updates of private financing rounds in public datasets, and some unicorn valuations may not be the latest. For instance, the latest financing rounds for Anduril, Stripe, and SpaceX are not reflected in the data.
Unicorn valuations are at best a rough lagging indicator of the activity level in the entrepreneurial ecosystem, and there is inevitably some error in the mapping of companies to valuations, cities, and industries. However, we believe that the data is accurate in terms of the overall trend.
Unicorn Concentration
The geographical concentration of global unicorn valuations has reached a historic high. The United States accounts for 65% of all unicorn valuations, up from 58% a year ago and 44% in 2020. The U.S. share is about four times that of the second-ranked China.
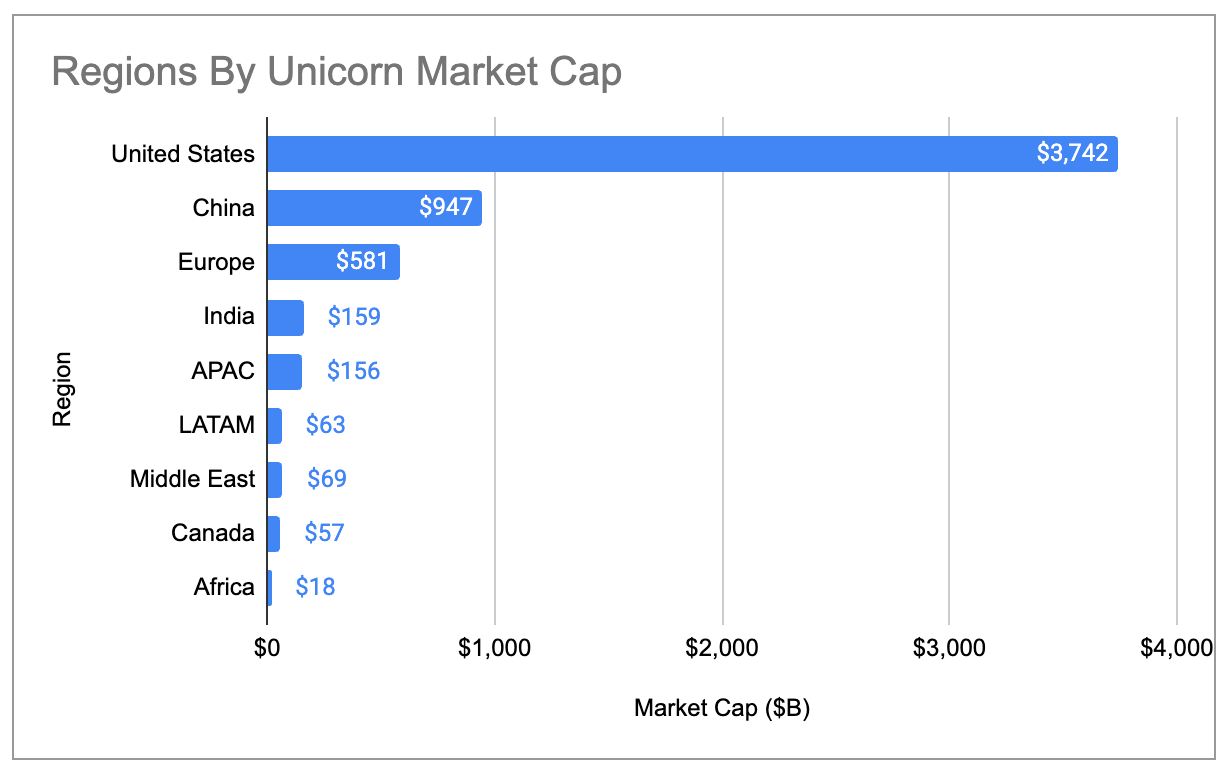
Figure Caption: Global Share of Unicorn Valuations by Country (including three major outliers)
The unicorn valuation of the Bay Area is also more than four times that of the second city, with their global share increasing from 29% in 2024 to 39%:
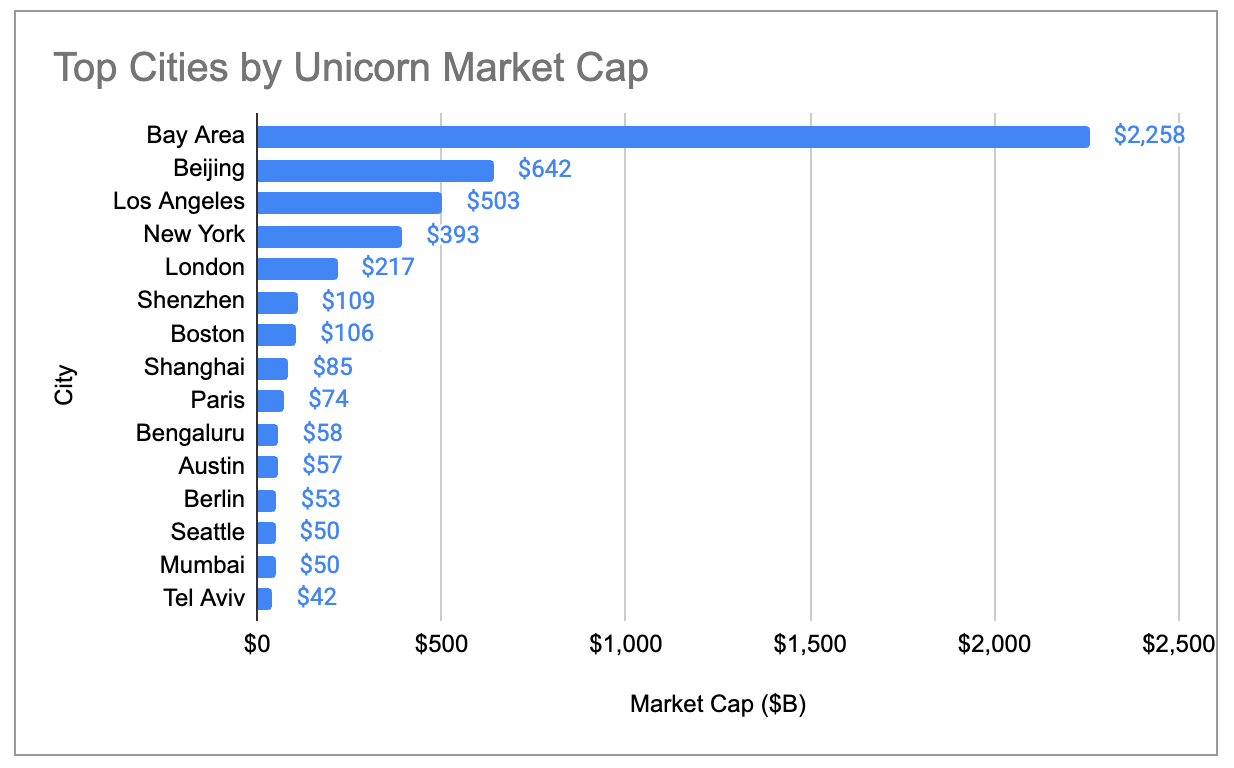
Figure Caption: Global Share of Unicorn Valuations by City (including three major outliers)
Even when excluding the three largest outliers—OpenAI ($500 billion), SpaceX ($400 billion), and ByteDance ($300 billion)—the large ecosystem has been continually concentrating since 2019. The U.S. share has steadily increased while China has gradually decreased. Europe exceeded China in total unicorn valuation in 2024, with New York and London surpassing Beijing.
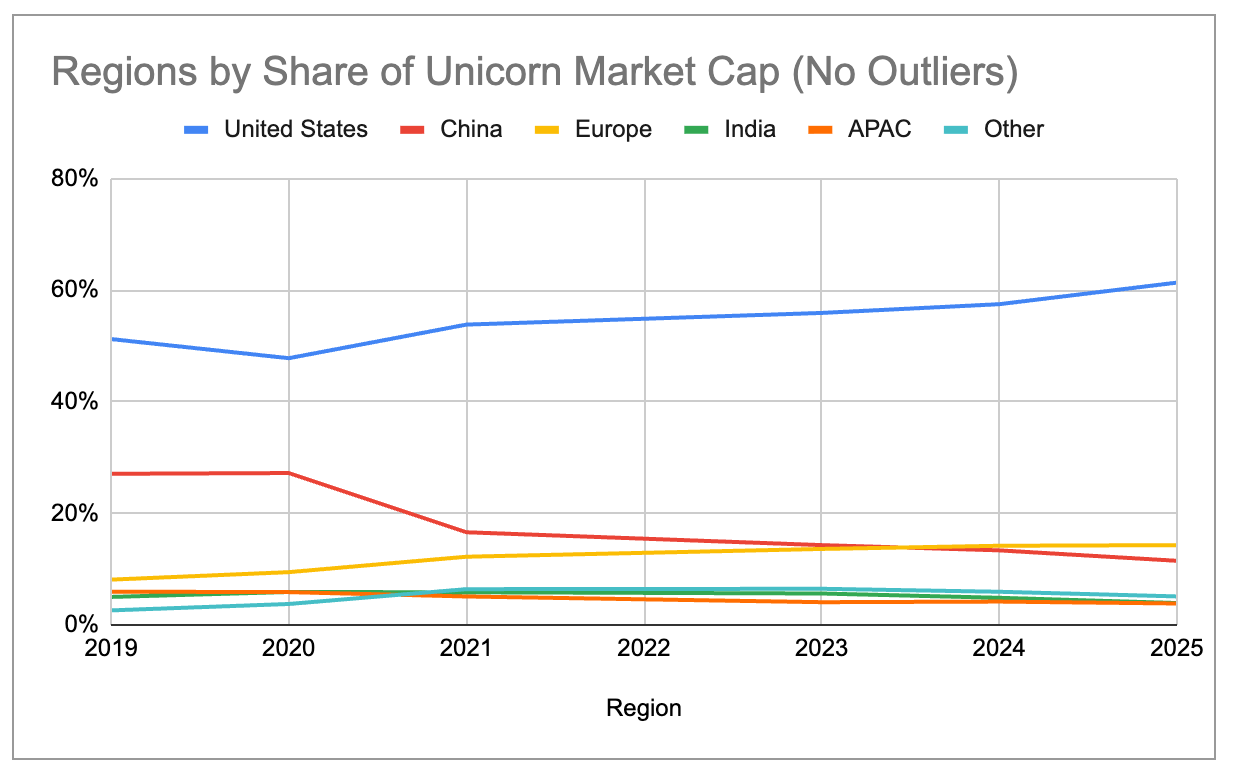
Figure Caption: Global Share of Unicorn Valuations by Country (excluding three major outliers)
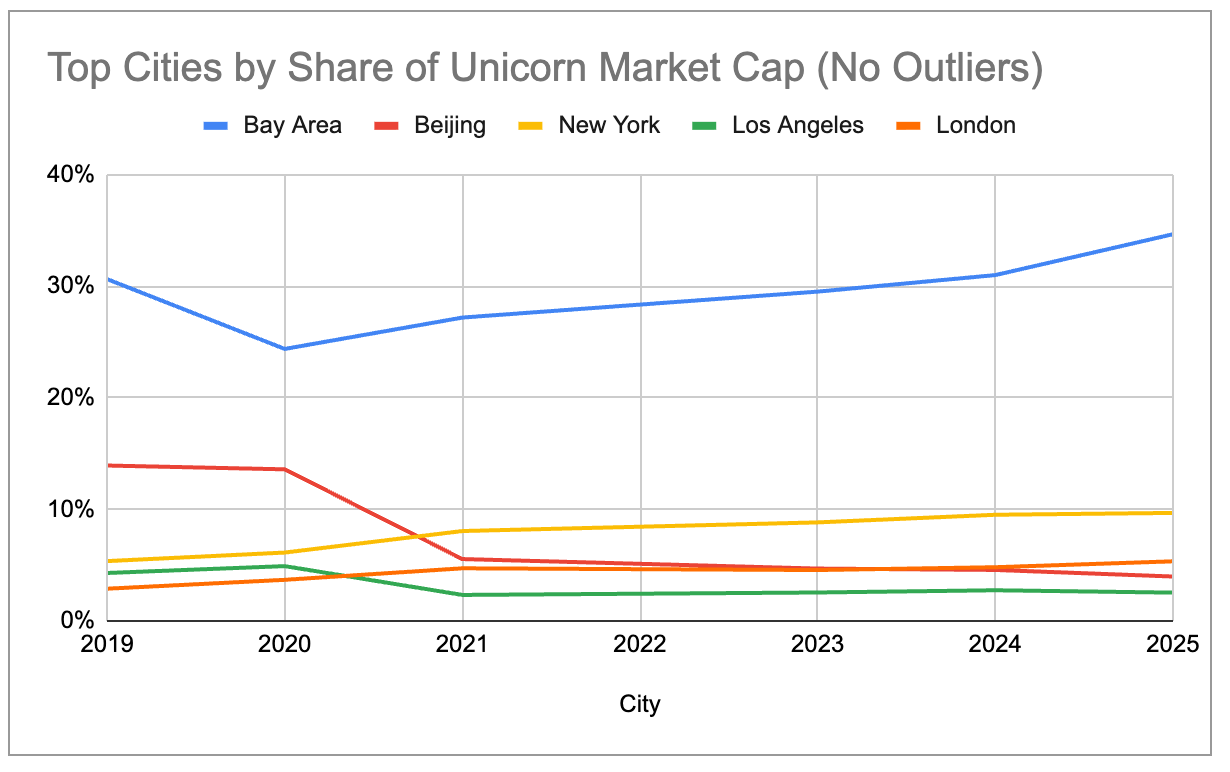
Figure Caption: Global Share of Unicorn Valuations by City (excluding three major outliers)
Super Concentration of Generative AI
If we look only at the 97 unicorns whose core revenue comes from generative AI products/services, the clustering effect in the Bay Area is even more extreme. The Bay Area occupies 91% of the global AI unicorn valuation, with no other city exceeding 2%.
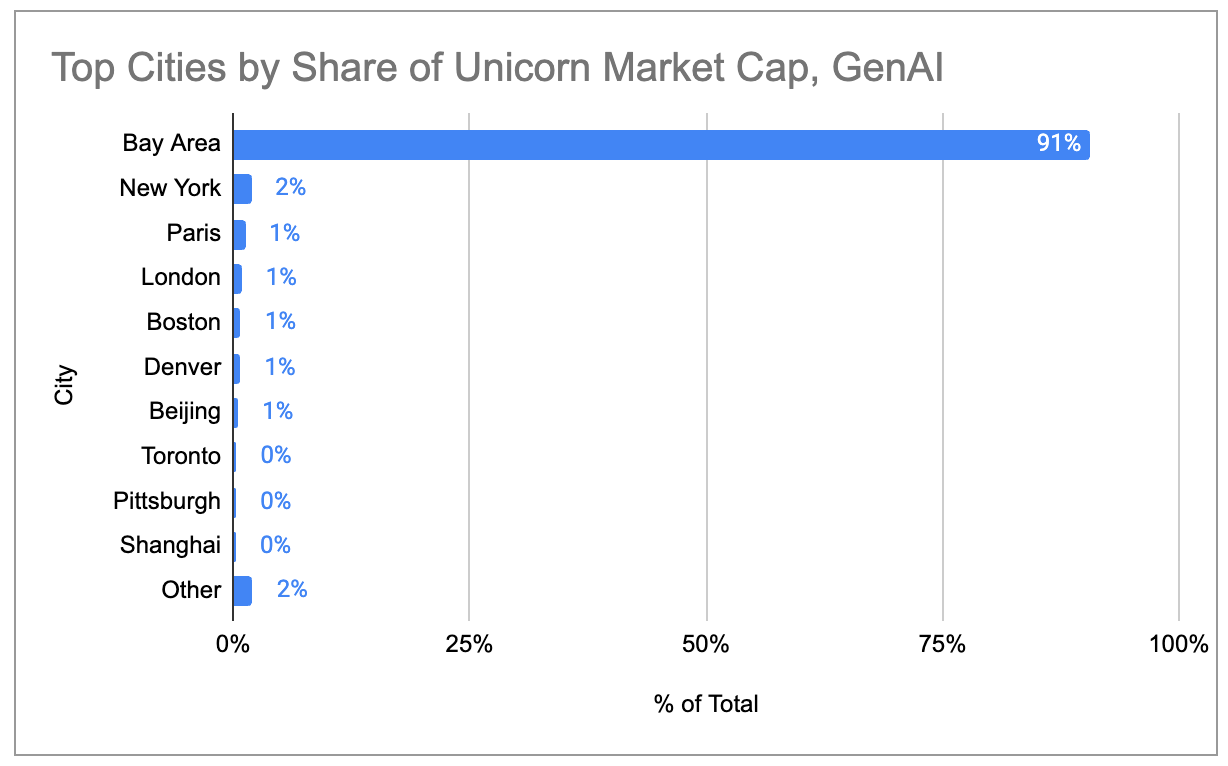
Figure Caption: City Distribution of Generative AI Unicorn Valuations
The total valuation of generative AI unicorns has grown exponentially, with almost all growth coming from the U.S., especially the Bay Area.
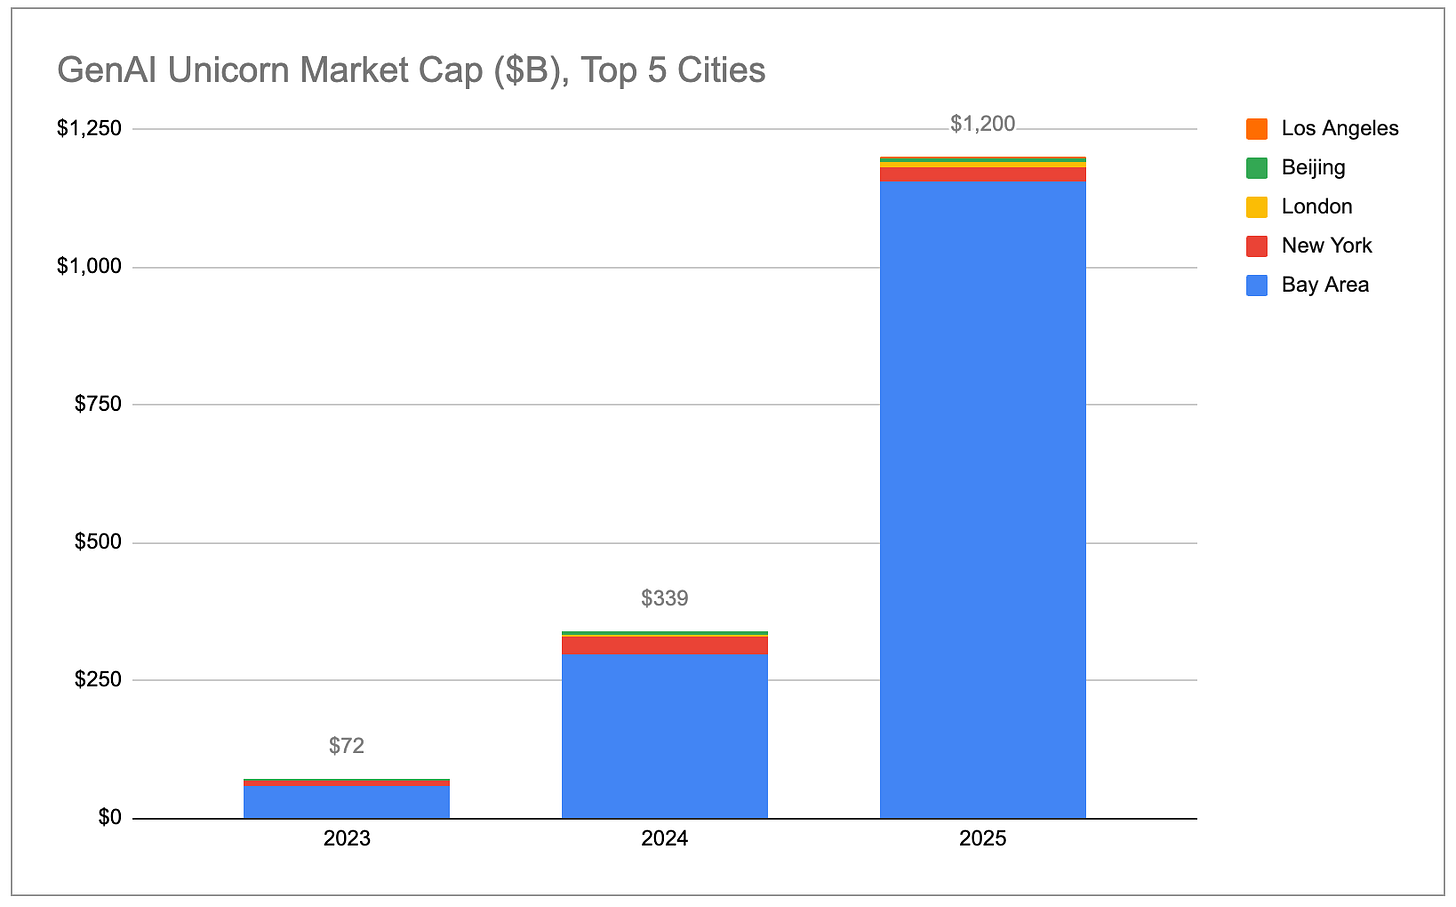
Figure Caption: Total Valuation of Generative AI Unicorns (by Country)
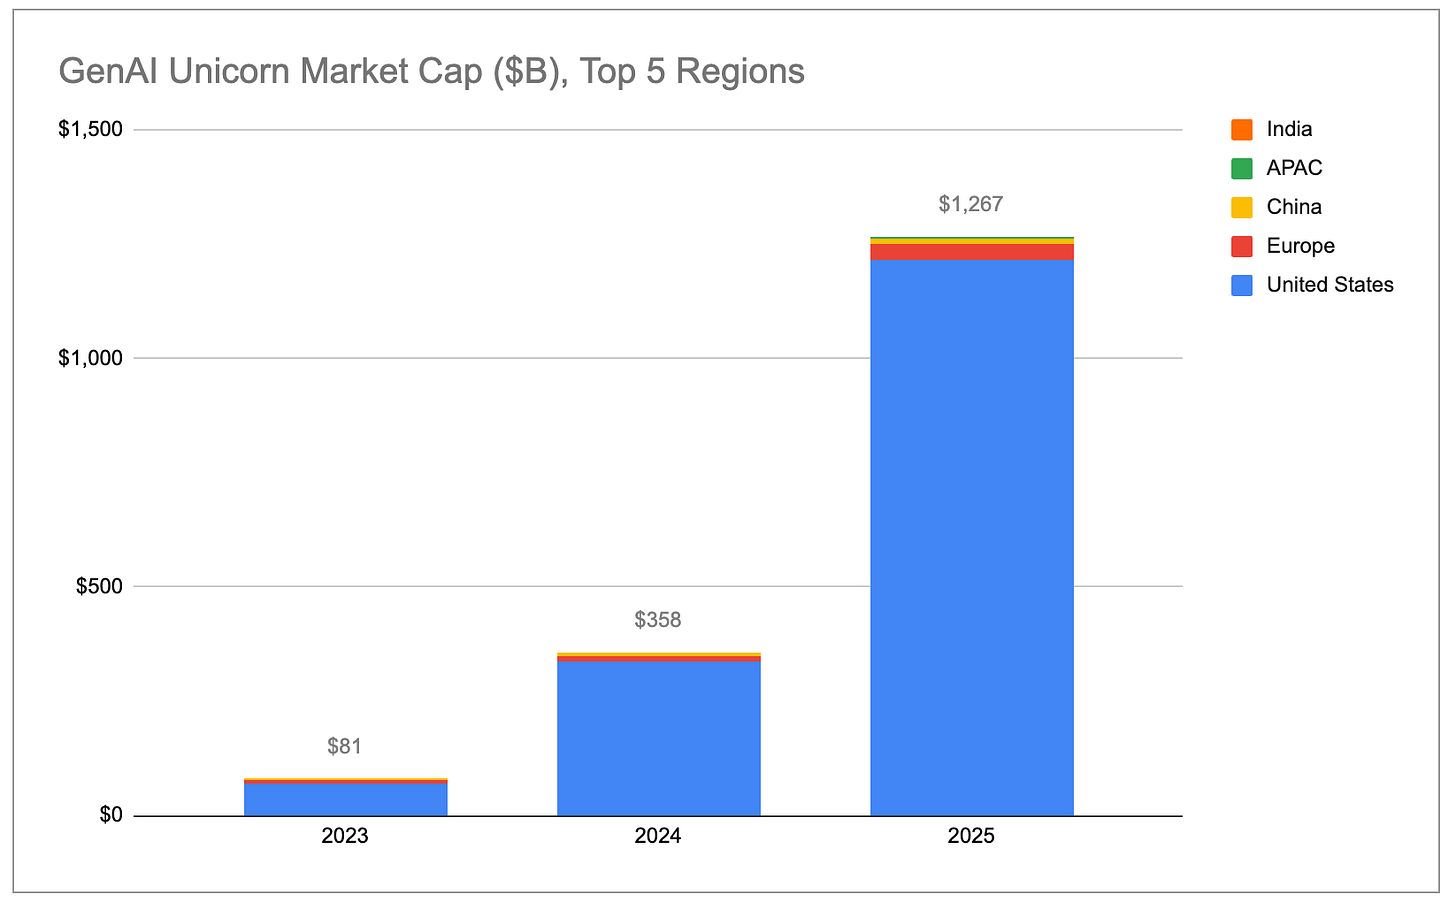
Figure Caption: Total Valuation of Generative AI Unicorns (by City)
The valuation growth rate of AI unicorns far exceeds that of non-AI unicorns. Throughout 2025, 48 AI companies saw their total valuation increase by $778 billion. This amount exceeds the total valuation increase of more than 1,100 non-AI unicorns. Even when excluding OpenAI (which increased by approximately $343 billion) and Anthropic (which increased by approximately $334 billion), the average year-on-year increase in valuation for generative AI unicorns remains around $2.2 billion, five times that of non-AI unicorns (approximately $440 million).
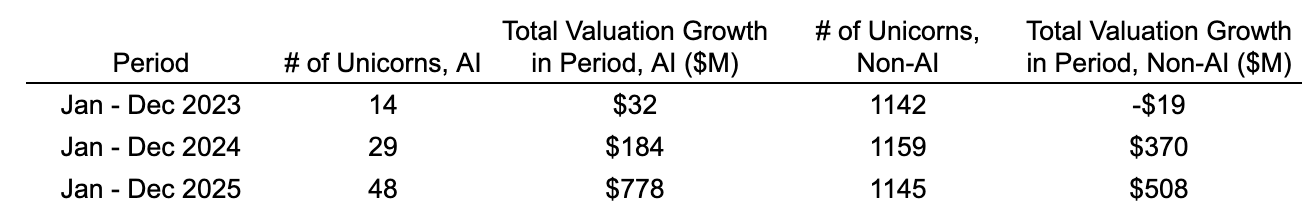
Figure Caption: Comparison of Valuation Growth of AI Unicorns vs Non-AI Unicorns
In relative terms, generative AI companies grew from 2% of global unicorn valuations in 2023 to 22%. If this trend continues, the Bay Area's share of global unicorn valuations will continue to expand due to its factual monopoly on top AI companies and talent.
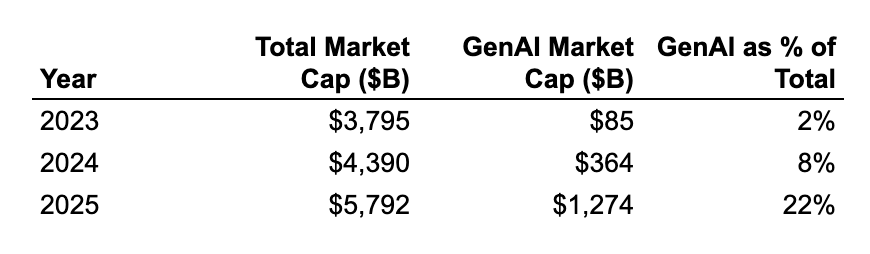
Figure Caption: Change in the Share of Generative AI in Total Unicorn Valuation
(Note: We classify only companies whose primary revenue comes directly from generative AI as "generative AI." A complete list of companies can be found here. We included chip/hardware companies like Cerebras and TensTorrent, as well as infrastructure companies like CoreWeave and Crusoe, but excluded data infrastructure companies like Databricks that more broadly support AI/ML workloads, and companies like Anduril that use AI/ML for autonomous systems in robotics/defense.)
New Unicorns
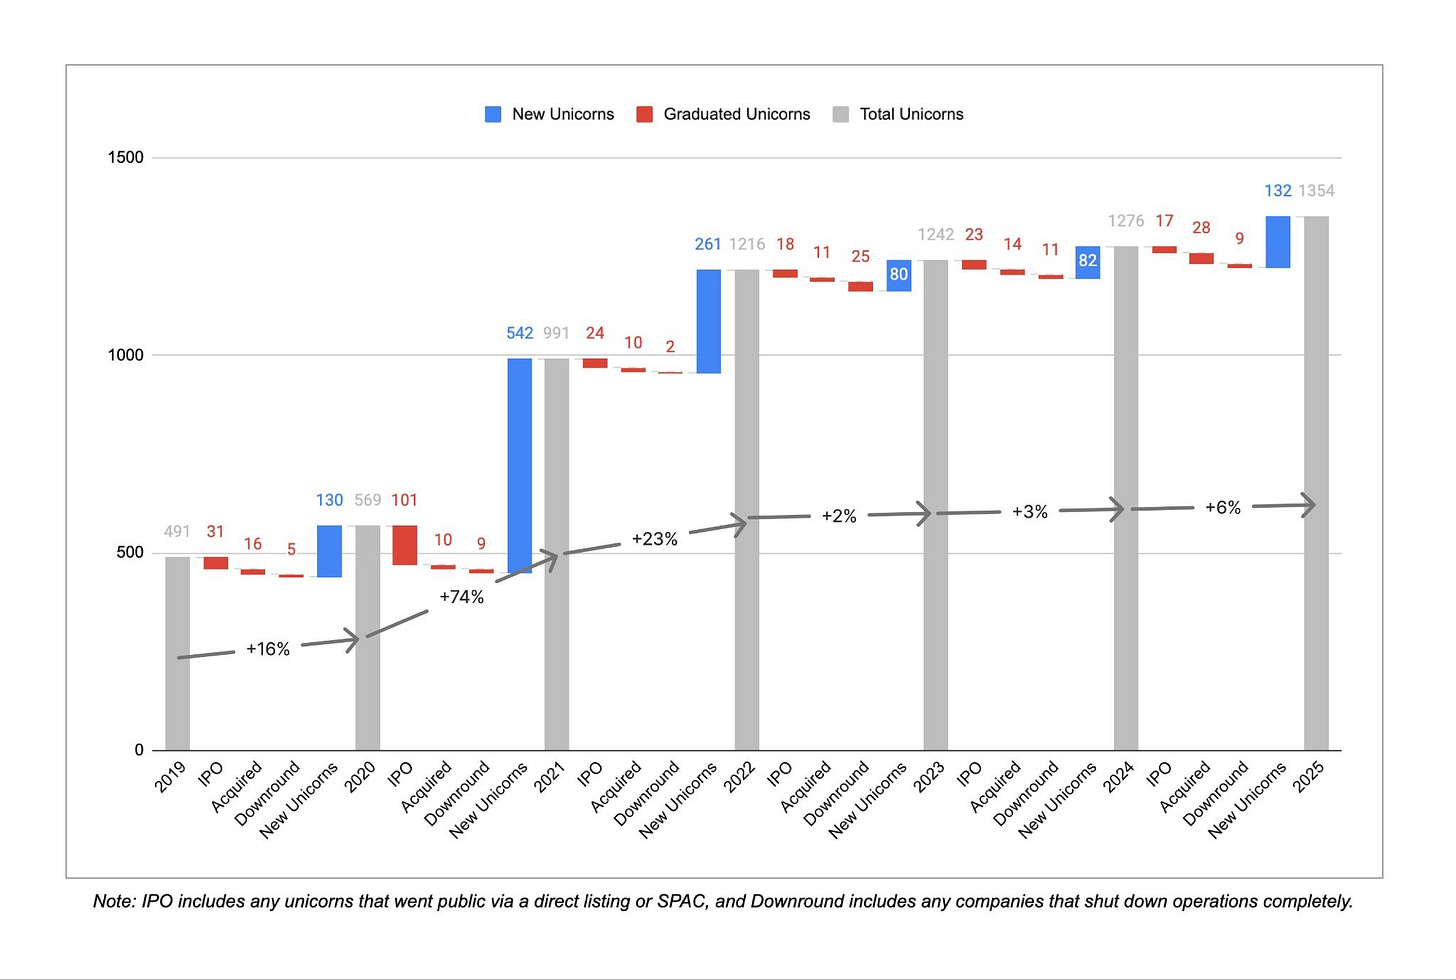
Figure Caption: Annual Number of New Unicorns
After three consecutive years of high growth, the birth rate of new unicorns has noticeably slowed down over the past three years. From December 2019 to December 2022, an average of over 300 companies entered the unicorn ranks each year. From December 2022 to December 2025, this number dropped to about 100 per year, even though there was a slight rebound in 2025 compared to the previous two years. Meanwhile, over the past three years, 45 companies have lost their unicorn status due to valuation downgrades or shutdowns, while only 16 did so in the previous three years, indicating that the correction of the inflated valuations from the zero interest rate era of 2021/2022 is still ongoing.
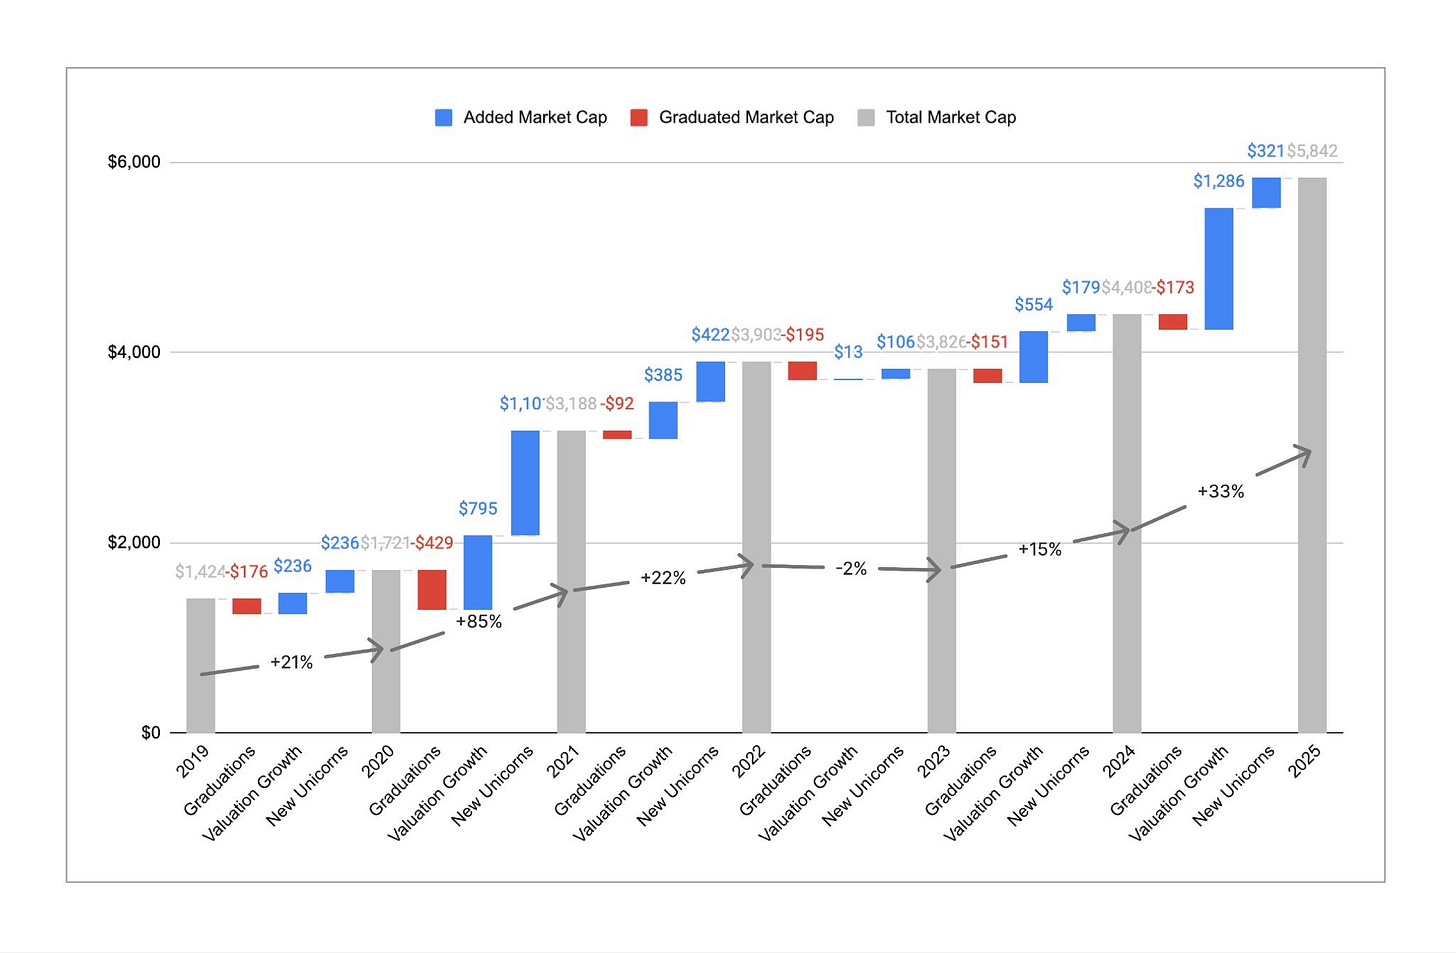
Figure Caption: Trend of Unicorn Count vs Total Valuation
Although the number of unicorns has remained stable, total valuations have seen significant growth. Over the past year, the total global unicorn valuation increased from about $4.4 trillion to about $5.8 trillion, a growth of 33%. This is a strong rebound, especially in contrast to the actual year-on-year reduction in total valuation for 2023. Historically, valuation growth has been driven more by new companies entering the unicorn ranks, but in 2025, about 80% of the valuation increase came from rising valuations of existing unicorns. As a result, the average valuation of each unicorn rose from approximately $3 billion to about $4.4 billion, the highest value recorded in the six years of this analysis. It has become harder to become a unicorn, but once crossing the $1 billion threshold, these companies are, on average, more valuable and grow faster.
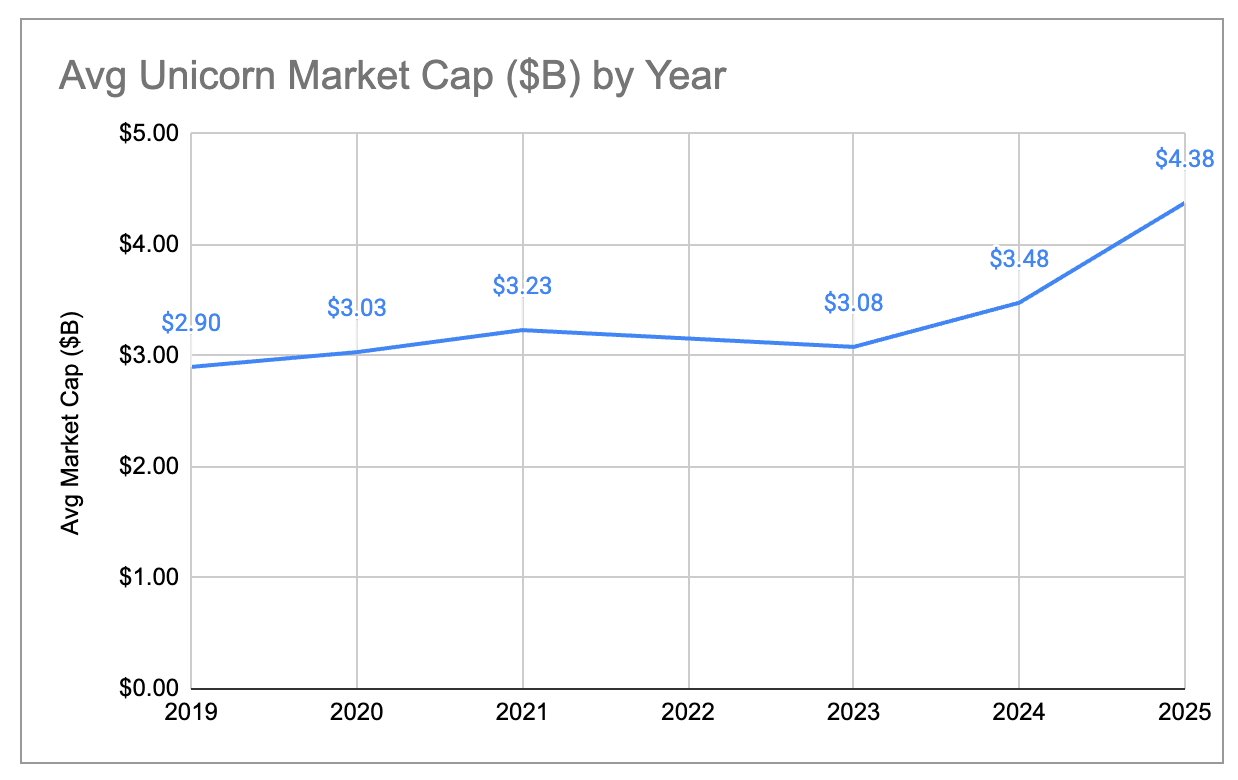
Figure Caption: Trend of Average Unicorn Valuation Changes
New Generation vs Old Generation Unicorns
One way to exclude the impact of hyperinflated valuations during the zero interest rate era is to look only at unicorns born after 2023. Here's a comparison of the valuation distribution of unicorns before and after 2023:
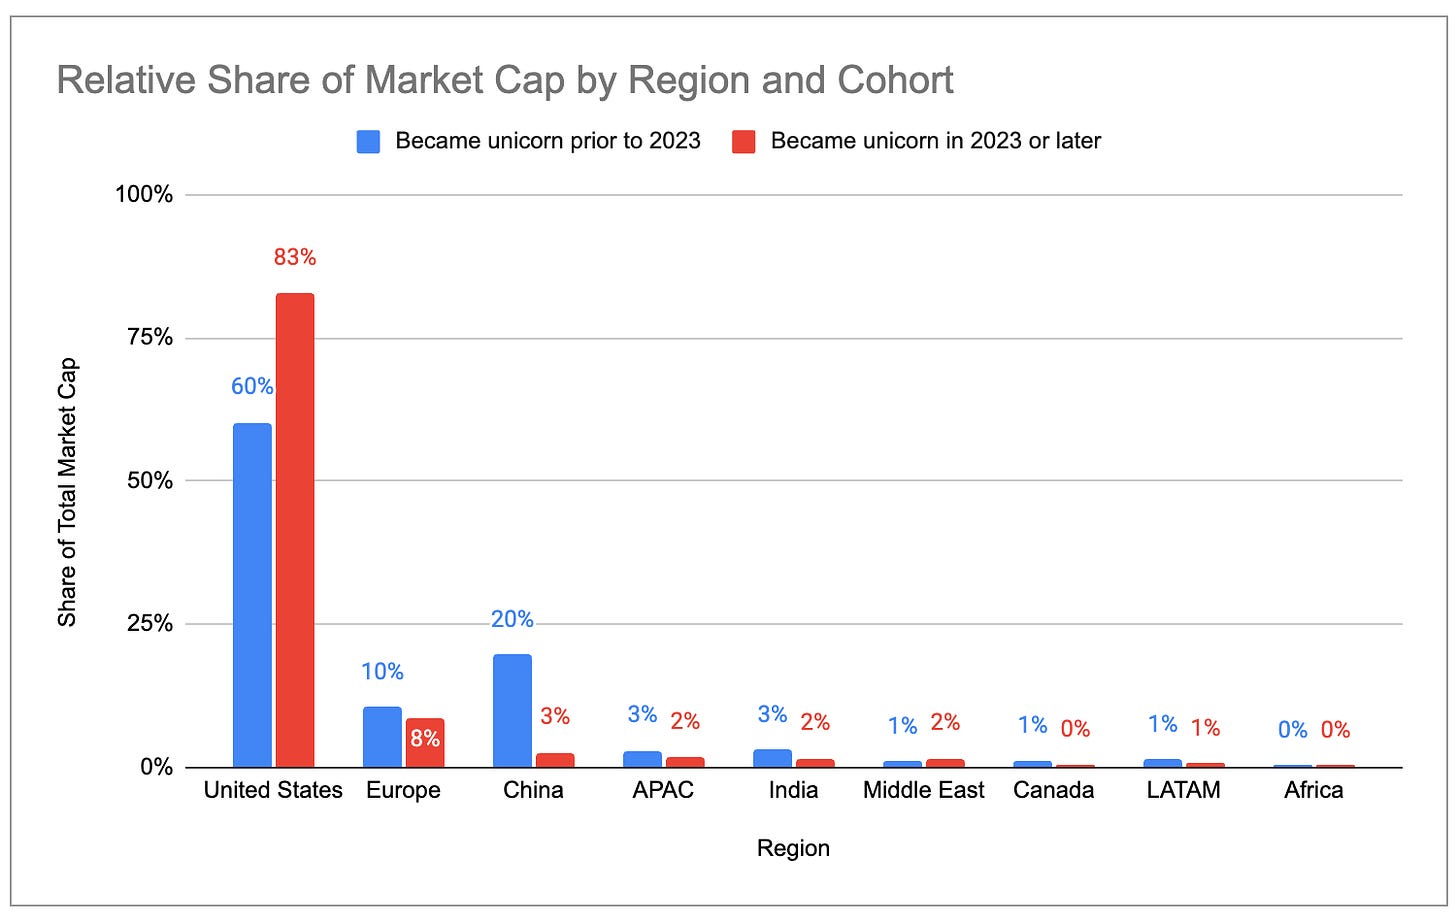
Figure Caption: Valuation Distribution of Unicorns Born Before 2023 (by Country/City)
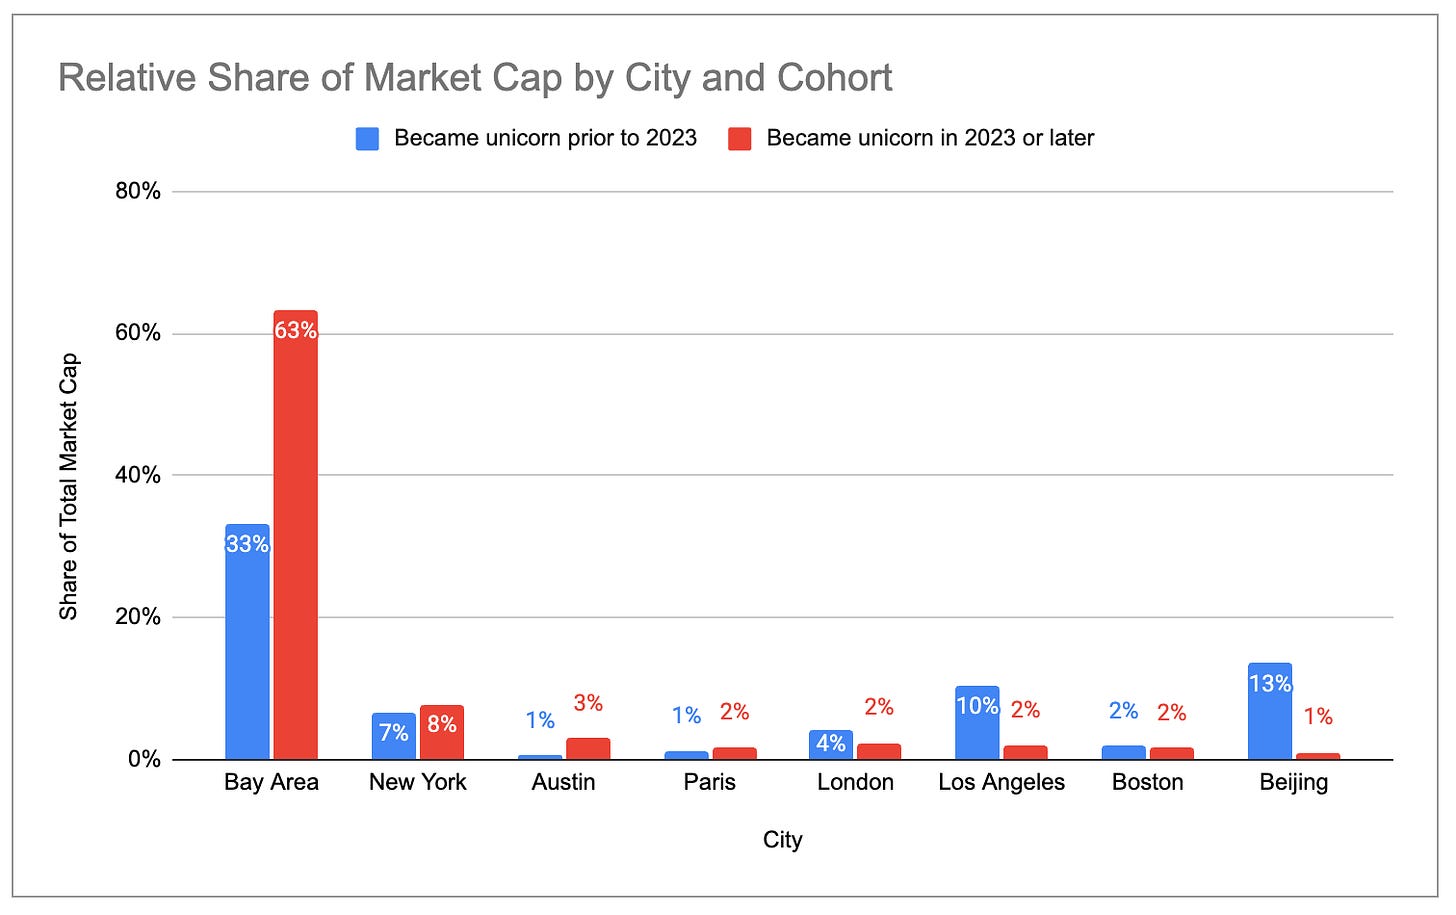
Figure Caption: Valuation Distribution of Unicorns Born in 2023 and After (by Country/City)
The new generation of unicorns is more concentrated in the U.S., with shares in Europe and China decreasing. Among the unicorns added since 2023, the Bay Area accounts for 63% of the market valuation, while the Bay Area only accounted for 33% of the older batch of unicorns.
"Zombie" Unicorns
Among the nearly 1,000 unicorns in December 2021, about 60% still hold their unicorn status but have not completed any new funding rounds. These "zombie" unicorns raised enough money during the zero interest rate era to survive until now but are unable to surpass their valuations from that time. They collectively account for about $1.4 trillion of the current global unicorn valuation, close to 25% of the global total.
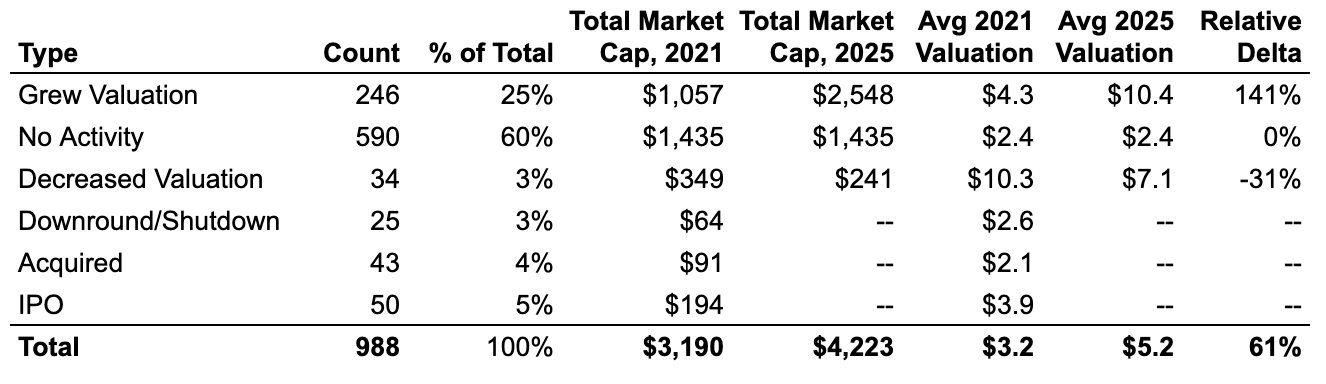
Figure Caption: "Zombie" vs "Active" Unicorns Among 2021 Unicorns
The proportion of "active" unicorns (those that have completed new funding rounds since 2021) in the U.S. and the Bay Area is much higher than that of "zombie" unicorns. In contrast, the concentration of "zombie" unicorns is higher in Europe, India, Latin America, and New York.
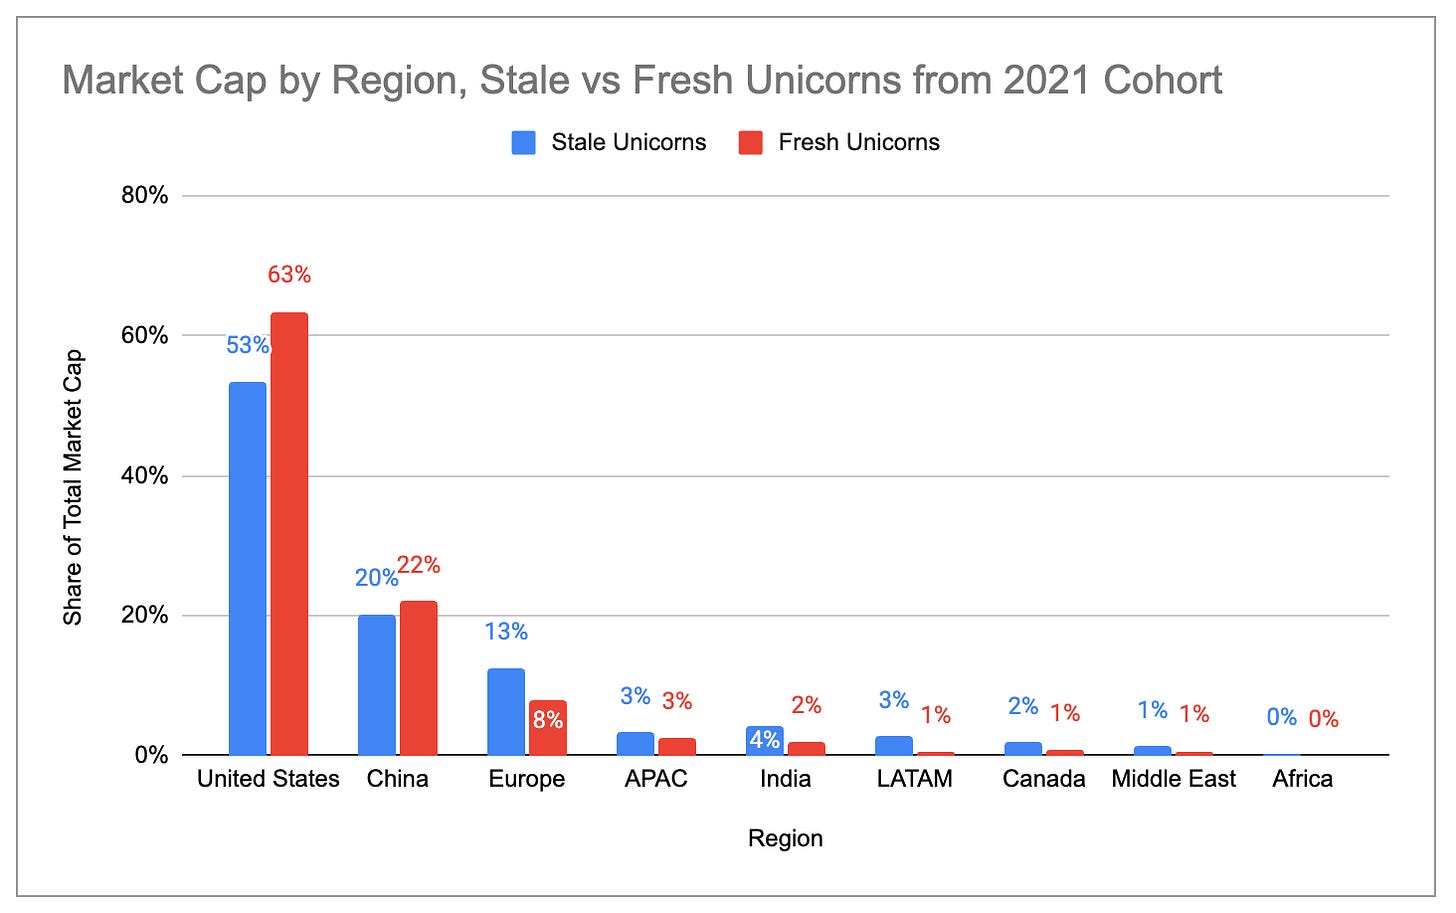
Figure Caption: Valuation Distribution of "Zombie" vs "Active" Unicorns by Country
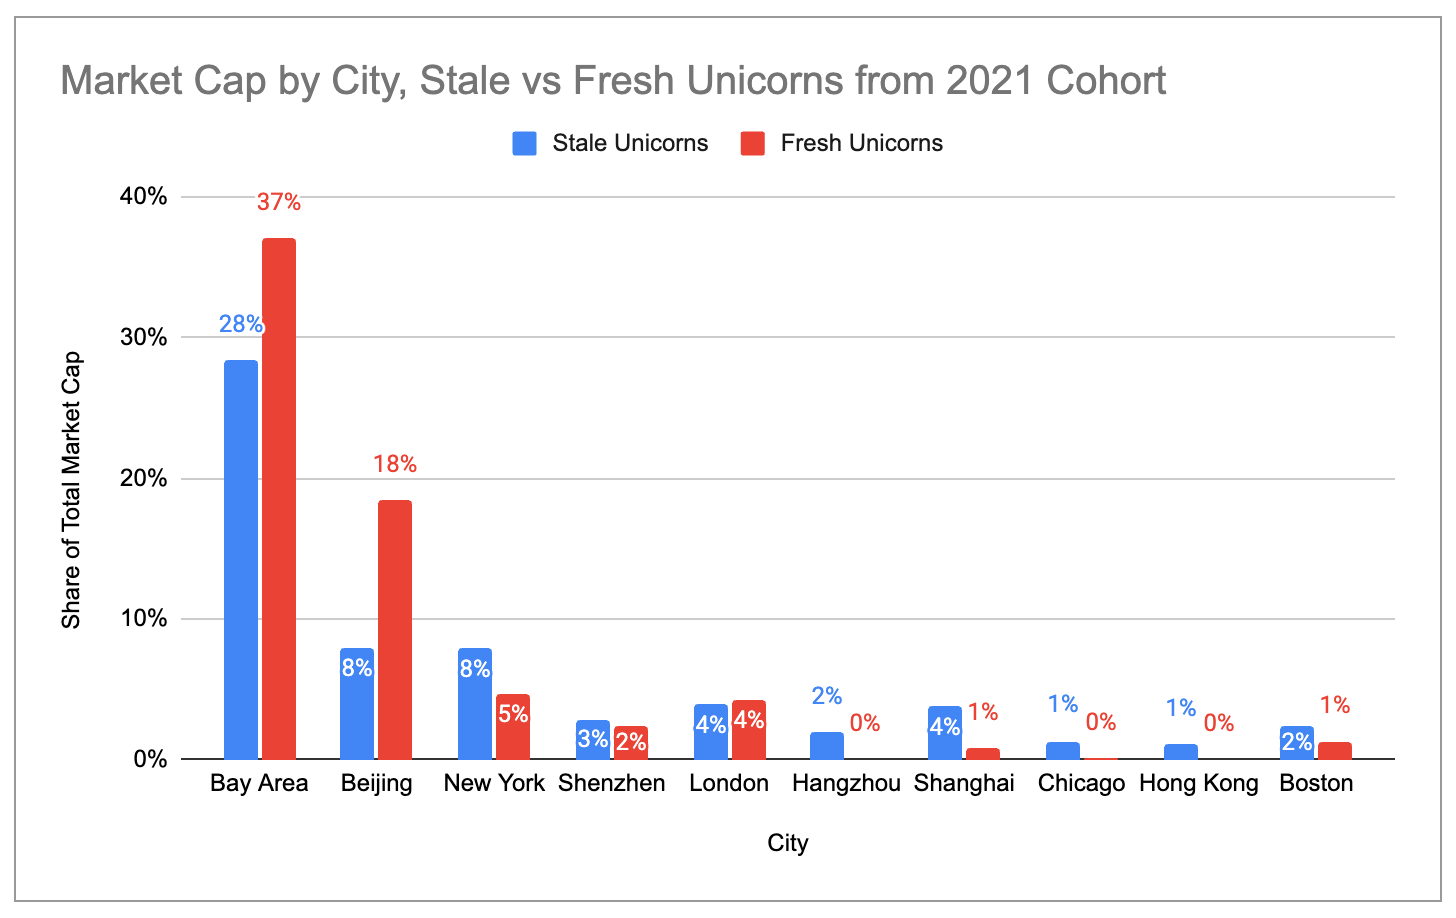
Figure Caption: Valuation Distribution of "Zombie" vs "Active" Unicorns by City
Four Major Unicorn Clusters in the U.S.
Within the United States, four "industrial cities" hold about 76% of the unicorn count and about 87% of the unicorn valuation: the Bay Area, New York, Los Angeles, and Boston. Among them, the Bay Area is the absolute leader, having more than double the unicorn count of the second city and over four times its valuation.
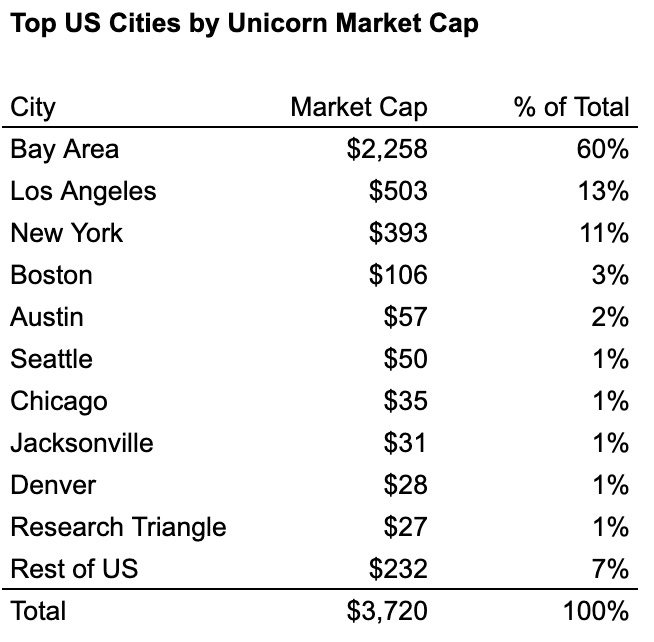
Figure Caption: Unicorn Count in Major U.S. Cities
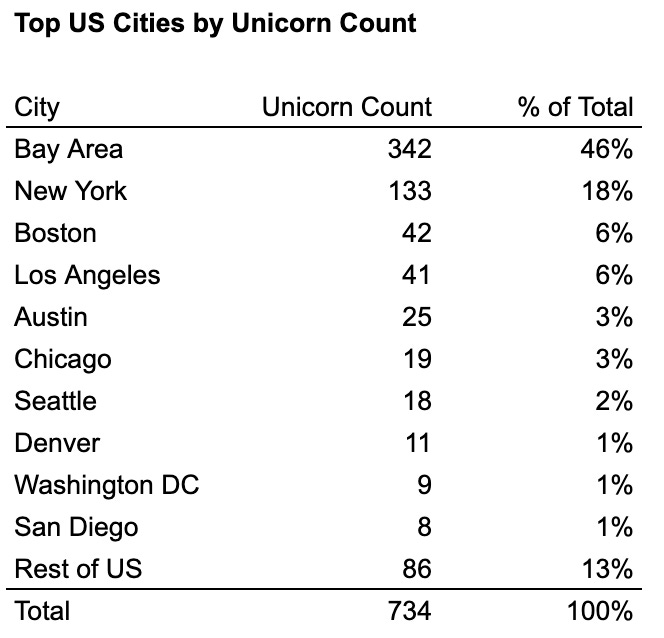
Figure Caption: Unicorn Valuation in Major U.S. Cities
Looking at the industry distribution of the top ten unicorns in each city, the clustering effect of industrial cities can be clearly seen:
- Bay Area = AI Cluster (6 out of the top ten are generative AI)
- New York = Fintech/Crypto Cluster (7 out of the top ten)
- Los Angeles = Defense/Aerospace + Consumer Cluster (3 out of the top six are defense/aerospace, 4 are consumer in the top ten)
- Boston = Relatively Balanced, but Biotech/Medical Leaning (3 out of the top ten)
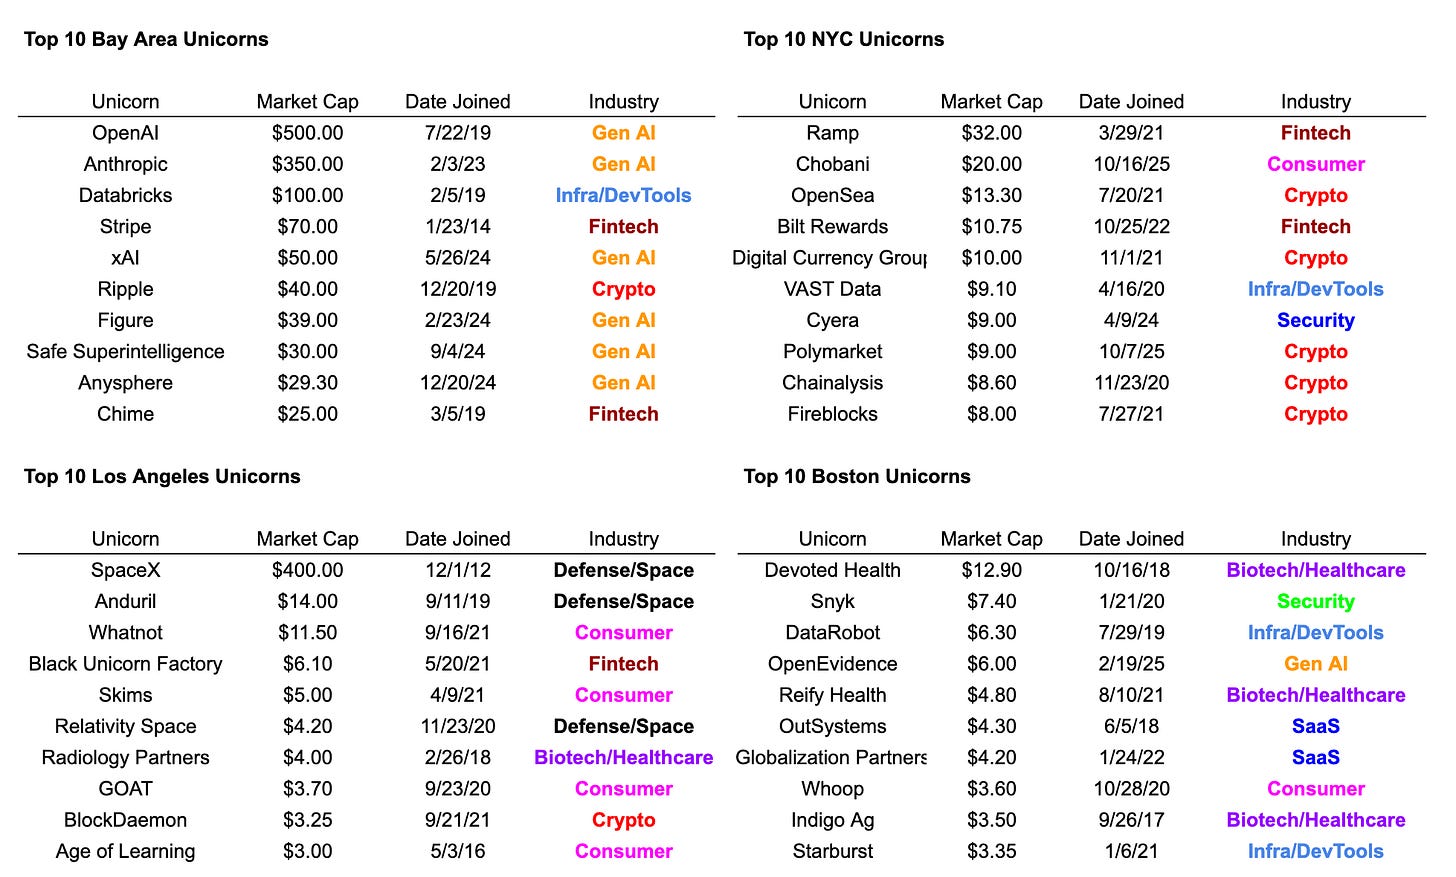
Figure Caption: Industry Distribution of Top 10 Unicorns in Four Major U.S. Cities
免责声明:本文章仅代表作者个人观点,不代表本平台的立场和观点。本文章仅供信息分享,不构成对任何人的任何投资建议。用户与作者之间的任何争议,与本平台无关。如网页中刊载的文章或图片涉及侵权,请提供相关的权利证明和身份证明发送邮件到support@aicoin.com,本平台相关工作人员将会进行核查。


