
Original: David Lin
Compiled & Organized by: Yuliya, PANews
The global financial market is at a critical juncture, with the artificial intelligence boom driving the stock market to new highs, but high government debt and interest rate uncertainty continue to pose risks. Are we in a "bubble of everything"? When will this bubble burst? To answer these questions, renowned YouTube host David Lin invited Dr. Richard Smith, Chairman and Executive Director of the Foundation for Cycle Research (FSC), to this episode. Dr. Smith uses his deep understanding of cycle analysis theory to dissect the future trends of core assets such as Bitcoin, gold, the stock market, and global debt. He believes that market liquidity is at the heart of all current issues, and the U.S. government's "fiscal dominance" strategy to maintain low interest rates is profoundly affecting every corner of the financial landscape, from cryptocurrencies to traditional stock markets. More importantly, he provides a clear prediction: a deeper crisis triggered by debt may arrive around mid-2026. PANews has compiled and organized the dialogue.
Is Bitcoin's Bottom Near? Everything Relates to "Fiscal Dominance" and Liquidity
Host: Bitcoin has been extremely volatile in recent weeks, falling from its peak to around $80,000, far below last year's high. Many are discussing whether Bitcoin's four-year cycle has ended, or if the "halving" narrative is still the main driver of prices as it has been in previous years. What is your view on Bitcoin's current state and future trends?
Richard: Bitcoin reveals many deep-seated issues in the current market. Our foundation has been closely monitoring Bitcoin. According to our cycle detection technology, we clearly indicated that a correction would occur when Bitcoin previously peaked.
But that doesn't mean it won't reach new highs again. I want to emphasize that Bitcoin's price reacts the fastest to the amount of money in the entire financial system (i.e., liquidity). Therefore, its price changes can be seen as an early signal of the overall market condition. An analyst named Michael Howell explained it well, stating that the core of today's market is actually "debt refinancing." We might think that the stock market's performance depends on company business and cryptocurrencies depend on technological innovation, which is somewhat true, but the more important fact is that we live in an era of "fiscal dominance." This means that the U.S. government has massive debt and must continuously borrow new debt to pay off old debt. However, if interest rates are too high, the interest the government has to pay becomes too burdensome. Therefore, the most important task for the U.S. government right now is to find every possible way to keep interest rates low. This need to manage debt is currently the main force affecting all financial markets.
Let me show you through our cycle analyzer.
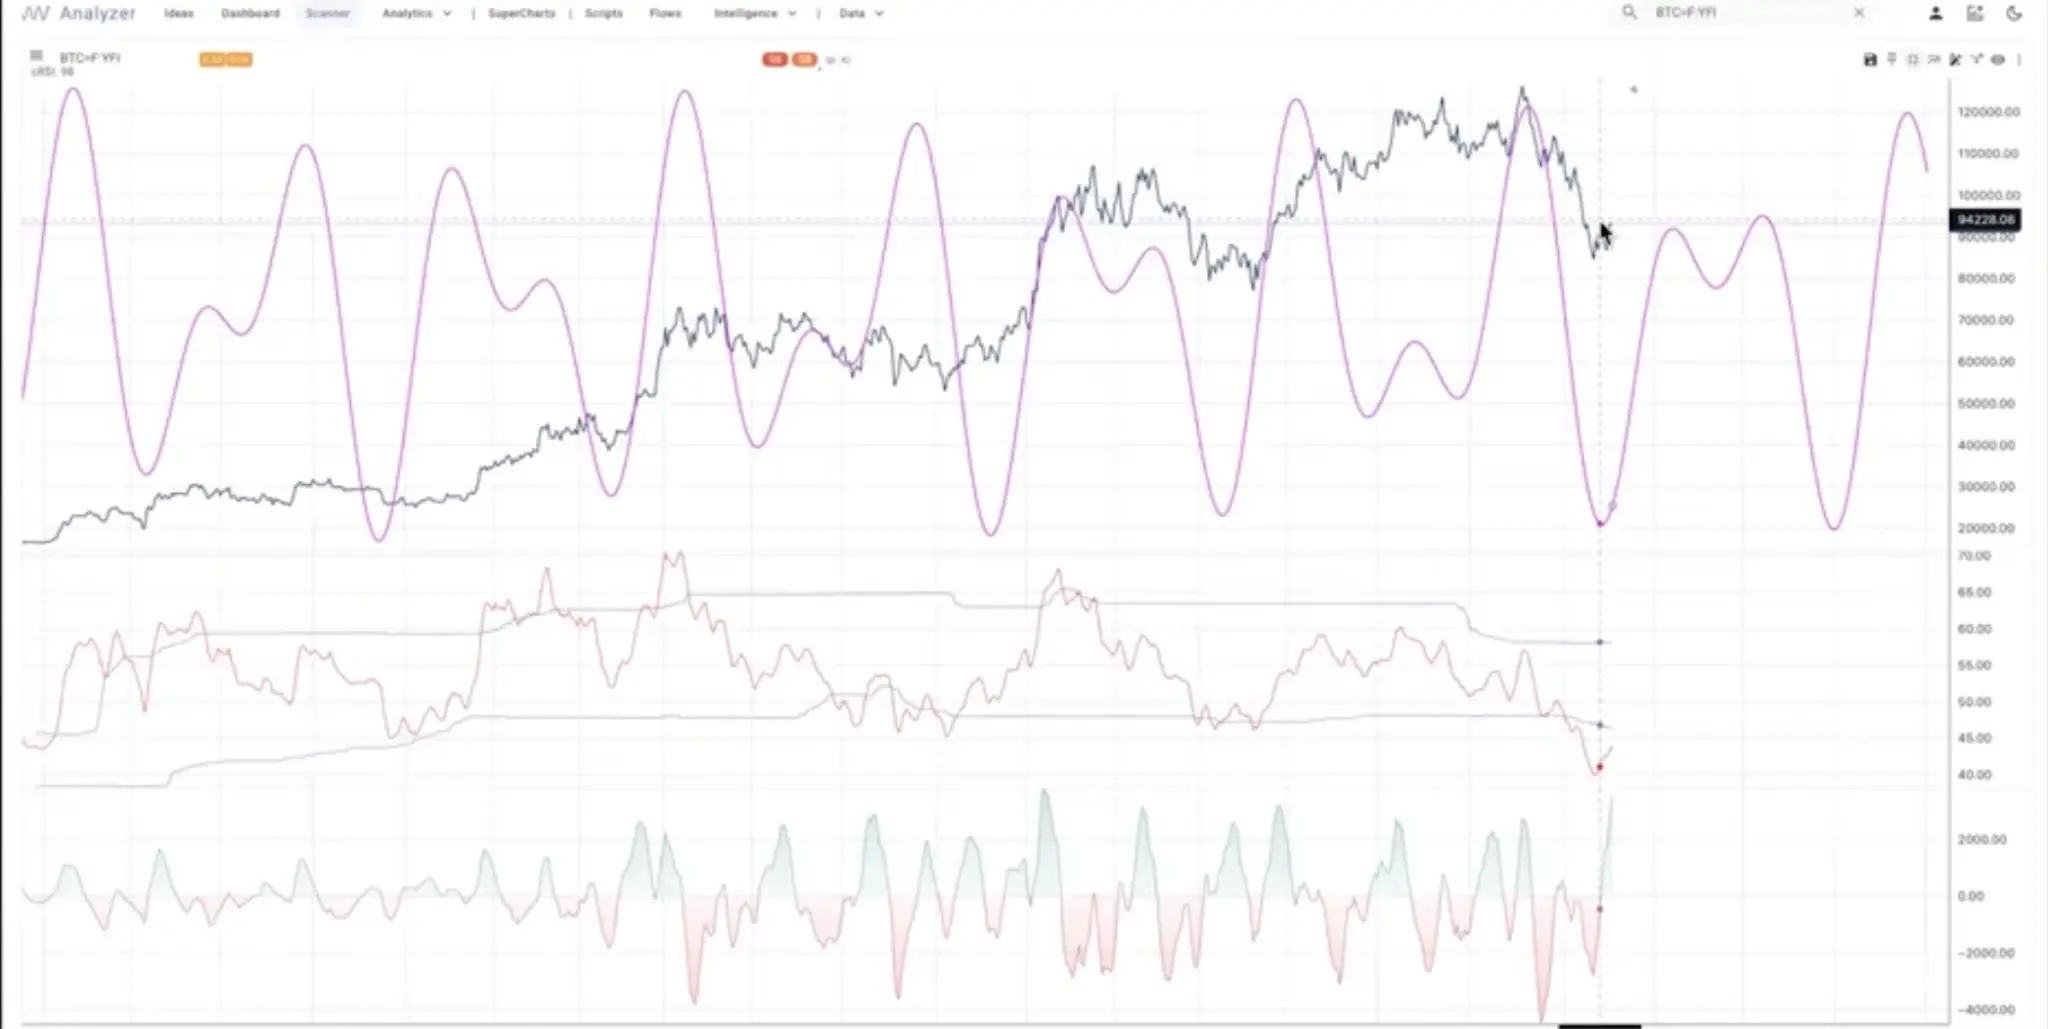
The blue line represents Bitcoin's price. We saw a peak of about $125,000 in October 2025, and our cycle model predicted that Bitcoin would experience a pullback at that time. Currently, this pullback seems to be nearing its end. I need to clarify that cycle analysis tells us the "wind direction"; it is not the only decisive force in the market, but we must know which way the wind is blowing.
Currently, the cycle model indicates that Bitcoin is searching for a bottom. Additionally, there are some fundamental factors that support this view. The recent Federal Reserve meeting clearly stated: they are prepared to stop quantitative tightening (QT) (PANews note: The Federal Reserve stopped QT on December 1). This is a very important signal because:
- Money market funds are no longer borrowing from the Federal Reserve
- They are not earning interest
- Liquidity in the system has become overly tight
When liquidity is too tight, the Federal Reserve must stop QT and begin injecting liquidity—this means: "invisible quantitative easing (QE) is about to return." The Federal Reserve must inject more liquidity into the system. They have made it clear: they will no longer just roll over maturing government bonds from the balance sheet, but will purchase new short-term government bonds to replace the old ones.
Currently, the Treasury is also primarily selling short-term government bonds to maintain financing because they cannot afford the high interest rates of long-term debt. All of this tells me that Bitcoin, as the asset most sensitive to liquidity, is cyclically bottoming out, coinciding with the news we hear about interest rate cuts, the possibility of a more dovish new Federal Reserve chair than Powell, and the expectation of interest rate cuts returning to the table in December. Behind all this is the core task of the U.S. government: it must maintain the operation of the entire system because the dollar and U.S. debt have become "too big to fail."
Host: Richard, I have data from the prediction market Kalshi. Regarding the question of "Will Bitcoin break $100,000 again this year?", the current views of market participants are about fifty-fifty. As a cycle analyst, how do you view this issue?
Richard: I haven't studied prediction markets in depth, and compared to the trillions of dollars in the Bitcoin market, a trading volume of $1.45 million is not significant. But for me, the most critical points are:
- Cycle peak signals are accurate: Our cycle model has predicted previous peaks well.
- Cycle pressure has been released: The model shows that the downward pressure from the cycle has basically been released, and now is a typical time for market participants to change their views.
- Market sentiment is pessimistic: We are now seeing a lot of negative news about Bitcoin, such as the significant decline in Michael Saylor's Strategy stock price, which is usually a signal of market sentiment bottoming out.
- Macro liquidity is improving: The Federal Reserve has stopped QT and may shift to some form of "invisible QE," which is positive for liquidity and will benefit Bitcoin in the long run.
We are about to enter the most seasonally bullish period of the year (the last few weeks of December and the first week of January). I do not expect a major financial crisis to erupt in the next 6 to 8 weeks. Overall, all of this suggests that liquidity will begin to return to the system, supporting assets like the stock market, Bitcoin, and Ethereum. As for whether it can set a historical new high, the stock market may have a chance, but Bitcoin still needs to be observed.
Macro Debt Cycle and Outlook for Gold and the Dollar
Host: This leads to my next question: Are market cycles independent of macroeconomic conditions? For example, most traders currently predict that the economy will achieve a "soft landing." How does your view of the economy influence your cycle analysis of assets like Bitcoin or gold?
Richard: The macroeconomic backdrop has a significant impact on asset performance, especially in the current phase of the debt cycle and interest rate changes. Looking back at history, from 1955 to 1981, long-term interest rates experienced a continuous rise for about 26 years, peaking at around 16%. According to the classic Kondratiev long cycle theory, interest rates should have completed a cyclical bottom around 2007 and entered a new upward cycle. However, the 2008 subprime mortgage crisis led governments worldwide to implement large-scale stimulus policies, including zero interest rates and quantitative easing (QE), which kept interest rates low for over a decade. It was only in recent years that interest rates began to rise significantly, and we are currently in a phase of high debt levels and rising interest rates.
This combination presents enormous challenges: heavy debt burdens and rising interest costs force fiscal policy to focus more on controlling volatility and interest rates. Asset performance is also profoundly affected; for example, Bitcoin has transformed into a completely different asset from 2012 to 2025, and its deep integration into the liquidity system makes it more susceptible to the influences of the debt cycle and policy cycle. Future asset trends need to be assessed in conjunction with the macro backdrop.
I would also like to mention stablecoins and money market funds.
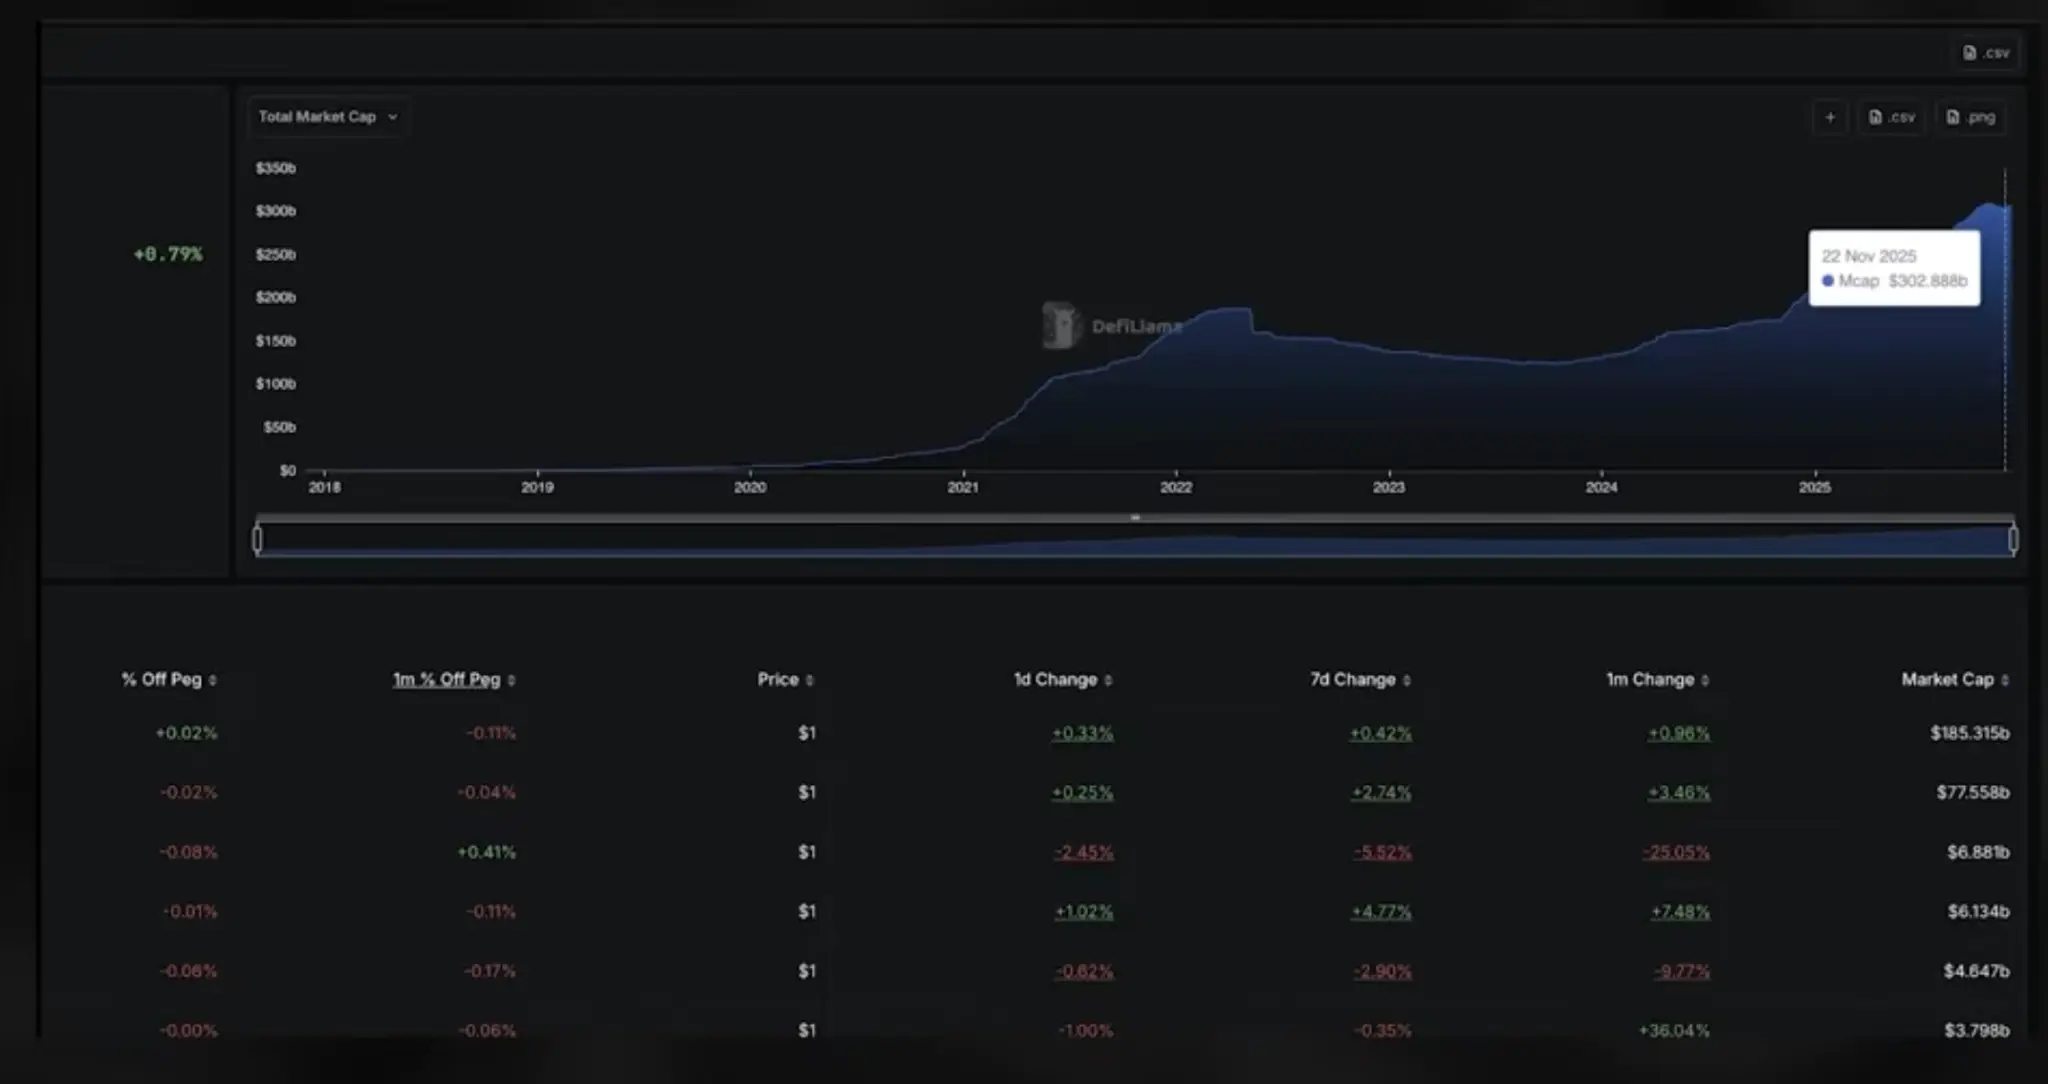
The market value of stablecoins has continued to grow since 2018, rising from almost zero to over $300 billion. Especially after Trump's election, the market value of stablecoins has shown a sharp upward trend. According to the "GENIUS Act," stablecoin issuers must purchase short-term U.S. government bonds as reserves after absorbing dollars. This effectively provides a new avenue for foreigners to purchase dollars and ultimately finance U.S. government debt.
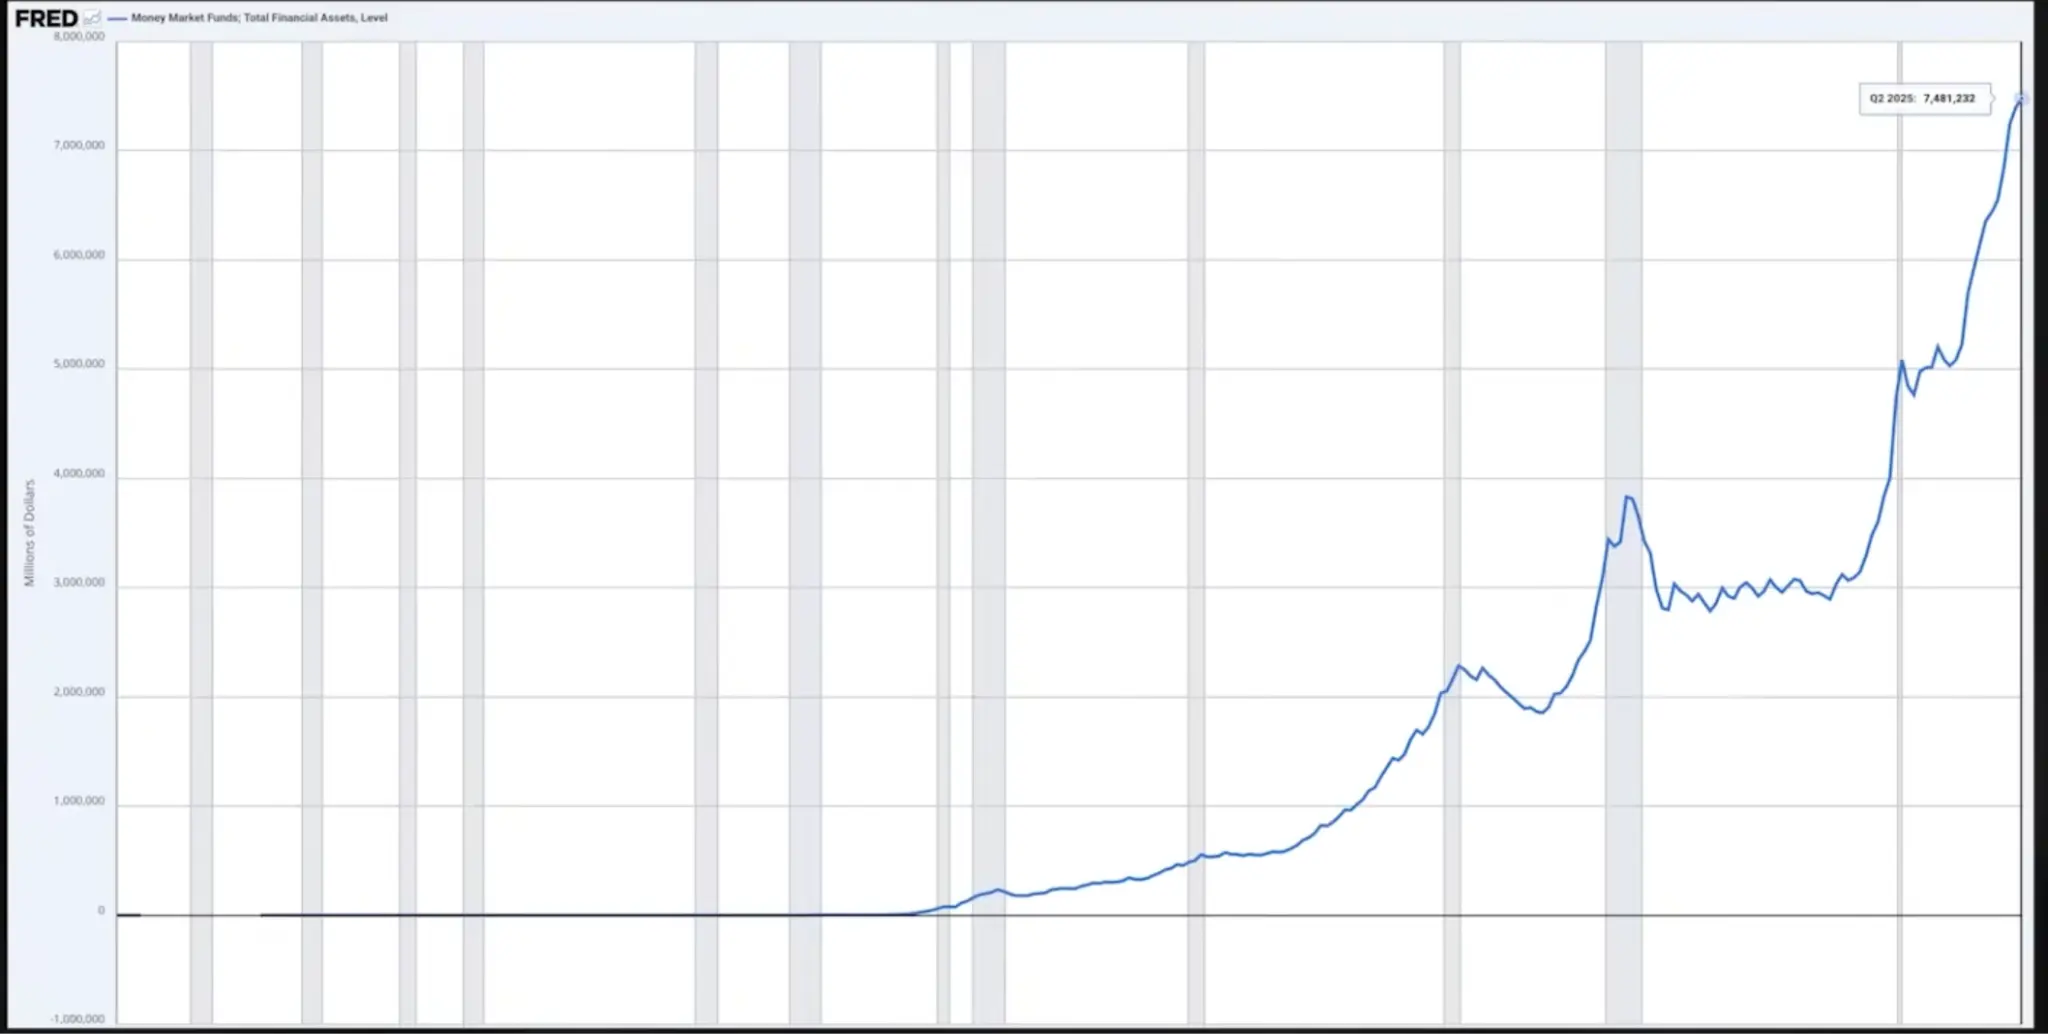
Similarly, the scale of money market funds has also surged, reaching $7.5 trillion. These funds typically purchase short-term U.S. government bonds after acquiring dollars, consistent with the model of stablecoins directing funds into short-term government bonds. Both ultimately point to the same goal: assisting the U.S. Treasury in continuously rolling over massive short-term government debt.
Currently, the U.S. Treasury prefers to issue short-term government bonds primarily because the interest rates on long-term government bonds are too high, and large-scale issuance of long-term debt would lead to an excessive interest burden for decades to come. To address the current political and economic realities, the Treasury prioritizes short-term funding needs, such as "getting through the midterm elections," while temporarily setting aside long-term risks.
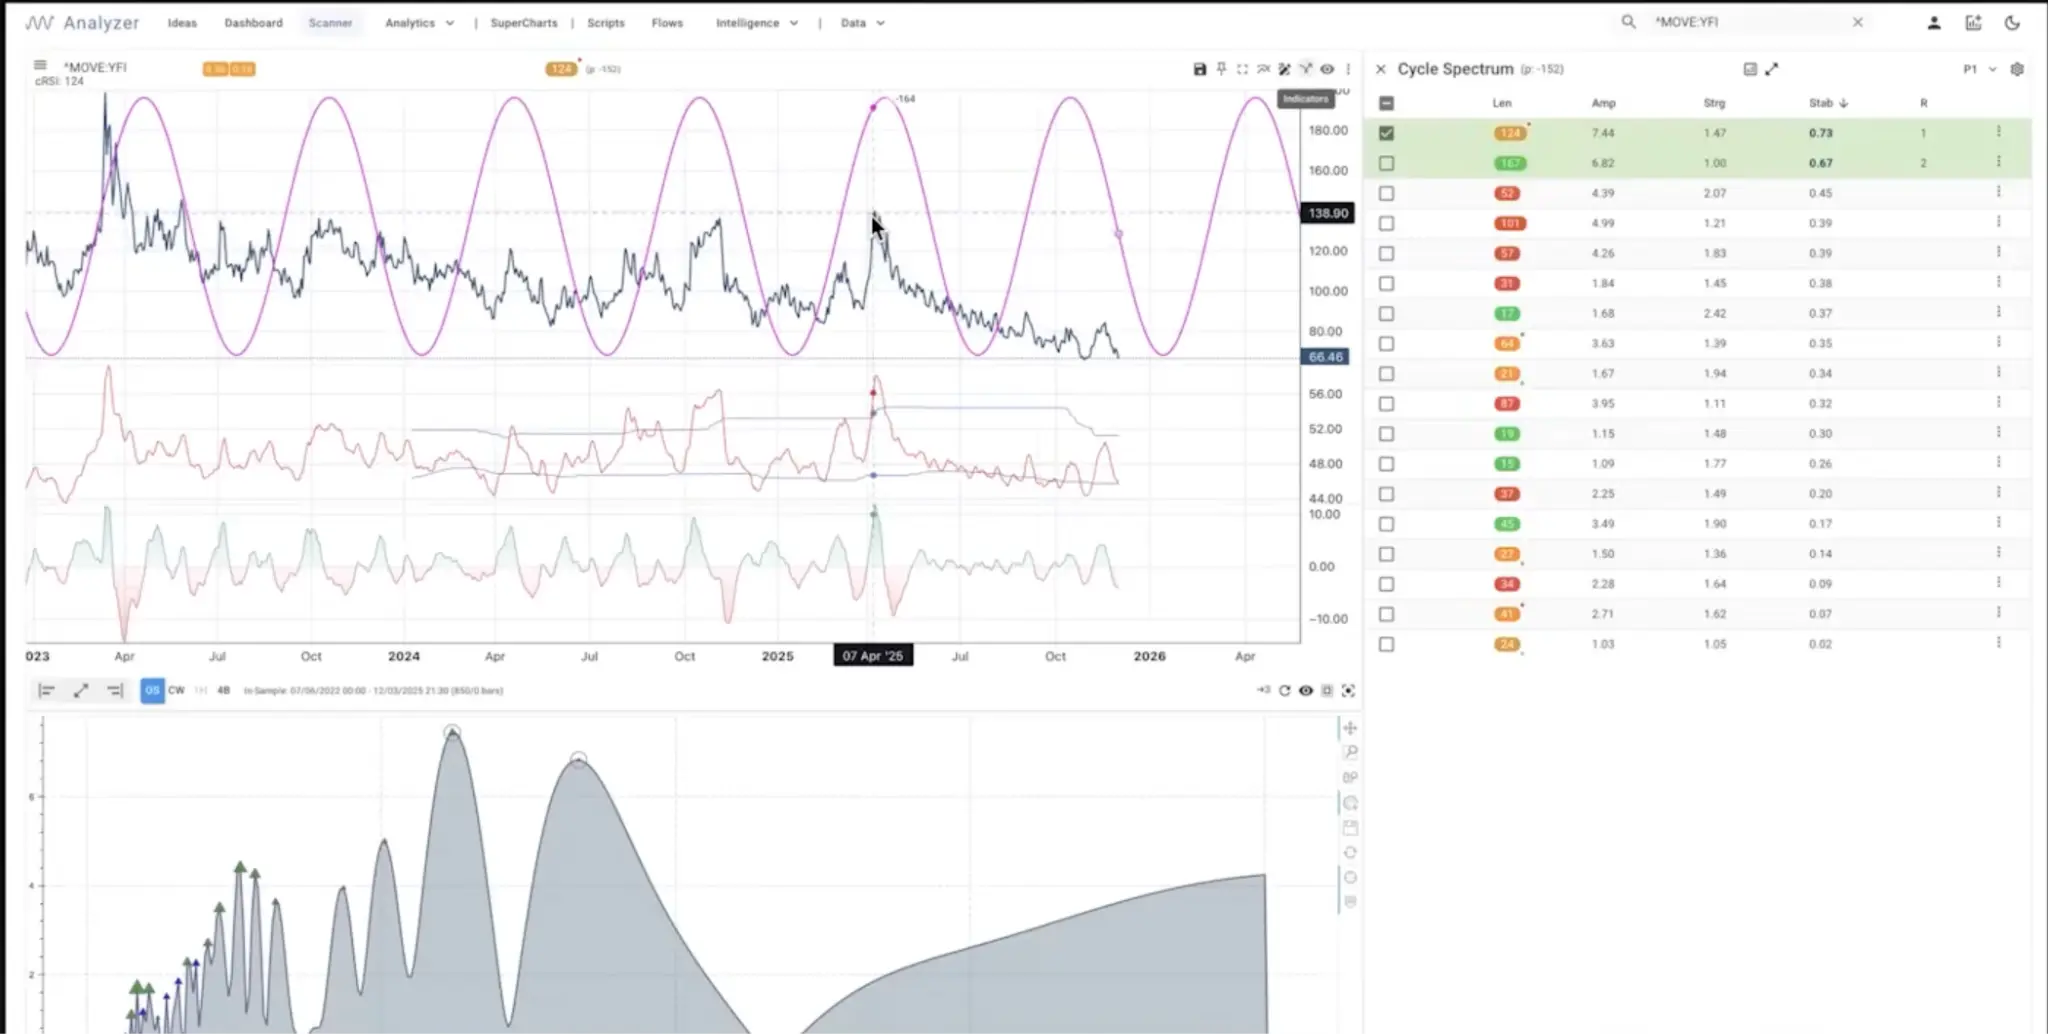
Richard: Currently, the MOVE index, which measures the implied volatility of the U.S. Treasury market (also known as the "VIX index of the bond market"), remains low. Since April, this index has dropped significantly and is currently at historical lows. This indicates that there is no crisis in the Treasury market at the moment. As long as the volatility of these assets is low, their value as collateral is high, and the repo system can operate normally. I do not see any signs of a major crisis in the Treasury market, and this situation may persist at least until January. As long as the bond market remains liquid, a slight easing from the Federal Reserve would be beneficial for both the stock market and cryptocurrencies.
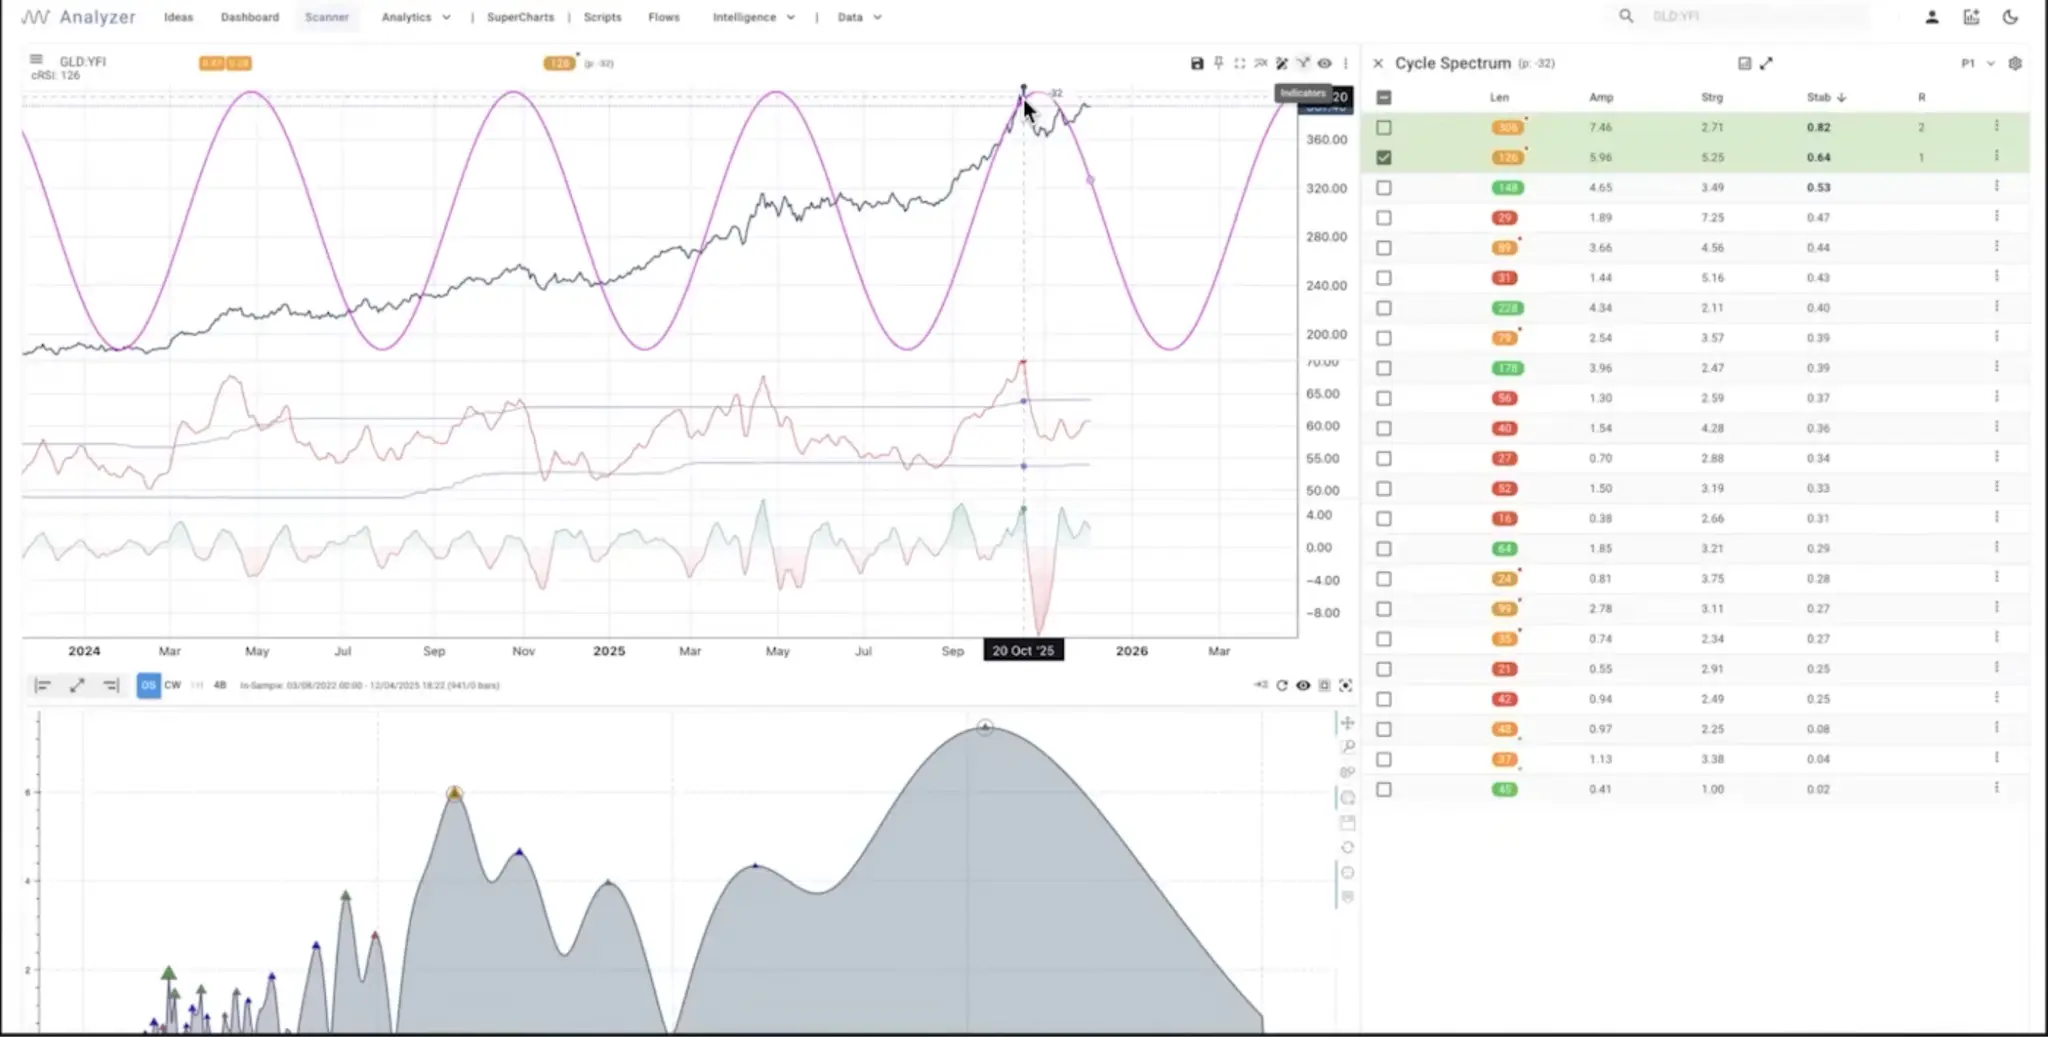
Now let's take a look at gold (GLD). Our cycle analysis indicates that gold should peak, and it indeed peaked around October 20. Although it did not crash, the power of the cycle has indeed slowed its upward momentum. I believe that the U.S. government's seizure of Russian assets during the Russia-Ukraine war is a serious warning to the global dollar system. This has prompted some central banks (especially in BRICS countries) to purchase gold to break free from complete dependence on the dollar and the U.S. government. This is part of the reason for the rise in gold prices.
Host: How significant of a pullback do you think gold will experience? Historically, after the bull market peaks in 2011 and 1980, gold saw declines of 40% to 60%.
Richard: The characteristic of cycle analysis is to reveal "time" and "direction," but it cannot directly predict the magnitude of price changes. While multiple cycle models indicate that gold should peak here, that does not mean it will "crash." Personally, I believe that due to concerns about the U.S. federal deficit and the real demand for gold purchases by central banks under geopolitical factors, gold will not experience a collapse. It just needs to "catch its breath," and the cycle suggests that this moment may have already arrived.
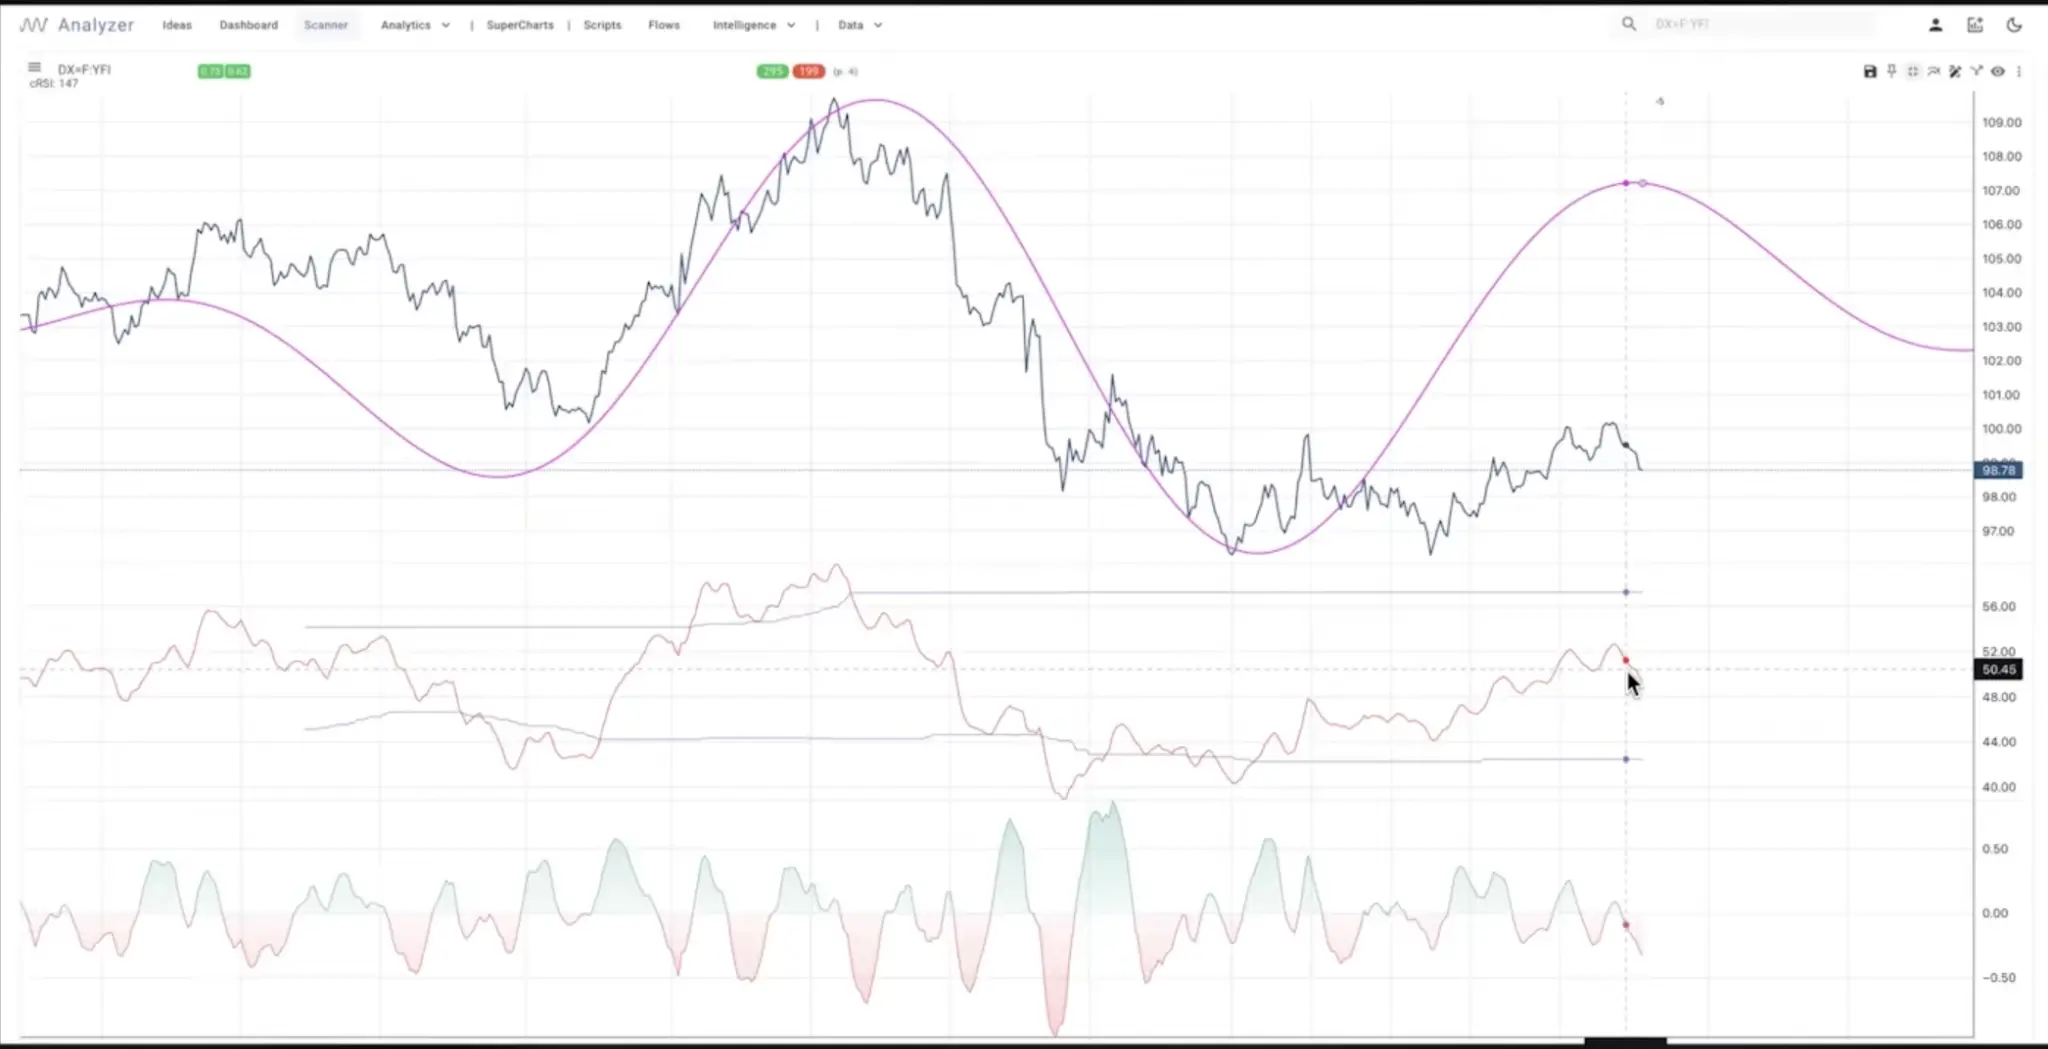
Closely related to gold is the fate of the dollar. In my view, the dollar is forming a bottom. It may still have some downward space and could even set a new low, but this is likely to be the final low. This is our proprietary momentum indicator, called "cyclical RSI." You can see that the momentum of the dollar is rising, but the speed of price increases is not as fast. I expect the dollar price may decline further, but the momentum will remain stable. I believe we will see a significant rebound in the dollar by 2026. Of course, this will put pressure on dollar-denominated assets like gold. Overall, I expect gold to be in a sideways or declining trend over the next 6 to 12 months.
"Everything Bubble" and 2026 Crisis Warning
Host: Do you think the cycle of one asset (like gold) can be used to predict the cycle of another related asset (like the dollar)?
Richard: Yes, you can often see similar cycle lengths in highly correlated assets. That’s why I pay attention to various markets, trying to grasp what I call the "fiscal dominance" macro picture. The primary task of the current market is to manage national debt and the federal deficit.
I even have a view that may sound a bit crazy: the massive investments we are currently seeing in AI data centers are ultimately aimed at lowering government bond yields. When these tech giants finance long-term debt for data centers, these newly issued, reasonably yielding corporate bonds enter the debt system, providing a benchmark for government bonds, thereby helping to lower government bond yields. At the same time, these companies need to participate more in the government bond market to hedge loan risks. All of this is aimed at lowering interest rates across the entire yield curve. I suspect that the motivation behind this massive investment in AI is more driven by fiscal dominance needs rather than genuine productivity needs.
Host: Speaking of this, I can't help but ask, are we currently in an "Everything Bubble"? Since 2008, especially after the pandemic in 2020, we have seen almost all assets, including stocks, Bitcoin, gold, and real estate, rise together driven by the expansion of the money supply. At what stage do you think we are in this cycle?
Richard: You are correct. The root of this "Everything Bubble" is the astonishing expansion of financial assets due to historically unprecedented low interest rates. From 2008 to recently, this bull market has almost perfectly matched the trajectory of the 10-year government bond yield falling from 16%-17% to zero.
Now that interest rates have risen, the Federal Reserve has offset the negative effects of rate hikes through massive stimulus measures (QE). However, without another sudden crisis, this large-scale stimulus can no longer be justified. We are in a very delicate situation: the country is close to bankruptcy, and the currency is also facing a crisis.
I believe this situation can last for a while longer, but not for too long. My intuition tells me that the turning point is around mid-2026.
Host: You mentioned that JP Morgan predicts a record $1.8 trillion in bond issuance in 2026, mainly driven by AI investments. If this indeed lowers yields, wouldn't it be a positive for risk assets? Does this contradict what you said about the "top phase"?
Richard: This is precisely one of the important reasons I believe the top phase may be "extended" or experience "right translation" (a term in cycle analysis referring to a top appearing later than expected). The market still has "ammunition." For example, the Federal Reserve's current rate is 3.75%, and people are accustomed to zero rates, so they feel there is "room for rate cuts." Personally, I believe there is actually no room for rate cuts, but I think they will eventually cut rates. And this will ultimately lead to soaring inflation and trigger a larger crisis.
Host: If this larger crisis does erupt, what will it look like?
Richard: It will likely manifest as: soaring interest rates, the federal deficit placing a heavier burden on the fiscal budget, the rise of populism, and voter anger. Frankly, the day I truly feel optimistic about the future will be when we no longer rely on the federal government to save us.
Host: So, are there specific indicators or "milestones" we can observe to see if we are approaching the crisis scenario you described?
Richard: Absolutely. I focus on two key indicators:
- MOVE Index: This is the volatility index of the bond market. You need to be alert to whether it starts to rise. Currently, it has been declining sharply since April, so things are still okay.
- High-Yield Bond Option-Adjusted Spread: This measures the spread of high-risk debt, which is also at historical lows.
As long as the volatility of these debts remains low and controllable, they can be used as collateral for refinancing within the system. The problem is that when these indicators start to rise significantly, the crisis is near. Keep in mind that during the zero interest rate period in 2020, a large number of loans (with an average term of about 5.5 years) are now facing refinancing pressure. So far, they have managed to keep the situation under control. But if significant changes begin to occur, we will see larger pullbacks in financial assets.
Host: One last question, are there any mainstream financial assets that are completely devoid of cyclicality, making your analysis methods inapplicable?
Richard: Personally, I have had the least success in the natural gas market. Natural gas is a commodity that is extremely difficult to store, leading to its high volatility, unlike other commodities like oil that follow typical supply and demand cycles. So, there are indeed some markets where cycle analysis is difficult to apply. Additionally, cycle analysis is more effective in a long-term framework than in the short term (such as intraday trading).
免责声明:本文章仅代表作者个人观点,不代表本平台的立场和观点。本文章仅供信息分享,不构成对任何人的任何投资建议。用户与作者之间的任何争议,与本平台无关。如网页中刊载的文章或图片涉及侵权,请提供相关的权利证明和身份证明发送邮件到support@aicoin.com,本平台相关工作人员将会进行核查。


