As the end of September approaches, Bitcoin's price fluctuates around $109,000, and market sentiment quietly shifts towards expectations of "Uptober" (a bullish October).
This seasonal phenomenon is not without basis; historical data reveals that October is often one of the strongest months for Bitcoin performance throughout the year. However, this year's market environment is complex—September did not exhibit the traditional "curse," but increased volatility, large-scale ETF fund outflows, and macro policy uncertainties have cast a shadow over the trajectory for the fourth quarter. This article will deeply analyze Bitcoin's potential trajectory in the fourth quarter from four dimensions: historical patterns, current market dynamics, the tug-of-war between bullish and bearish factors, and future path outlook.
1. "Uptober" in History: Data Support and Seasonal Logic
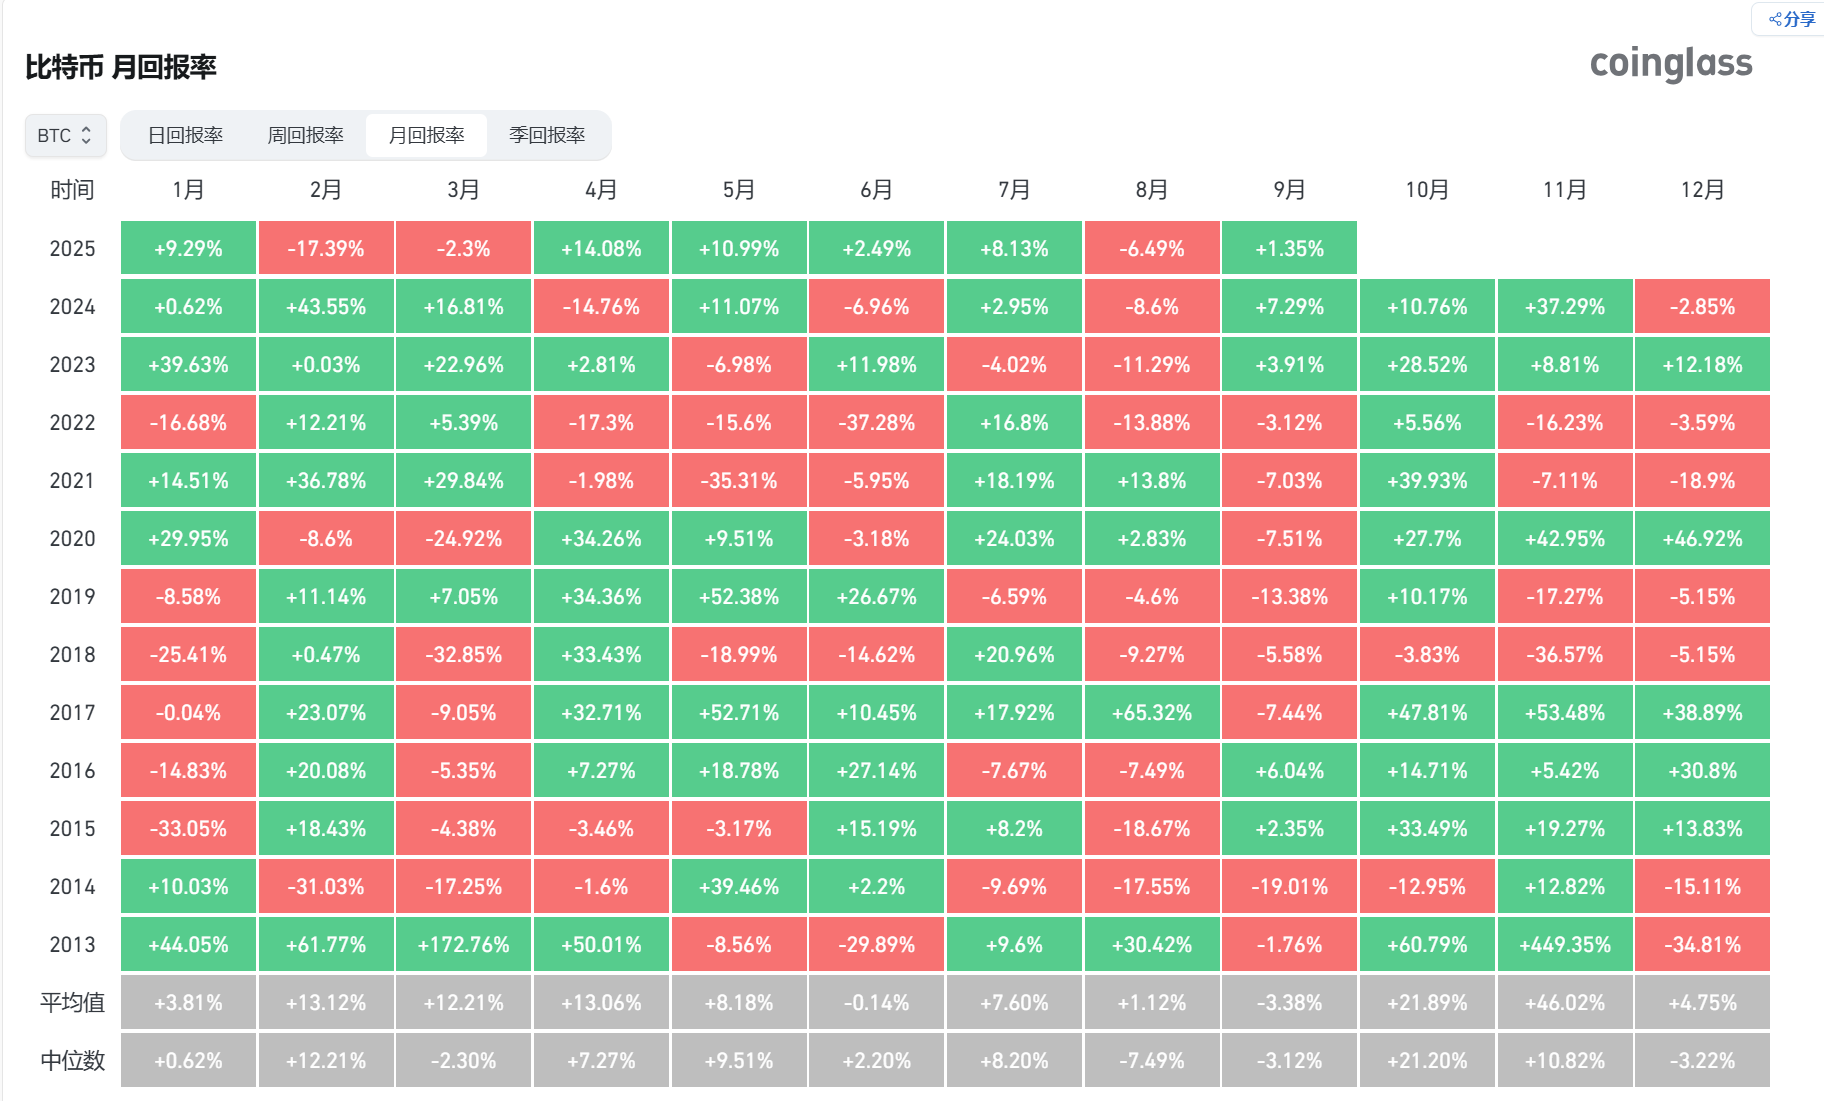
Since 2013, Bitcoin's performance in October has shown significant regularity: in the past 12 years, it has recorded gains in 10 instances, with an average increase of 21.89%. Notably, during bull market phases in 2013 (+60.79%), 2017 (+47.81%), and 2021 (+39.93%), the gains were particularly pronounced.
This phenomenon has been dubbed "Uptober" by the market, supported by multiple logical underpinnings.
First, the fourth quarter is typically a window for institutional fund reallocation, as investors tend to increase their risk appetite towards high-volatility assets as the year-end approaches.
Second, Bitcoin's halving cycle often resonates with October—both the 2017 and 2021 bull markets began in October, and the supply contraction effect post-2024 halving may also become concentrated in the fourth quarter.
Additionally, the macro liquidity environment tends to loosen in October: the Federal Reserve has shifted to a dovish stance multiple times in September-October in recent years. For instance, after a rate cut in September 2024, market expectations for further cuts in October rose to 91.9%, providing fuel for risk assets.
However, history is not an absolute template. October 2014 and 2018 recorded declines of -12.95% and -3.83%, respectively, indicating that "Uptober" must work in conjunction with the macro backdrop to be effective.
September 2025 ended with a slight increase of 1%. Although it did not trigger a significant drop, it also did not accumulate enough momentum, making October's direction more reliant on real-time fundamentals rather than purely seasonal patterns.
2. Current Market Status: The Legacy of September's Volatility and Divergence in Capital Flow
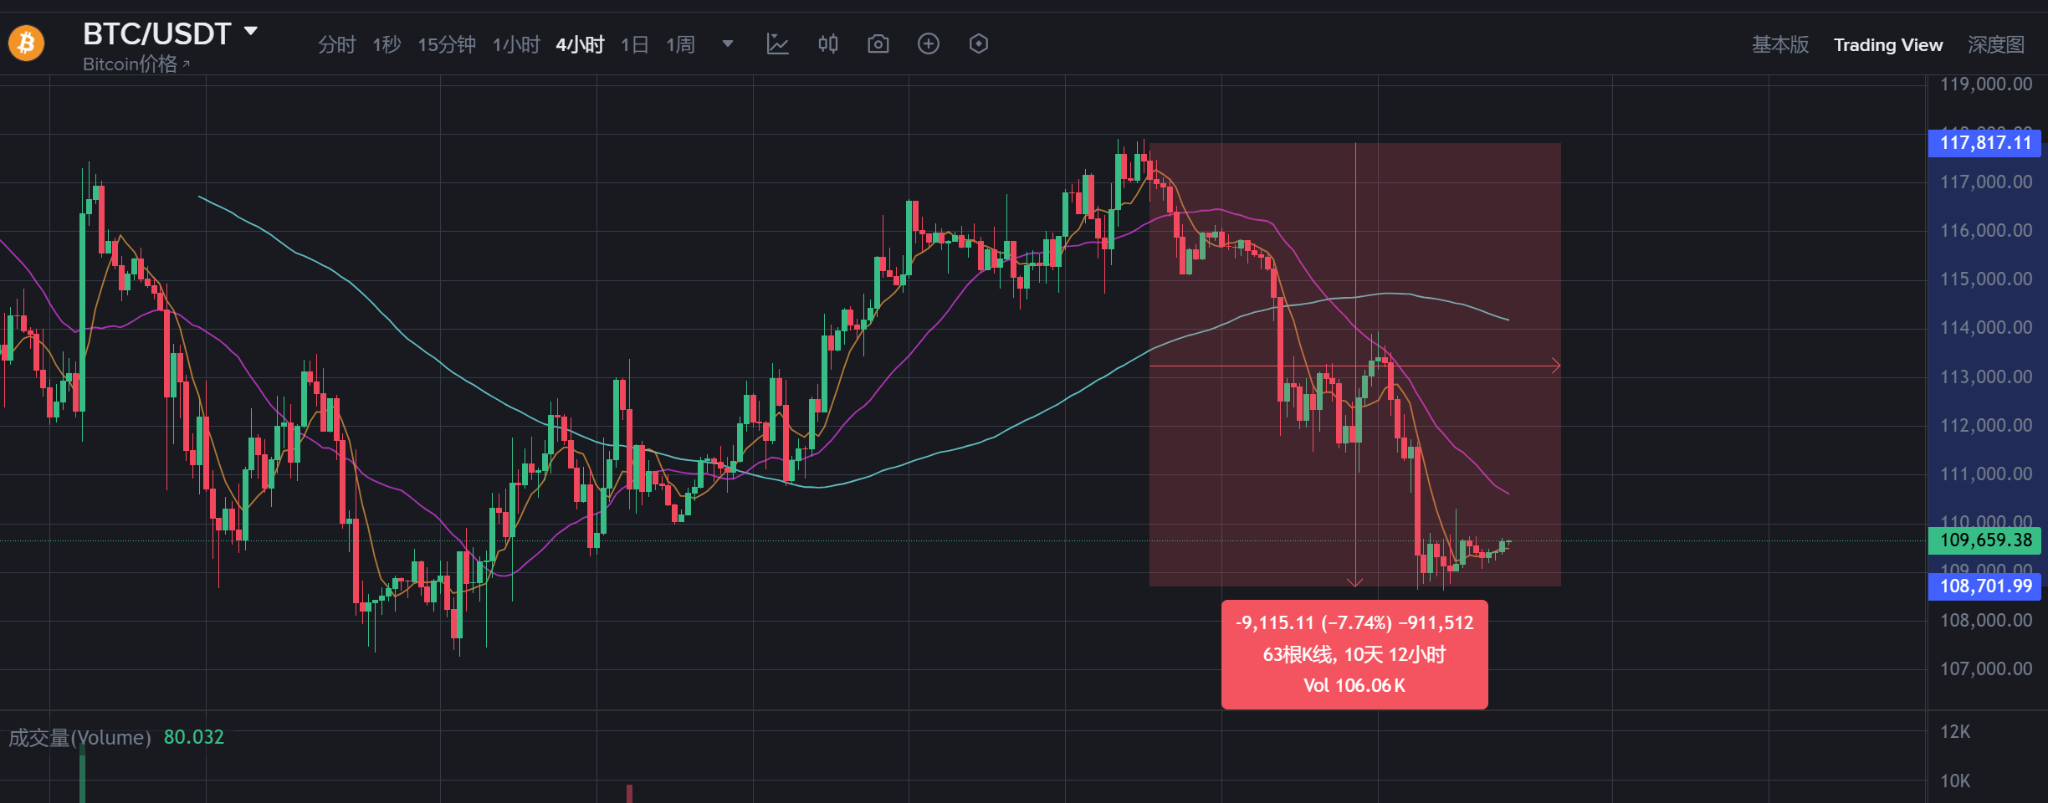
In the last two weeks of September, Bitcoin fell from $117,000 to around $108,000, a decline of nearly 8%. During this period, the total liquidation amount across the network exceeded $3 billion, with long positions being massively cleared.
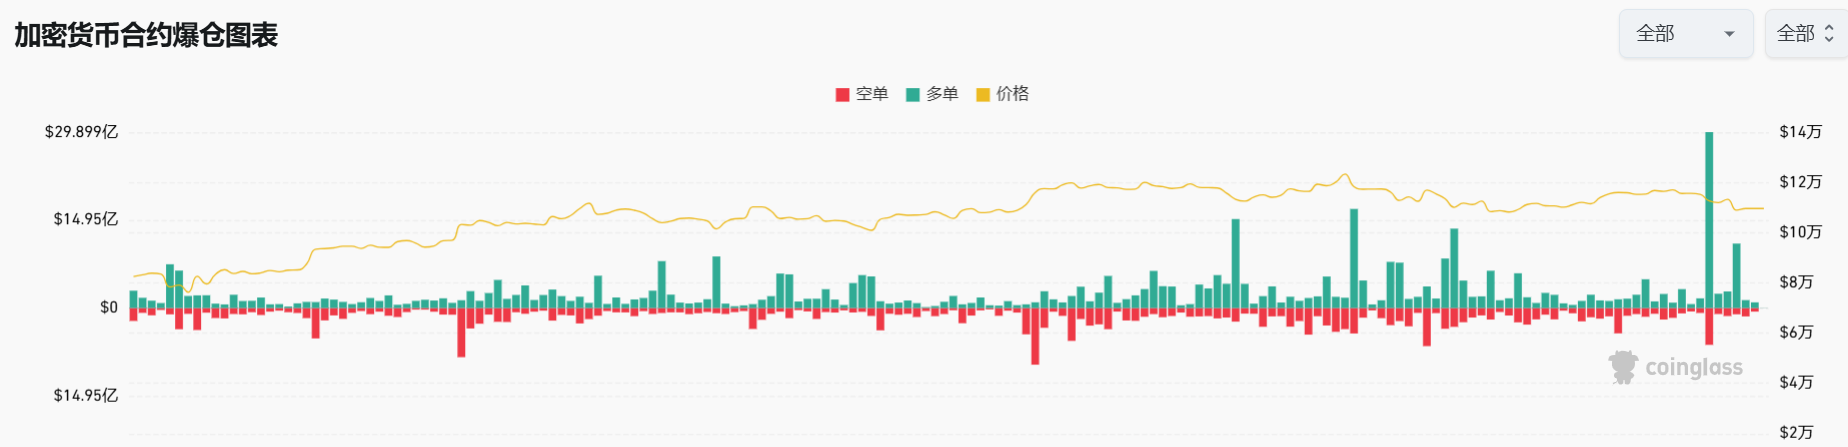
Some analysts view this adjustment as a "healthy correction," as it cleared excessive leverage and laid the groundwork for a subsequent rebound. However, signals from the capital front appear contradictory:
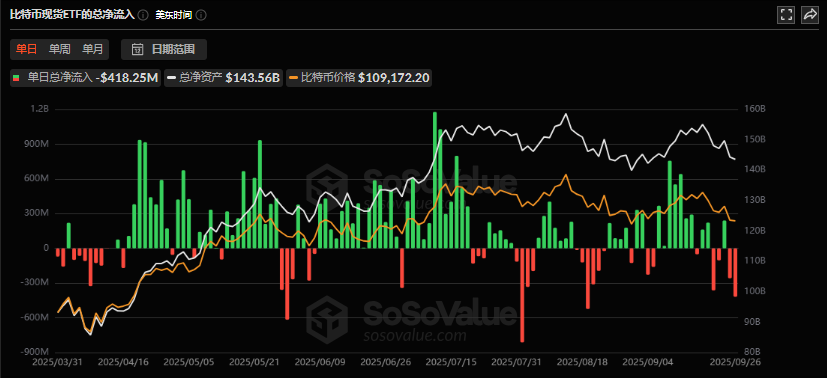
- Increased ETF fund outflows: Bitcoin spot ETFs have seen consecutive days of net outflows, with a weekly scale reaching $902.5 million, and both BlackRock's IBIT and Fidelity's FBTC have experienced significant redemptions.
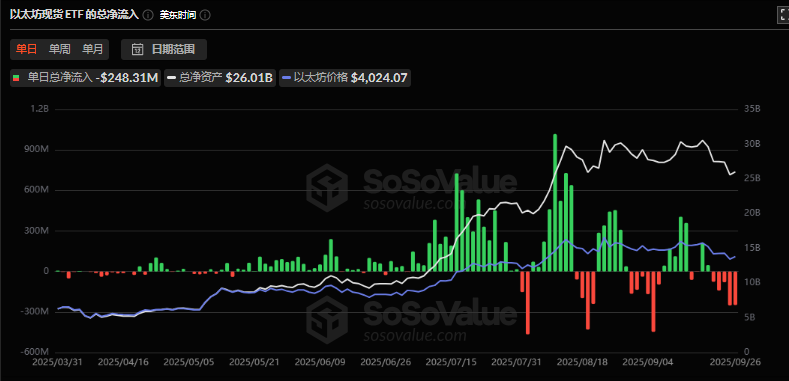
- Ethereum ETFs are also weak, with weekly outflows nearing $800 million, marking the worst record since their launch. The phase of cooling institutional demand reflects the market's cautious attitude towards overvalued assets.
- On-chain data shows resilience: Despite price pressure, long-term Bitcoin holders (HODLers) have not exhibited panic selling. The net realized profit and loss (NRPL) remains positive, and buying activity around the key support level of $109,500 is active, indicating that core investors' confidence in long-term logic remains unchanged.
This divergence reveals the core contradiction in the market: short-term capital flows are constrained by macro uncertainties (such as Federal Reserve policy divergence and U.S. election disturbances), while Bitcoin's scarcity narrative (institutional accumulation and halving supply contraction) continues to provide long-term support.
3. Fourth Quarter Driving Factors: The Tug-of-War Between Bullish and Bearish Forces
1. Bullish Catalysts
- Shift in macro liquidity: If the Federal Reserve cuts rates as expected at the FOMC meeting on October 29, it will weaken the dollar. Historical data shows a negative correlation of -0.25 between Bitcoin and the dollar index (a two-year low), making it easier for funds to flow into the crypto market during a rate-cutting cycle.
- Deepening institutional behavior: As of August 2025, over 290 companies hold Bitcoin worth $163 billion, with corporate demand growing at about 4.3 times the Bitcoin production rate. Additionally, Ethereum's fork upgrade is scheduled for April 2026; if the technical upgrade proceeds smoothly, it may reignite market interest in smart contract platforms.
- Defensive key levels in technical analysis: If Bitcoin holds the $109,500 support level and breaks through the $117,700 resistance, it could trigger a trend reversal. Technical analysts believe the current price action is highly similar to the consolidation before the 2017 bull market began.
2. Risk and Suppressive Factors
- Regulatory uncertainty: The U.S. SEC's intensified compliance scrutiny of crypto exchanges and investigations into the Digital Asset Treasury (DAT) model may suppress the pace of institutional entry.
- Weak market sentiment: The negative feedback loop from ETF fund outflows could amplify selling pressure, especially if prices fall below key support levels, potentially leading to panic selling that tests the $98,000 low.
- Potential impact of black swan events: Recent hacking incidents involving projects like UXLINK and GriffinAI have triggered localized panic; if security incidents spread, they could undermine overall confidence.
4. Future Path Projection: Market Trends Under Three Scenarios
Based on current variables, the fourth quarter may present the following three scenarios:
Optimistic Scenario (30% probability): The Federal Reserve releases a clear dovish signal, Bitcoin quickly recovers to $115,000 and challenges historical highs. Institutional funds flow back into ETFs, combined with the "Uptober" sentiment, pushing prices towards the $165,000 target.
Neutral Scenario (50% probability): A tug-of-war between bullish and bearish factors leads to Bitcoin fluctuating widely in the $100,000-$120,000 range. The market awaits clear signals such as the U.S. rate cut results, with volatility remaining high but lacking a definitive trend direction.
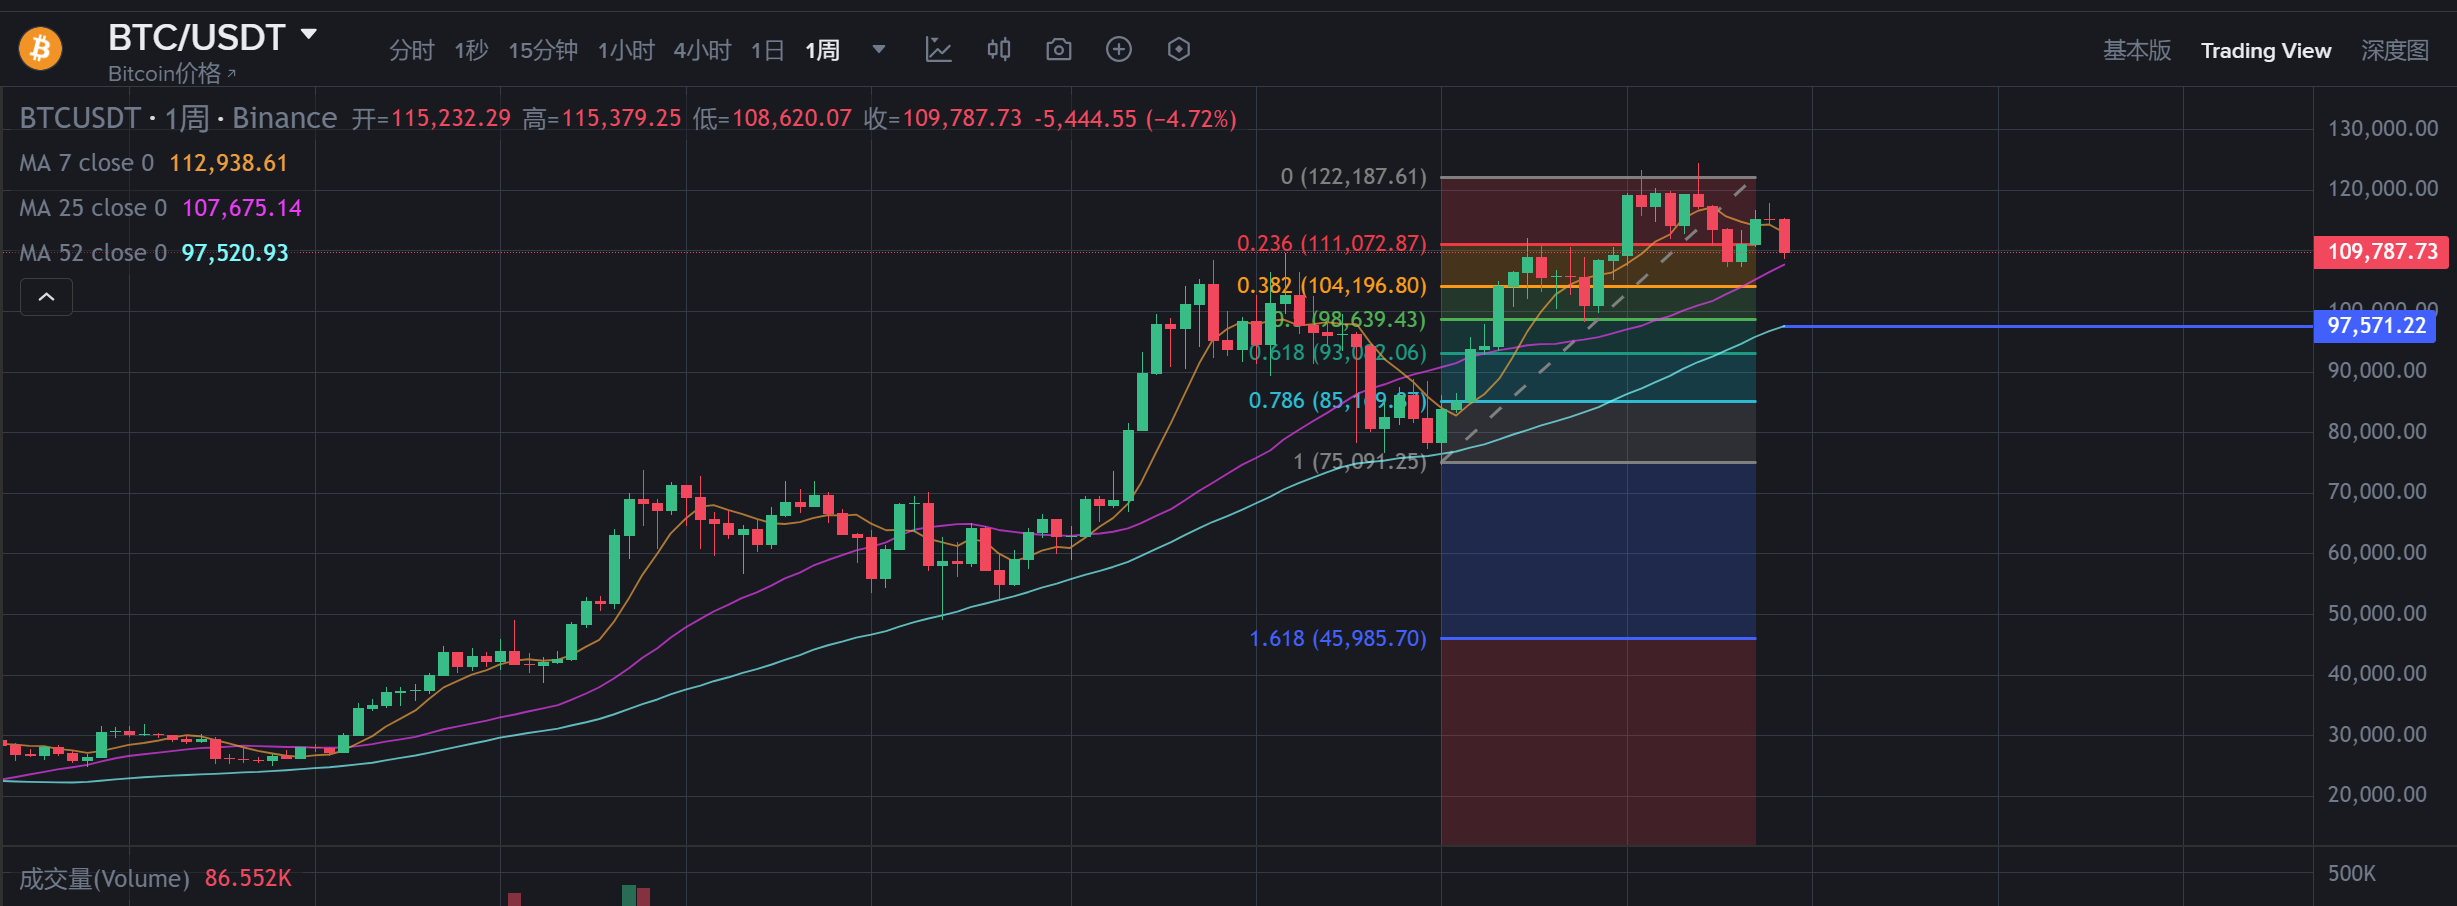
Cautious Scenario (20% probability): Deteriorating macro data, geopolitical factors, or tightening regulations trigger systemic selling, causing Bitcoin to test the $100,000 support. If this level is breached, it may further test $98,000 (the 52-week moving average), but long-term investors may accelerate accumulation in this area.
Conclusion: Seeking Balance Between Seasonal Patterns and Real-Time Fundamentals
"Uptober" is not an automatic calendar magic but a combination of historical probabilities and market psychology. In the fourth quarter of 2025, Bitcoin faces short-term pressure from institutional fund outflows while enjoying long-term support from the rate-cutting cycle and scarcity narrative. For investors, rationally viewing seasonal patterns and closely monitoring changes in Federal Reserve policy and ETF fund flows is essential to navigate volatility and seize opportunities.
免责声明:本文章仅代表作者个人观点,不代表本平台的立场和观点。本文章仅供信息分享,不构成对任何人的任何投资建议。用户与作者之间的任何争议,与本平台无关。如网页中刊载的文章或图片涉及侵权,请提供相关的权利证明和身份证明发送邮件到support@aicoin.com,本平台相关工作人员将会进行核查。


