Understanding wealth management and asset valuation hinges on inflation.
Written by: Michael Howell
Translated by: Block unicorn
Asset allocation is often done in a vacuum, rarely considering the monetary policies that investors will face. The standard approach is to create a portfolio with a 60:40 allocation, investing in stocks (risk assets) and high-quality bonds (safe assets). The rationale is that these two asset classes are negatively correlated at many times, especially during economic downturns.
While this thinking forms the cornerstone of modern wealth management, it is actually only applicable in specific times and under special circumstances. These periods lasted from the early 1980s until the 2008/09 global financial crisis (GFC). This approach was not applicable in the 1970s and arguably is not applicable today.
The key to understanding wealth management and asset valuation lies in inflation. In short, while we all clearly wish to become wealthier, our primary focus is at least on maintaining our real wealth levels. Assets should not be compared to each other (like bonds versus stocks), but rather to inflation.
Inflation can be a difficult concept to measure, but for the sake of illustration, let’s assume it represents the loss of purchasing power of paper currency. Inflation can stem from monetary inflation, i.e., "printing money," or from cost inflation, such as rising oil prices and declining productivity.
The chart below illustrates how inflation affects the valuation of different asset classes. The chart is illustrative, but empirical construction can be made using long-term data published by academic Robert Shiller on his website. We have used data since 1880 to show our version below. The curves are fitted using polynomial regression.
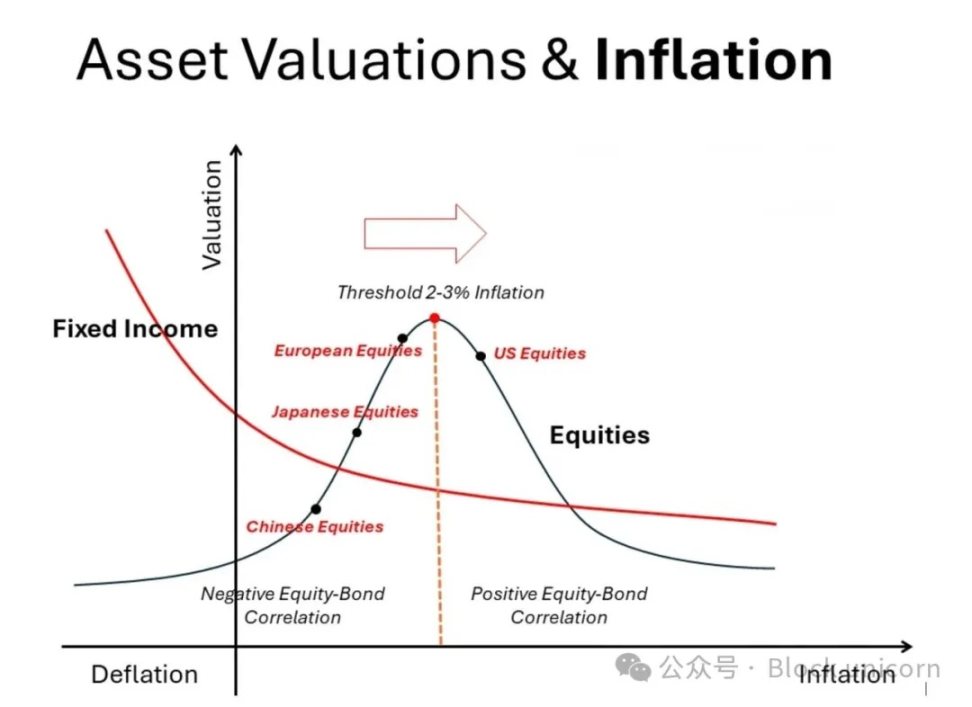
High-quality bonds (like U.S. Treasuries) exhibit a monotonic relationship: as inflation accelerates, their valuations decline (yields rise); as deflation approaches, their valuations rise (yields fall). Textbooks also acknowledge this trade-off. Physical assets (not shown in the chart), such as residential real estate, land, gold, and perhaps Bitcoin, follow a completely opposite path. As inflation accelerates, their valuations and prices rise accordingly.
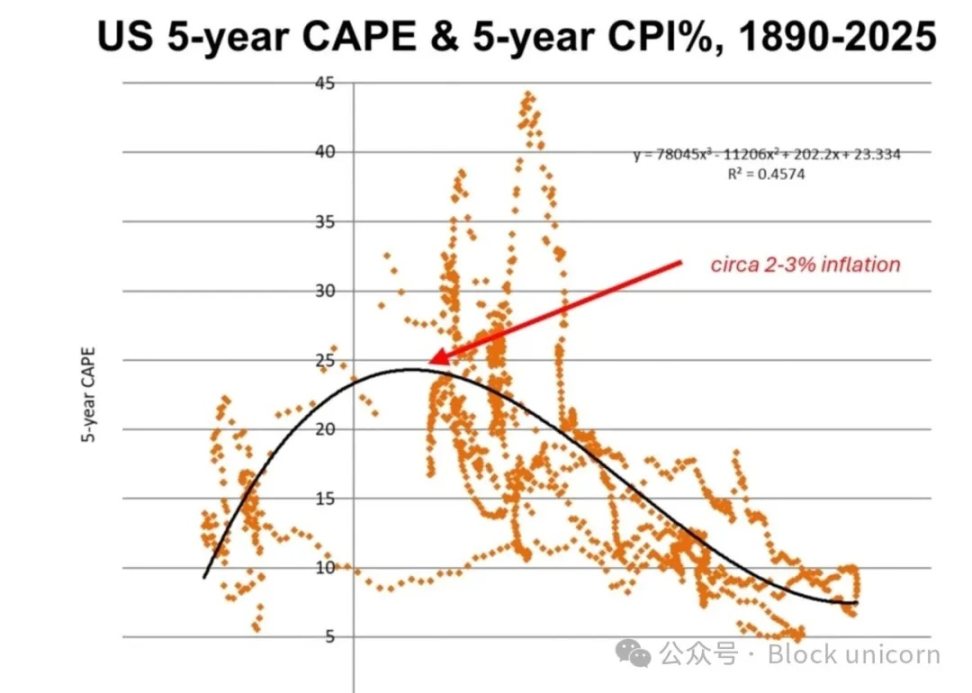
In contrast, the relationship between stocks and inflation is more complex and nonlinear. This is not mentioned in financial textbooks. On either side of the 2-3% inflation "sweet spot" (where price-to-earnings ratios peak), rising and falling inflation rates both lead to declining valuations. In other words, on the left side of this valuation peak, stocks and bonds are negatively correlated (the "risk parity" zone), while on the right side, they are positively correlated. The change in correlation patterns requires significant adjustments in portfolio construction.
Since the 1980s, most of our investment experience has been in the "low" inflation zone, mostly hovering around and to the left of this valuation peak. This not only strongly supports a large allocation to stocks, but even small changes in inflation rates have proven it reasonable to hold bonds, as they are negatively correlated with stocks. [Note the divergence in stock and bond valuation lines.] This is particularly evident during economic weakness or even testing deflation. Japan's history has demonstrated what happens to stock and bond valuations in a "very low" inflation zone.
But this was not characteristic of the inflationary period of the 1970s. At that time, physical assets were in high demand, while financial assets performed poorly. The same chart shows the reason. On the right side of the valuation peak, around 2-3% inflation and above, both stock and bond valuations decline. Moreover, their declines are synchronous. This correlation weakens the rationale for holding both assets in a portfolio simultaneously. In fact, the opposite and positive performance of physical assets with inflation strengthens the case for their inclusion in portfolios.
Rising Monetary Inflation
Our recent research has primarily focused on the accumulation of monetary inflation risk, i.e., the government's deliberate devaluation of paper currency. [We hold a neutral stance on cost inflation.] The chart includes a rightward arrow as a reminder. In other words, the 60:40 asset allocation (or "risk parity" approach) is facing a serious threat. Looking ahead, what investors should now consider is reducing bond holdings and increasing physical assets.
Admittedly, the chart we plotted shows that the right tail of the bell curve for stock valuations is lower than the bond valuation line. Of course, this is not always the case. Unlike bond coupons, stock earnings and dividends may rise with inflation. The valuation trends of different stocks may vary, as some stocks are better at effectively hedging inflation, allowing their valuations to remain at relatively high levels. On the other hand, many companies struggle to maintain profitability in a high-inflation environment. However, we are discussing general cases here, not specific details.
Global bond yields are gradually rising. This is more driven by an increase in term premiums rather than higher policy rates. This suggests that the rise in yields may be caused by increased uncertainty regarding inflation and concerns that high government spending will lead to more coupon securities being issued.
Across the markets, we believe the U.S. currently faces greater inflation uncertainty, both due to its massive fiscal deficit and the increased expectations of "business taxes" resulting from tariffs. More importantly, the fiscal deficit is increasingly funded by short-term securities, which raises the risk of monetary inflation.
Japan has recently experienced rising inflation, primarily due to rising wage costs, but this follows decades of deflation and intermittent deflation. In other words, placing Japan in the above chart, its stock valuations may rise to the inflation rate of 2-3% "sweet spot." Clearly, at the current low levels, a 1.5% yield on Japanese government bonds (JGB) does not appear attractive.
China is currently in a deflationary phase following the "tariff shock," possibly at an earlier stage than Japan. The Chinese stock market is undervalued, but further monetary stimulus and a more robust economy could easily shift investor sentiment back to the stock market.
Meanwhile, according to inflation standards, European stock markets are close to the ideal "sweet spot," but they lie between the U.S. and Asian markets. In other words, if inflation continues to rise (we believe the world is heading towards stagflation), European stock market valuations are more likely to follow the U.S. and gradually be adjusted downwards.
Asset Allocation Conclusion
The 60:40 or "risk parity" model, long favored by wealth managers, faces severe challenges in a monetary inflation environment. We tend to reduce bond allocations or at least shift some bonds towards inflation-linked bonds (TIPS).
Portfolios should be tailored to investors, but as an example based on a 60:40 benchmark of financial assets, we prefer to strategically adjust the portfolio to 60:10:10:10:10. Here, 10% may be allocated to TIPS; 10% held in cash; 10% increased in gold and precious metals; and 10% invested in Bitcoin. We exclude dedicated physical assets, such as high-quality residential real estate and land, not because they are unattractive, but because they are less liquid and typically represent a permanent and non-tradable component of investor wealth.
A moderate rise in inflation may be beneficial for the stock market overall. We depicted nominal holdings across different markets in the above chart. It can be argued that due to inflation issues in the U.S. economy, Wall Street has "peaked." European inflation remains moderate, while China and Japan are emerging from a deflation/low-inflation environment, which favors bonds over stocks. It may be worth investing in these Asian markets, but caution is warranted due to their greater geopolitical risks.
免责声明:本文章仅代表作者个人观点,不代表本平台的立场和观点。本文章仅供信息分享,不构成对任何人的任何投资建议。用户与作者之间的任何争议,与本平台无关。如网页中刊载的文章或图片涉及侵权,请提供相关的权利证明和身份证明发送邮件到support@aicoin.com,本平台相关工作人员将会进行核查。


