The cryptocurrency market, in addition to new narratives, is also influenced by the US dollar monetary policy as a key factor in market trends. Especially with the gradual entry of BTC and ETH into the asset allocation of mainstream institutional investors through ETFs, the market's fund structure, attributes, and investment methods are undergoing significant changes, and cryptocurrencies are increasingly forming some kind of resonance or differentiation with other major asset classes such as US stocks, US bonds, and gold.
In recent times, the market has been repeatedly fluctuating between interest rate cut expectations, recession expectations, and election expectations, which essentially correspond to the interweaving and mutual influence of three factors: liquidity, fundamentals, and regulatory aspects. The most direct impact among these is the interest rate cut and interest rate cut expectations. To some extent, within a short period, interest rate cut expectations are more important in trading than the interest rate cut itself, so it is crucial to clarify the upcoming interest rate cut in the latter half of September.
1. Why cut: Tightening stems from high inflation, but interest rate cuts are more due to labor market slowdown
Leverage differentiation under high US inflation: The government leverages while residents deleverage, supporting the resilience of the US economy. There is not much disagreement in the market about the reasons for high inflation. The core reason is the overly aggressive fiscal policy in the US in recent years. The aggressive fiscal policy has injected a large amount of liquidity into the market, while on the one hand, the Fed has rapidly expanded its balance sheet, and the government deficit has significantly increased; on the other hand, the leverage of the household sector and non-financial corporate sector has not increased significantly, but has instead improved.
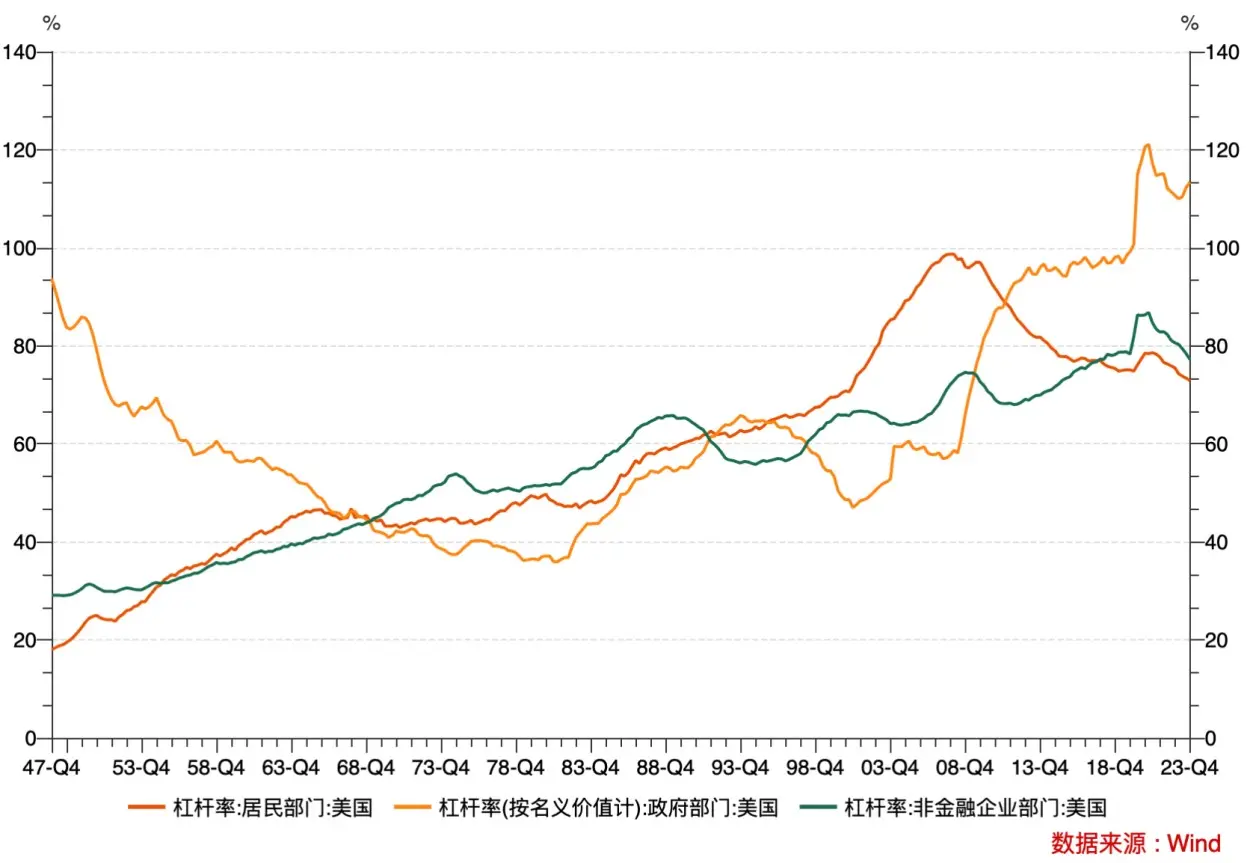
Chart: Differentiation of leverage ratios among the three major sectors in the US, with a decrease in household leverage
The differentiation in leverage ratios further explains that although the yield spread between the 10-year and 2-year US Treasury bonds, an indicator of the impending recession, has been inverted since July 2022, lasting a total of 26 months, the longest in history, until August this year, the slowdown in the labor market, driven by interest rate cut expectations, led to a decline in short-term interest rates, thereby eliminating the inversion, but the recession has not yet arrived.
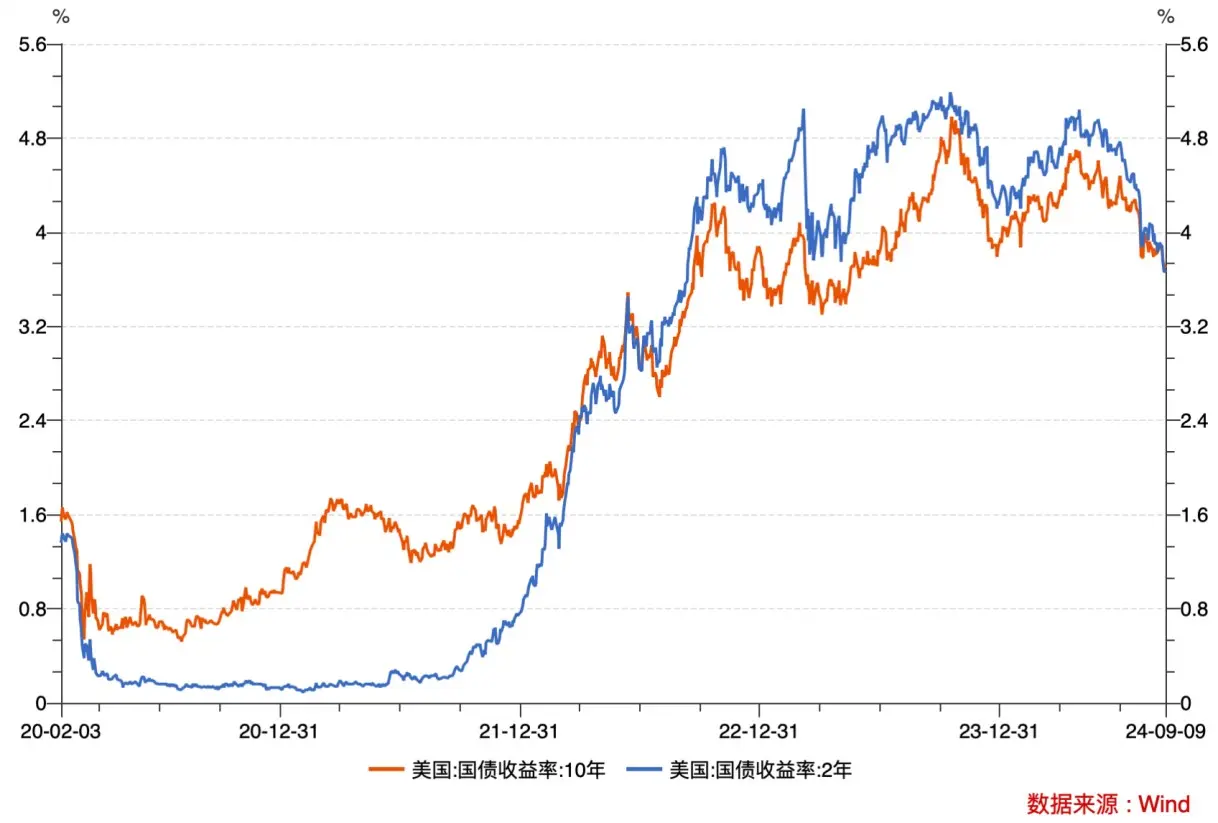
Chart: The degree of US Treasury yield inversion during this round of interest rate hikes is the longest in history, exacerbating market concerns
The data does not support a recession, but the slowdown in labor and deteriorating data quality has strengthened interest rate cut expectations and also raised concerns about a recession. In terms of inflation, the current PCE (2.5%) and core PCE (2.6%) have not reached the Fed's target of 2%, but traders on Wall Street generally expect the Fed to cut interest rates in September. In addition to Powell and Fed officials continuing to send dovish signals to the market, another important background is the change in the Fed's monetary policy framework for 2020, where the original inflation target regime has been changed to an average inflation target regime. Meanwhile, although employment and inflation remain the Fed's main dual targets, employment and the labor market have significantly moved up in priority. In other words, the Fed is more inclined to tolerate short-term high inflation in order to ensure the stability of the labor market.
The change in the monetary framework is further reflected in each FOMC meeting and the management of market expectations. Each release of data such as non-farm payrolls and the unemployment rate has repeatedly caused market fluctuations, with high volatility in risk assets such as US stocks and cryptocurrencies. The current market is highly sensitive, and in addition to the game of interest rate cut expectations, there is also a growing concern about a recession, particularly regarding the sustainability of the AI narrative represented by companies like NVIDIA.
From a data perspective, the current US economy has not fallen into a recession, but the slowdown is faster than expected, and the quality of employment is not high. There are various opinions on the judgment of a recession, but a simple and effective indicator is the "Sam Rule," which is defined as when the three-month moving average of the US unemployment rate rises by 0.5 percentage points or more from the low point of the past twelve months, it means that the US has entered the early stage of an economic recession. According to this indicator, the US has been in a recession since July of this year (the recession indicator under the Sam Rule was 0.53% in July and 0.57% in August), but mainstream institutions including the Fed do not believe that the US has already entered a recession.
Observing from a more authoritative NBER recession indicator, currently, whether it is GDP, employment, industrial production, etc., there has been a slight retreat, with a 3-year retreat of less than 2%, far below the 5%-10% level seen in historical recession periods.
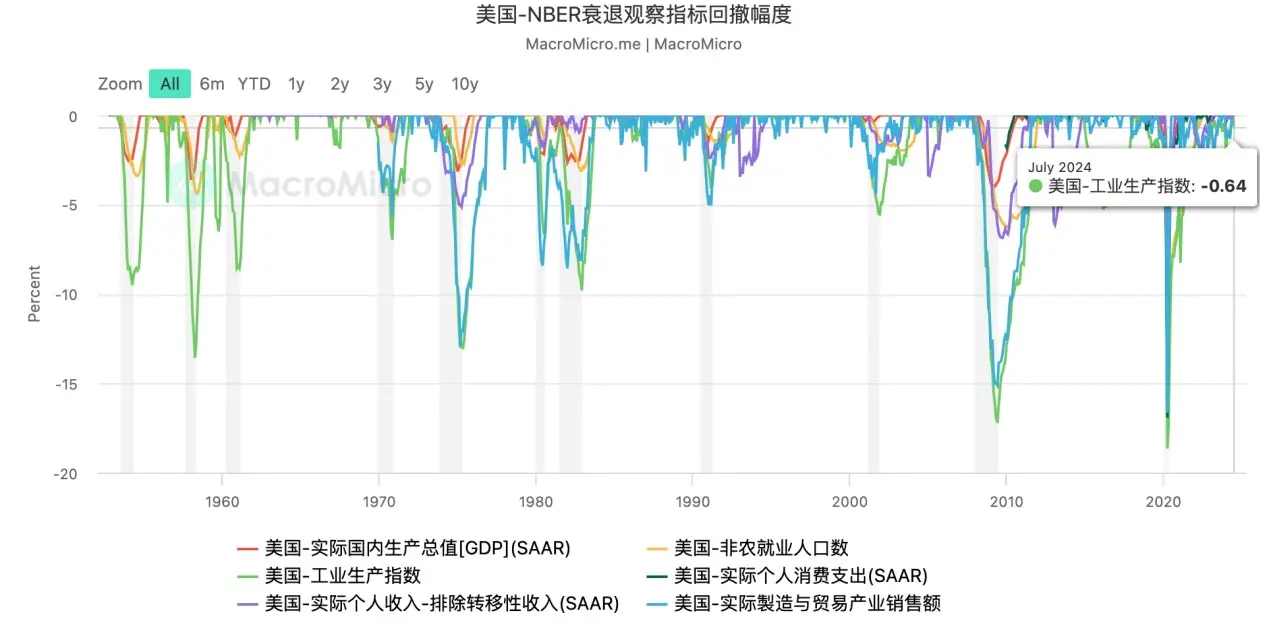
Chart: NBER recession indicator is still some distance away from the recession zone
The pressure of the labor market slowdown is greater. The most crucial indicator in US employment data is the NFP data (non-farm payroll data) released by the US Bureau of Labor Statistics (BLS). Looking at the sub-item data for the past three months, the manufacturing data has had a significant drag, mainly supported by the service industry and the government sector. In addition, the US Department of Labor has also revised down the previous data in August and September, with the magnitude of the downward revision surprising the market. According to the revised data, the average new non-farm payrolls from January 2024 to August 2024 was only 149,000, significantly lower than the 175,000 average in 2019.
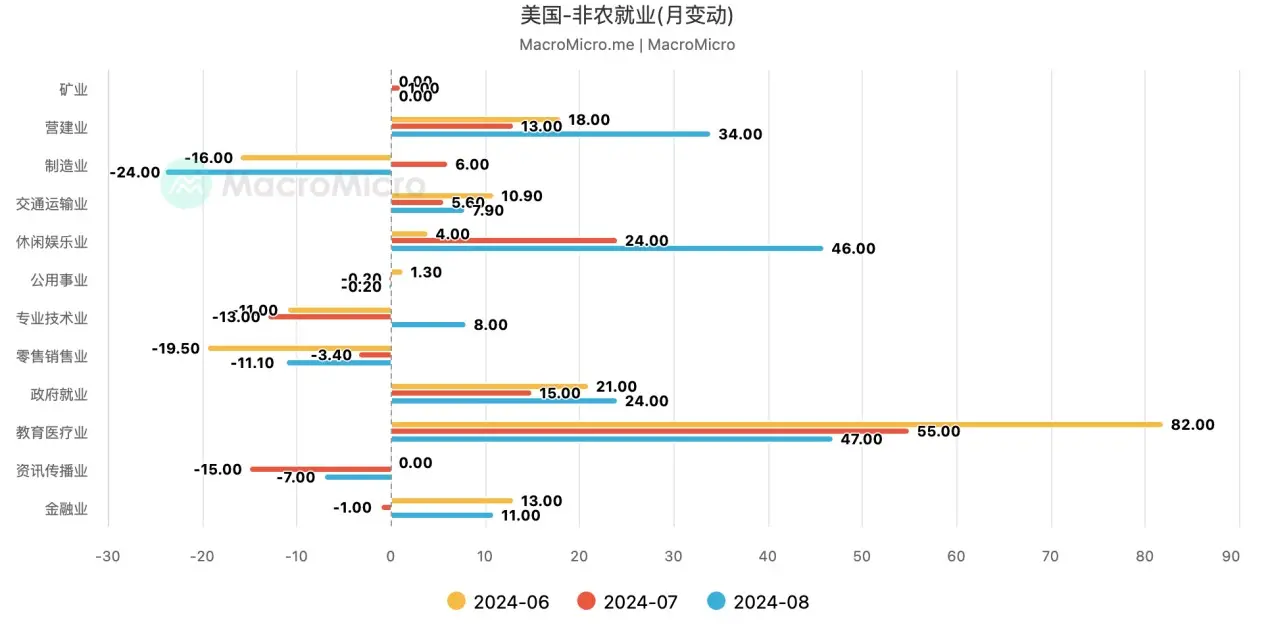
Chart: Significant slowdown in non-farm employment over the past three months
Furthermore, looking at the types of employment, there has been a clear differentiation between full-time and part-time employment. Full-time positions in the US have continued to decrease both month-on-month and year-on-year, while part-time positions have increased in both comparisons. The increase in part-time positions to some extent masks the overall decline in quantity, but it also reveals that the quality of employment data is not high.
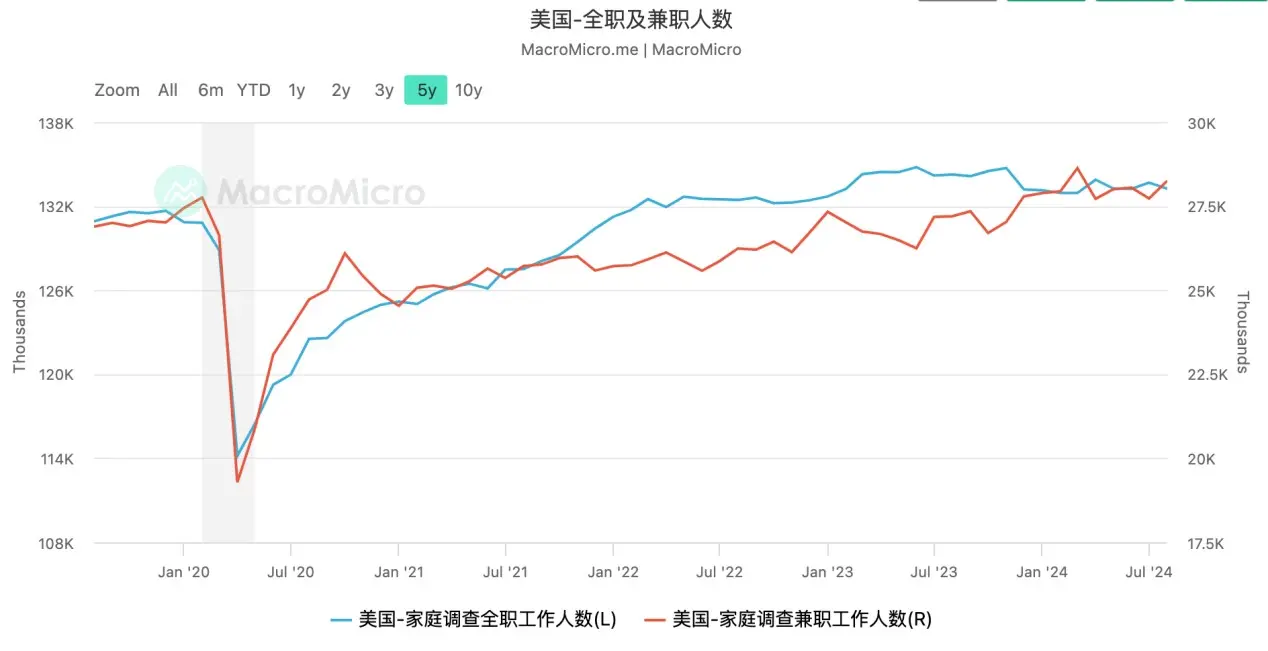
Chart: Changes in the number of full-time and part-time workers in the US indicate low quality of employment data
In terms of the unemployment rate, with the labor force participation rate remaining stable, the unemployment rate has risen to 4.3%, but has since fallen, and the Sam Rule index continues to rise. Of particular note in the unemployment rate data is the U6 unemployment rate (a broader measure of unemployment, closer to the true unemployment rate across the entire market), which has risen to 7.9%, the highest level since the pandemic. In addition, looking at job vacancies, the unexpected decline in job vacancies and the continuous decline in the vacancy rate are also noteworthy.
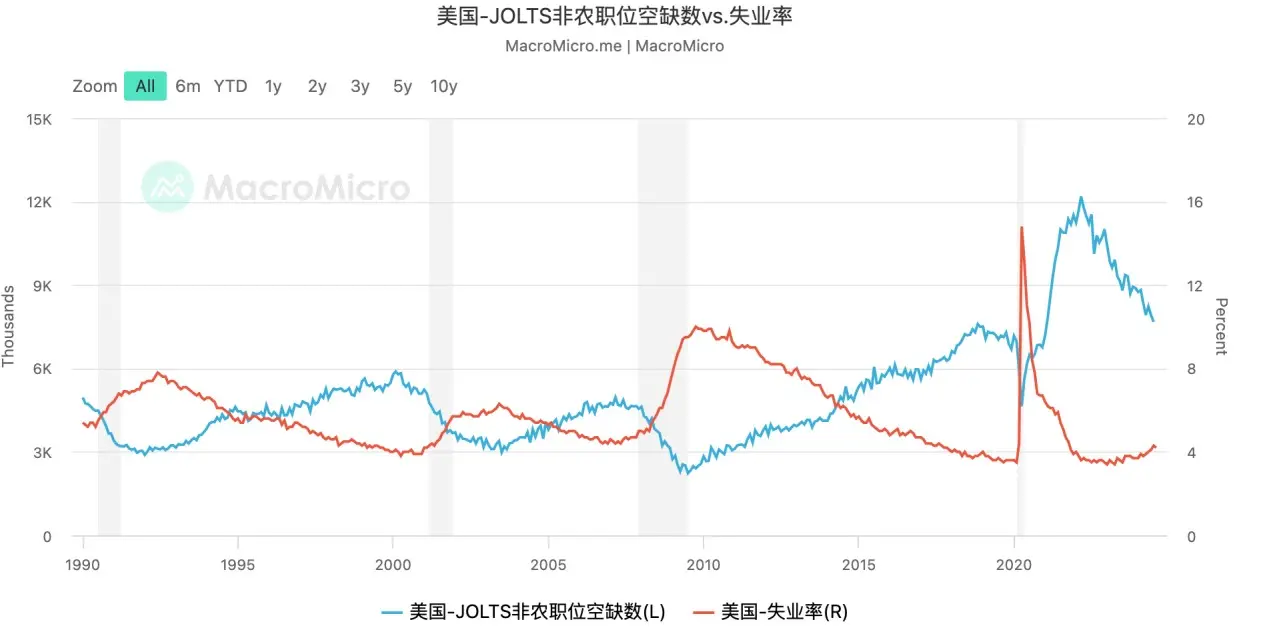
Chart: Continuous decline in the number of non-farm job vacancies according to JOTS
The cooling of the job market for two consecutive months, combined with the downward revision of previous employment data, has significantly strengthened interest rate cut expectations in the market, with the focus solely on a cut of 25bp/50bp; at the same time, concerns about a recession are beginning to heat up.
2. How to cut: The market's game with the Fed, but data remains key
After the release of the non-farm payroll data on September 6, the market's performance vividly demonstrated the mixed nature of the data and the divergence of market consensus; risk assets fluctuated, but ultimately ended up weak. On the evening of September 11, the CPI data for August was released, and although the year-on-year rate fell to 2.5%, lower than expected, the month-on-month increase in core CPI was 0.3%, higher than market expectations. Overall, inflation has continued its previous structural differentiation, with commodities, food, and energy continuing to decline, while services still exhibit strong stickiness. After the data was released, the market's expectation of a 50bp interest rate cut decreased significantly, and the stickiness of service inflation indirectly indicates that there is currently no risk of a recession.
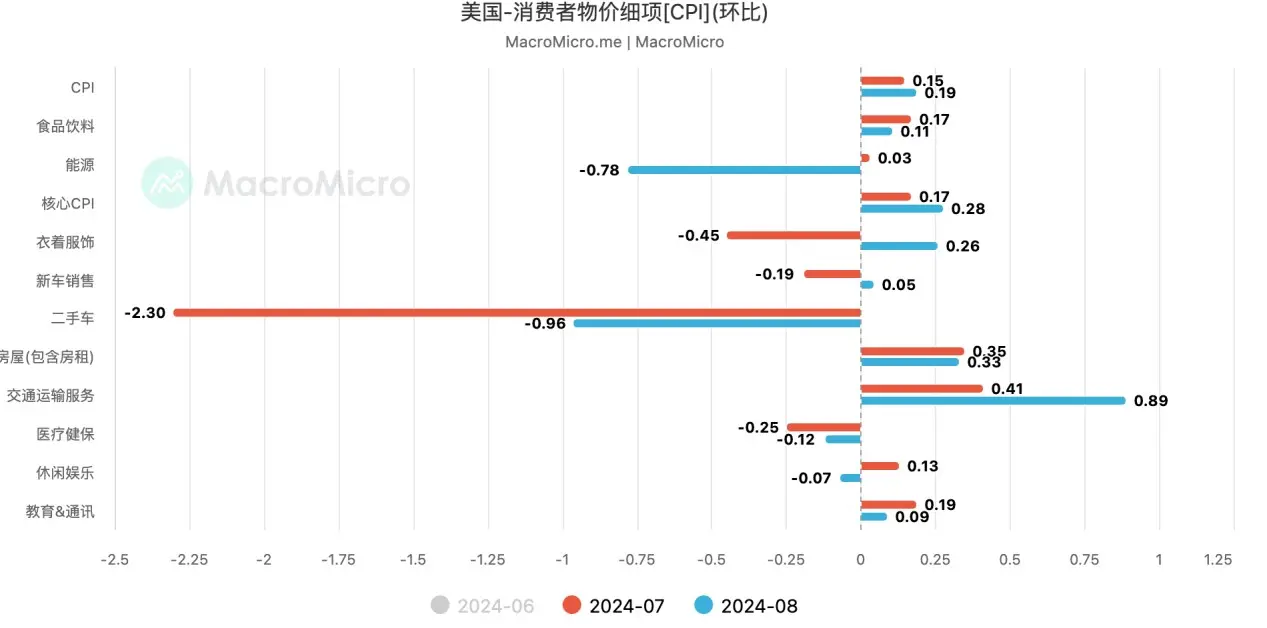
Chart: Sub-item data for CPI in July-August reveals that inflation stickiness remains high, with a declining rate of decline
Concerns about a recession persist in the market, and combined with the decline in inflation, the intertwining of these two factors has made the market "entangled" about interest rate cuts. The main reason is that the current market consensus is unable to unify and is full of contradictions. If the interest rate is cut by 25bp, on the one hand, the pricing has already been quite sufficient, and the boost to risk assets is limited, and it also cannot completely reverse the market's concerns about a recession; if the interest rate is cut by 50bp, then the market's concerns about a recession will significantly increase, which in turn will constrain the boost to risk assets. In either case, the direct impact on the market is a significant increase in the sensitivity of risk assets.
From the perspective of the Federal Reserve, fundamentally, its regulatory methods mainly consist of managing market expectations and managing monetary policy. The former relies on rhetoric, while the latter relies on actual policy tools. Currently, although the Fed has not implemented substantial interest rate cuts, continuous rhetoric from officials including Powell has already created loose expectations in the market. Both the US Treasury bond yields and domestic credit rates have already responded in advance and formed substantial looseness.
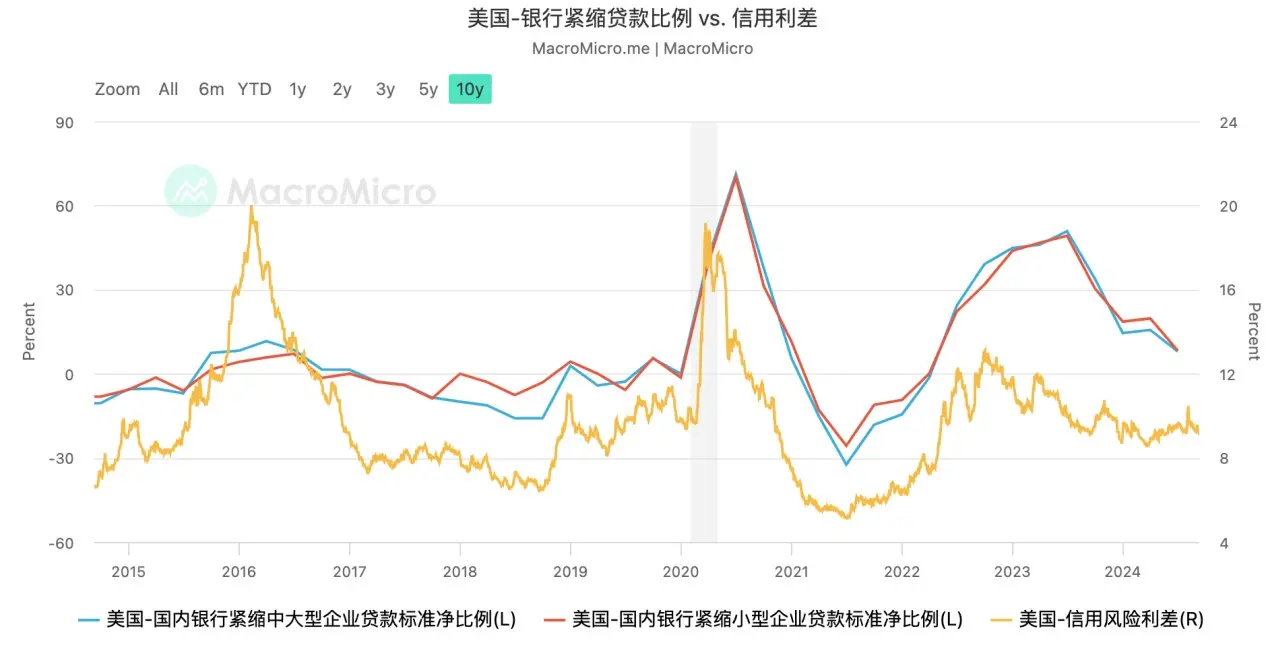
Chart: Decrease in the proportion of credit tightening by US banks and narrowing of credit risk spreads
Taking the above chart as an example, the proportion of credit tightening by US banks has significantly decreased, and credit risk spreads have been consistently declining since August 5, indicating a clear loose trend in the market.
Based on the current slowing pace of inflation decline, the unexpected slowdown in the labor market, and the substantial loose environment, the possibility of a 50bp cut starting on September 18 has decreased, and the probability of a preventive 25bp interest rate cut has increased. Furthermore, without clear data proving that a recession has arrived or that inflation has significantly declined beyond expectations, a soft landing is still the benchmark scenario for current trading. The market will continue to fluctuate amid data fluctuations related to recession, interest rate cuts, and the election.
3. What are the impacts: Boost in cryptocurrency risk appetite, but adjustments are inevitable
Even though there is a general expectation that the FOMC meeting on September 18 will initiate an interest rate cut cycle, risk assets may not immediately show an upward trend, especially since the listing of Bitcoin and Ethereum ETFs in the US and Hong Kong since 2024 has both made mainstream funds begin to allocate to cryptocurrency assets and weakened the independent market of cryptocurrency assets. Cryptocurrency assets are greatly influenced by major asset class fluctuations such as US stocks and US bonds. In terms of the transmission of interest rate cuts, the direct impact is on the risk-free government bond market, which then affects risk assets (MAGA7, Russell 2000, S&P 500, and cryptocurrency assets).
Historically, during periods of transition, increased asset volatility is normal, mainly due to the game of expectation differentials. When the market prices in advance, any change in data will affect the effectiveness of pricing, thereby affecting the rise and fall of assets.
In terms of different types of interest rate cuts, preventive interest rate cuts in the past usually led to a response from risk assets of a decline followed by a bottoming out, and then a recovery (while if it is a relief interest rate cut, the probability of asset decline is usually higher), and the bottoming out usually takes about a month.
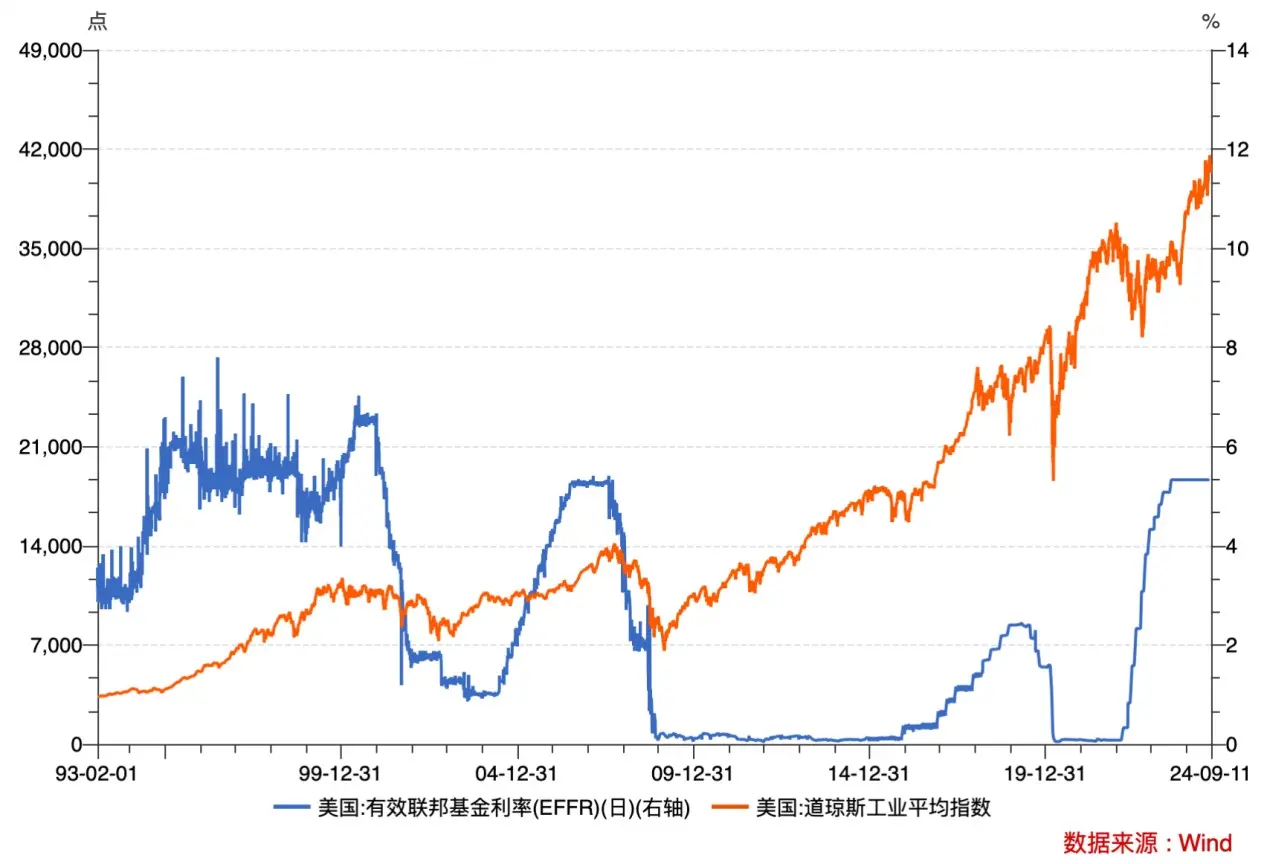
Chart: Risk assets typically decline before rising in response to preventive interest rate cuts
For cryptocurrency assets, as high-risk assets, they are becoming increasingly closely linked with US stocks. In a scenario of a confirmed interest rate cut and a soft landing, the market's risk appetite should gradually increase. However, as analyzed earlier, the market is currently in a stage of divergence before forming a new consensus, and fluctuations are inevitable, whether in US stocks or cryptocurrency assets.
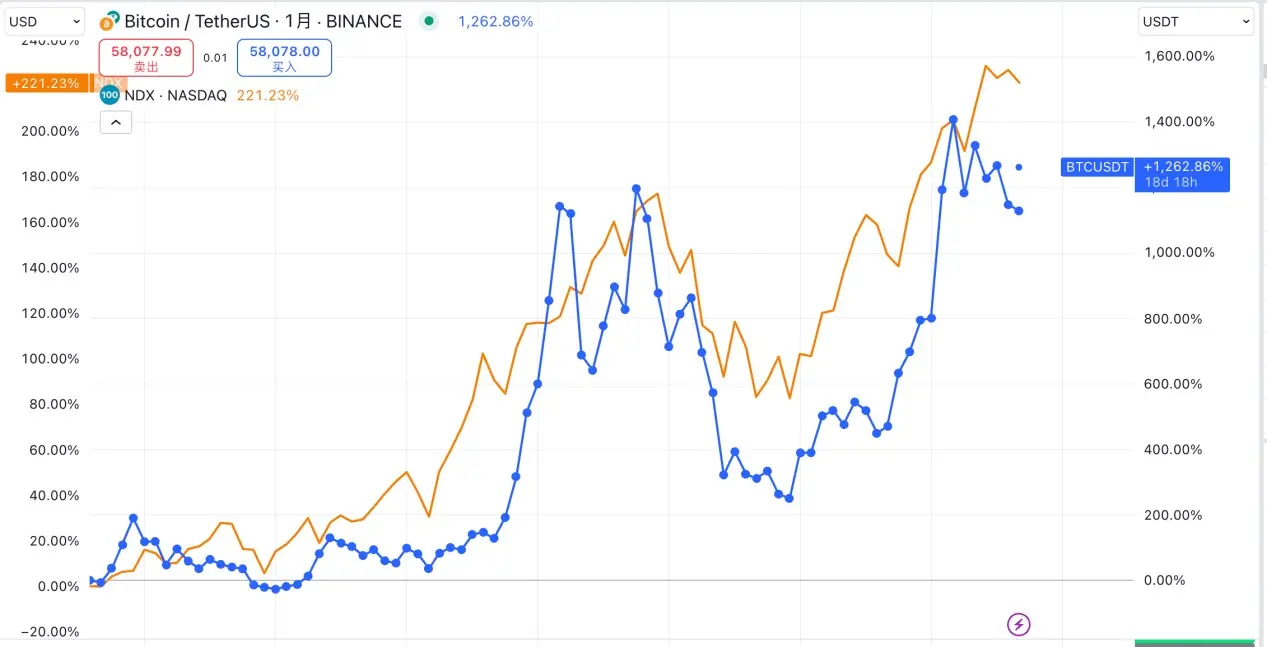
Chart: Highly consistent direction of fluctuations between cryptocurrency assets and US stocks
From a long-term perspective, the probability of an increase in cryptocurrency assets is still high, but in the next month, fluctuations will continue to closely follow US stocks, maintaining volatility, especially before and after the interest rate cut, when fluctuations may further increase. In addition, it is still worth noting the impact of the US election, as the election results directly affect the government, including the SEC's attitude towards cryptocurrencies, which will in turn have an impact on the market.
免责声明:本文章仅代表作者个人观点,不代表本平台的立场和观点。本文章仅供信息分享,不构成对任何人的任何投资建议。用户与作者之间的任何争议,与本平台无关。如网页中刊载的文章或图片涉及侵权,请提供相关的权利证明和身份证明发送邮件到support@aicoin.com,本平台相关工作人员将会进行核查。


