OKX pays attention to every user feedback and values every user experience.
Users' fingertips wander on the phone screen, and their demands for trading tools are constantly changing.
For example, personalized tools tailored to individual needs, automated tools based on AI and big data, real-time trading tools with low thresholds, and security tools with transparency, etc. In the digital age, the evolution of trading tools is profoundly impacting the landscape and future of the cryptocurrency industry.
Creating simple, beautiful, secure, and user-friendly products while continuously meeting the diverse needs of users and providing a smooth experience has become an important direction for product innovation at the leading Web3 technology company OKX. A smooth user experience depends on OKX's deep understanding of user needs and careful attention to product details. From CEX to Wallet, OKX pays attention to every user feedback and values every user experience. By listening to user feedback and continuously improving the product experience, OKX is driving continuous innovation and aiming to create outstanding products and experiences for users.
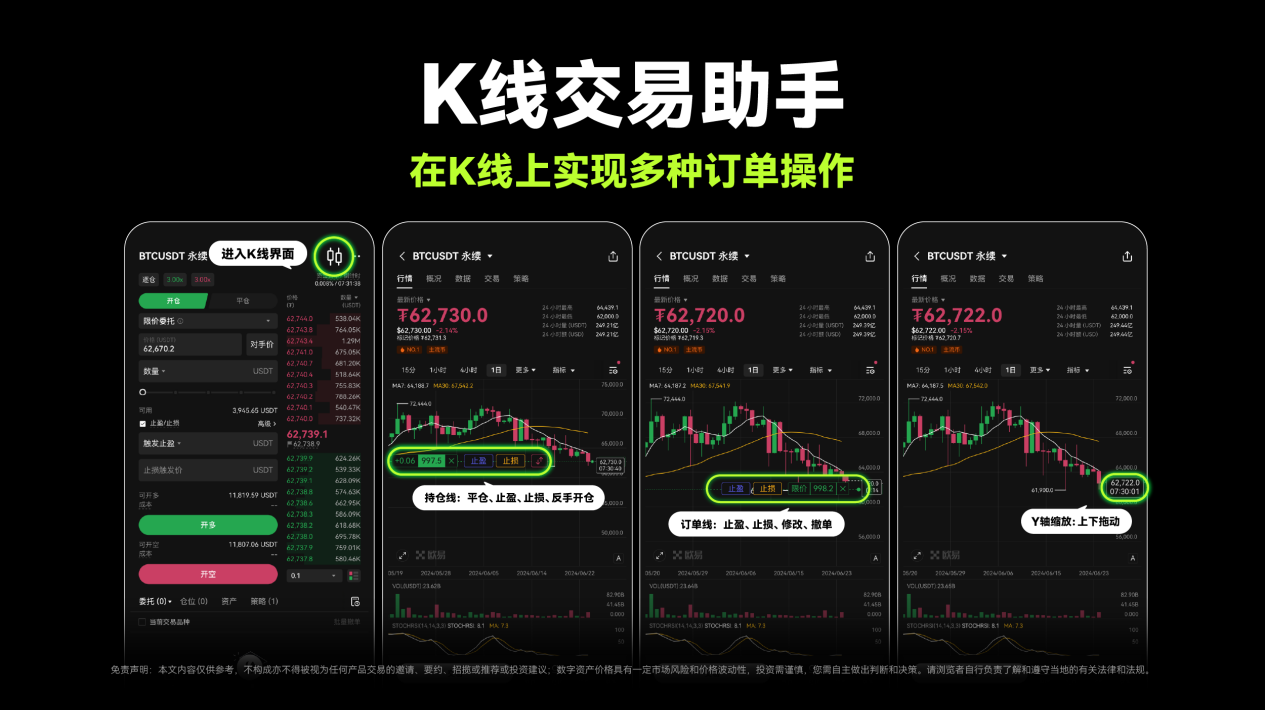
Recently, OKX has upgraded its candlestick chart function and officially launched the "Candlestick Trading Assistant," which supports users in conducting precise analysis using drawing tools and data indicators on the candlestick chart, as well as facilitating convenient operations for managing orders and positions, thereby optimizing trading efficiency and strategies. As an important and practical trading tool, OKX's "Candlestick Trading Assistant" will help users respond more calmly to market fluctuations.
OKX is one of the first exchanges in the industry to provide a smooth candlestick trading assistant on the APP mobile end. This article will delve into the core highlights, usage strategies, usage scenarios, and underlying technology of OKX's "Candlestick Trading Assistant," helping users quickly understand and use this tool.
Common Scenarios & Tool Highlights
Alice is a short-term trader. On a highly volatile trading day, she identified a good buying and selling opportunity. However, due to a delay when switching between the candlestick chart and the trading page, she missed an important buying point, resulting in a potential loss of 10% in her trades.
Bob is a novice trader. He calculated the stop-loss position based on the candlestick chart, but when switching to the trading page to set the stop-loss order, the operation was interrupted due to a smooth transition, causing him to fail to set the stop-loss in time. When the market reversed, his account suffered significant losses.
Charlie is a contract trader who needs to frequently view the candlestick chart and place orders for day trading. The long-term high-pressure environment caused him to make a mistake in a critical operation, turning a sell order into a buy order, resulting in avoidable losses.
David is an ordinary trader who, after observing the candlestick chart, believed that the market was about to reverse. He then switched to the trading page to prepare to close the position, but the candlestick chart did not update in time during the switching process. He made a decision based on outdated information, resulting in losses.
These cases reflect that in the 24/7 continuous trading environment of the cryptocurrency market, the candlestick chart provides a clear market price trend and becomes an important reference indicator for many users who rely heavily on candlesticks and technical indicators in trading. However, due to issues such as the transition steps between the candlestick chart and the trading page, these users need a more optimized trading experience.
Through the "Candlestick Trading Assistant" feature, OKX seamlessly integrates the trading decision-making process into the operation interface of the candlestick chart, allowing users to assist in trading in real-time while browsing the candlestick chart. By directly clicking on key positions on the candlestick chart, users can set orders and manage positions, without the need to constantly switch between the candlestick chart and the order placement interface, further simplifying the operation process, improving trading efficiency and experience, and helping users respond to market changes more quickly.
For example, based on OKX's "Candlestick Trading Assistant," users can directly modify trading orders based on the candlestick chart. Additionally, OKX's "Candlestick Trading Assistant" now exclusively supports closing positions and opening reverse positions on the holding line, as well as Y-axis zooming view operations, allowing users to quickly adjust order positions based on market trends. With a clean interface and smooth operation, it brings users a better and smoother trading experience.
Tool Analysis & Usage Strategy
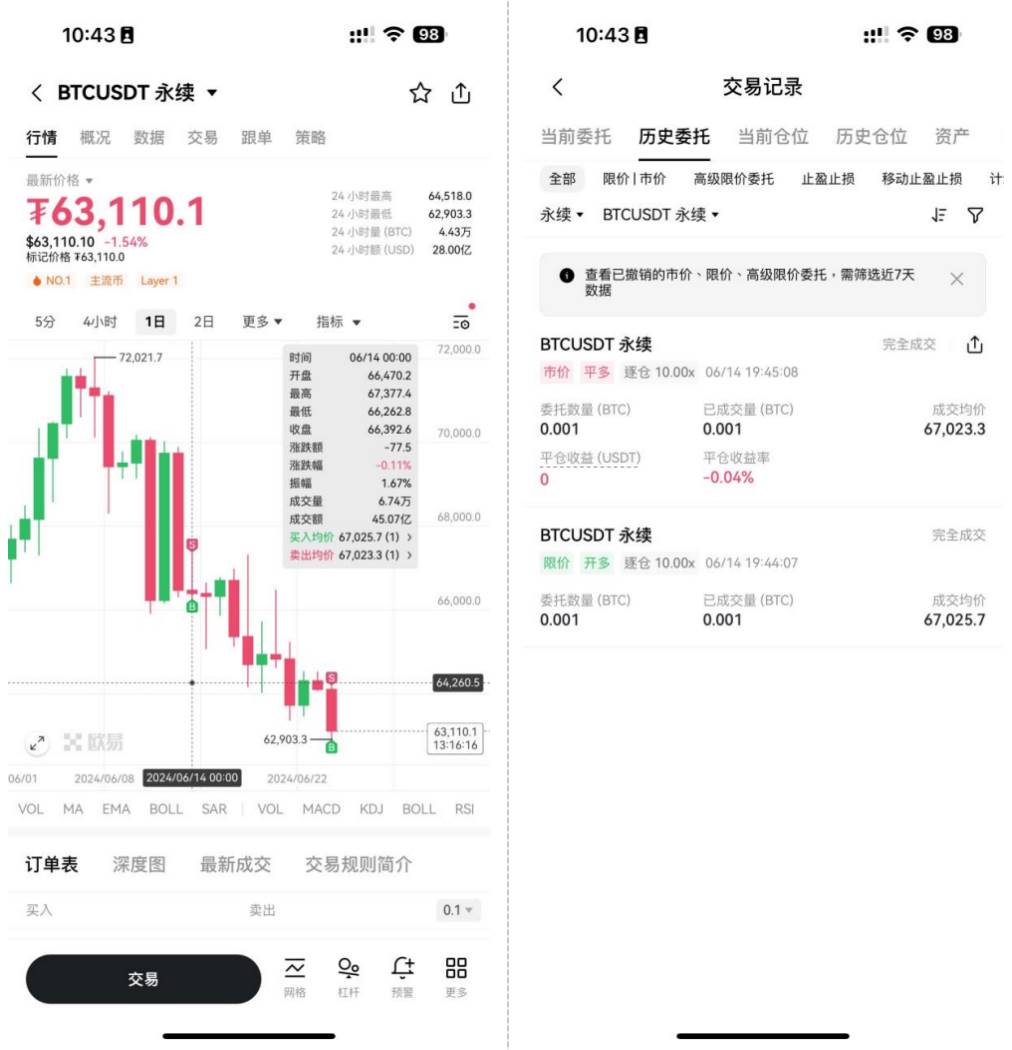
After placing an order, users can click the button in the upper right corner to switch to the candlestick interface and perform various order operations on the candlestick chart.
Specifically, OKX's "Candlestick Trading Assistant" mainly covers two core functions: candlestick analysis and candlestick trading.
(I) Candlestick Trading
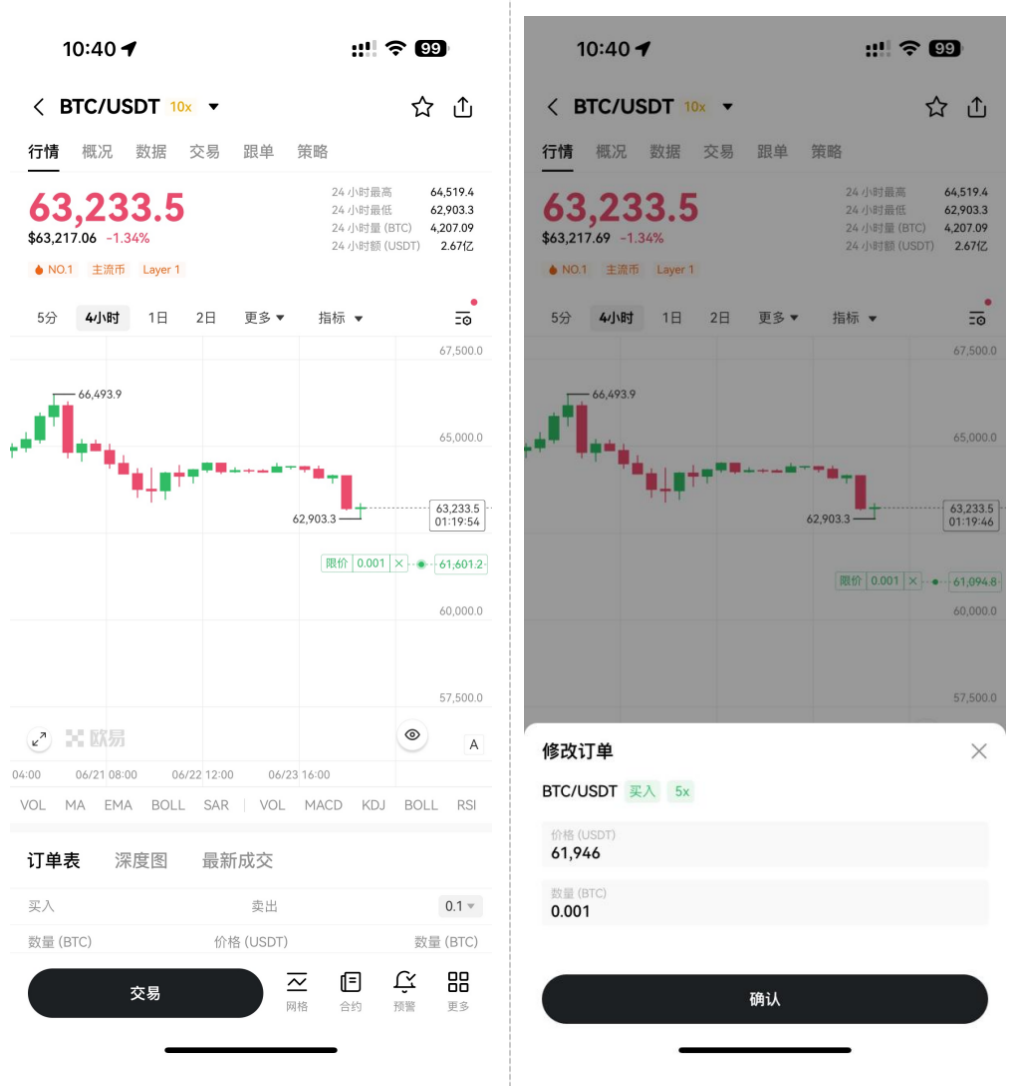
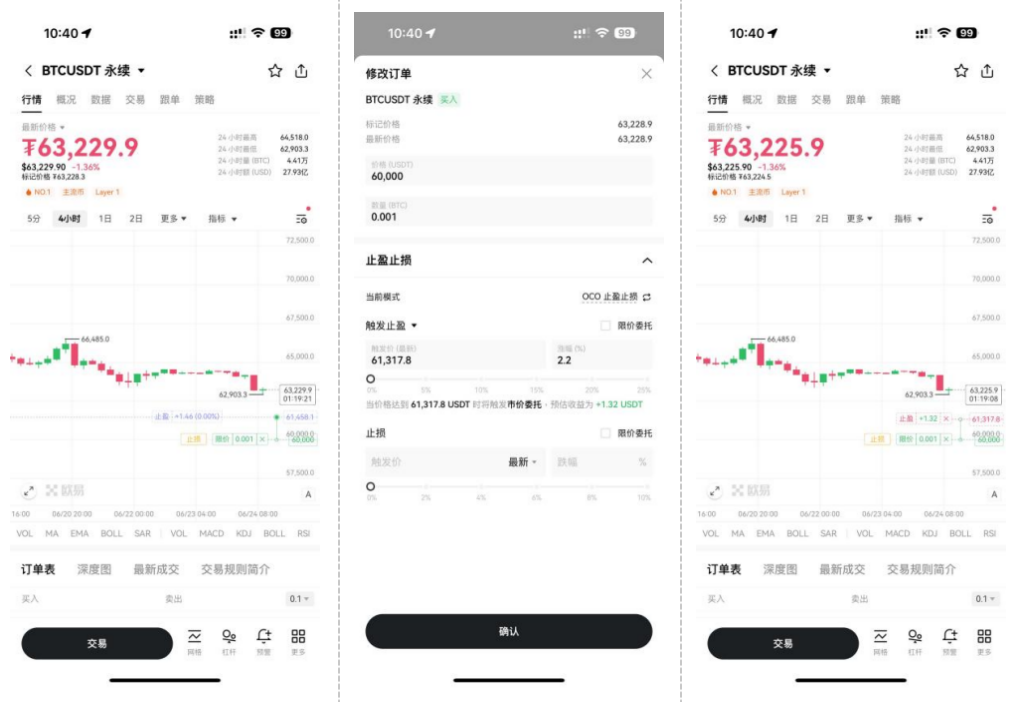
First, Order Line
Supports modifying order price or quantity. Users can drag the order line to the specified price level on the OKX candlestick chart interface to modify the order price or quantity. After dragging the order line, a "Modify Order" pop-up window will automatically appear, allowing users to change the price or quantity of the order. After clicking the "Confirm" button, the order modification will be completed.
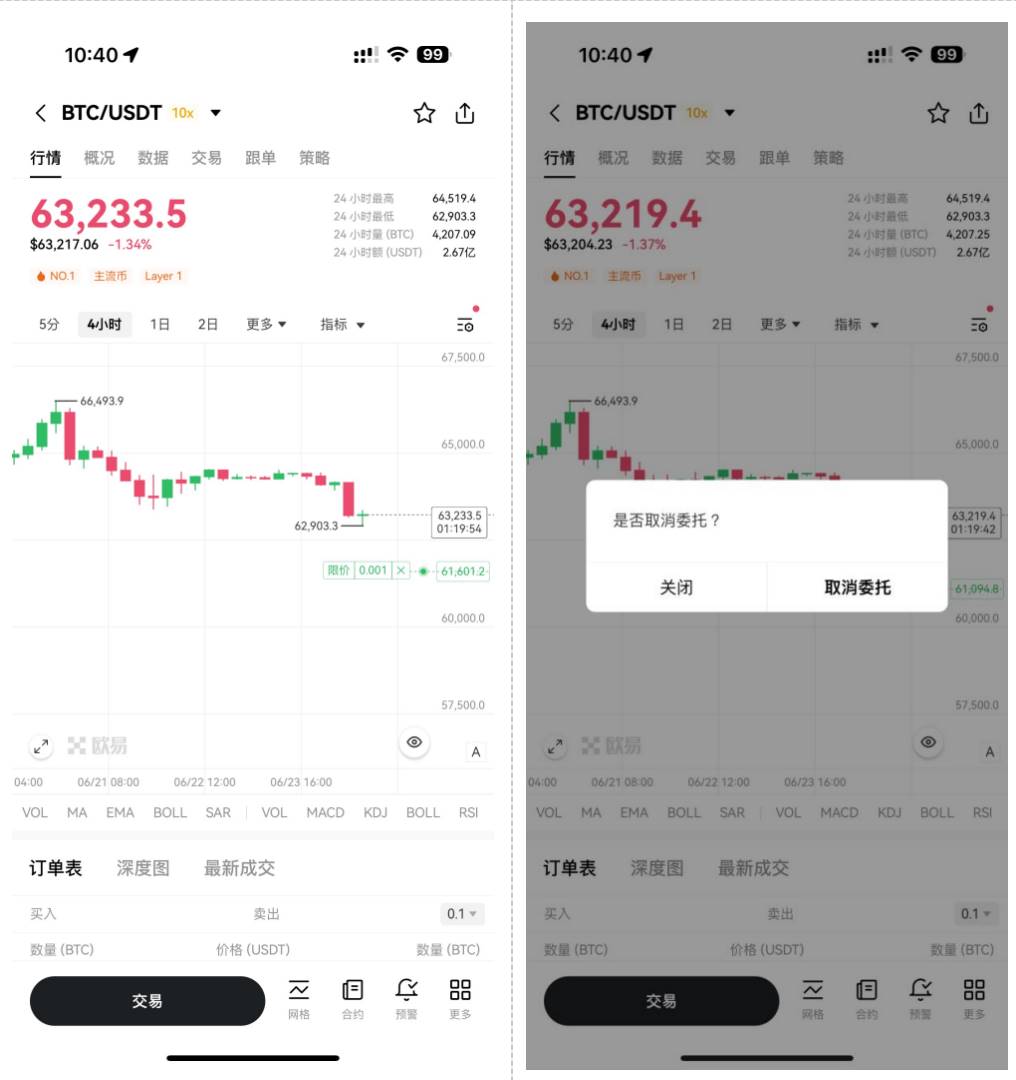
Supports canceling orders. In focus mode, users can click on the order line to see a "Cancel" button. After clicking this button, the system will prompt the user to confirm the cancellation of the order. Once confirmed, the cancellation request will be executed, and the corresponding order line will be removed from the chart.
Setting or modifying take profit and stop-loss orders. Users can set take profit and stop-loss orders (TPSL) through the order line. When dragging the take profit (TP) or stop-loss (SL) buttons to the desired price level, a "Modify Order" pop-up window will appear, allowing users to precisely adjust the price or quantity of the take profit/stop-loss. Once confirmed, the take profit or stop-loss order will be placed. For user convenience, the expected profit and loss (P&L) will be directly displayed on the TPSL line. Additionally, users can modify or cancel any existing take profit and stop-loss orders.
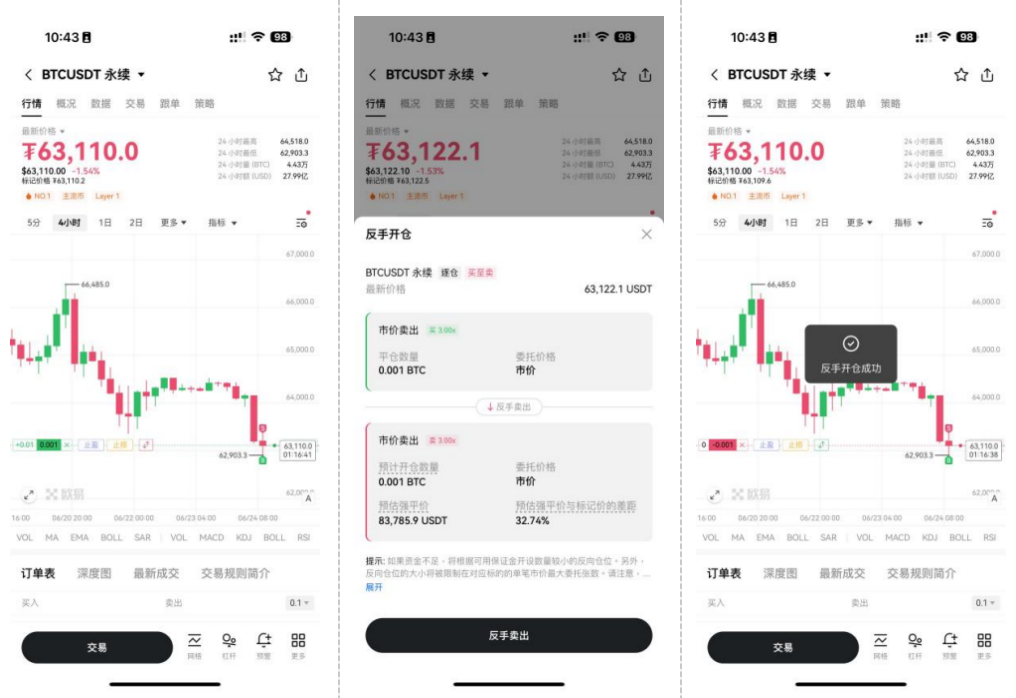
Second, Holding Line
Supports reverse position holding. Contract users can quickly switch to a reverse position by clicking the [↑↓] reverse button on the holding line. After clicking [↑↓], the system will pop up a confirmation window containing details of the reverse position. Once confirmed by the user, the system will execute the reverse request, and the holding line will reflect the new position and display the corresponding color.
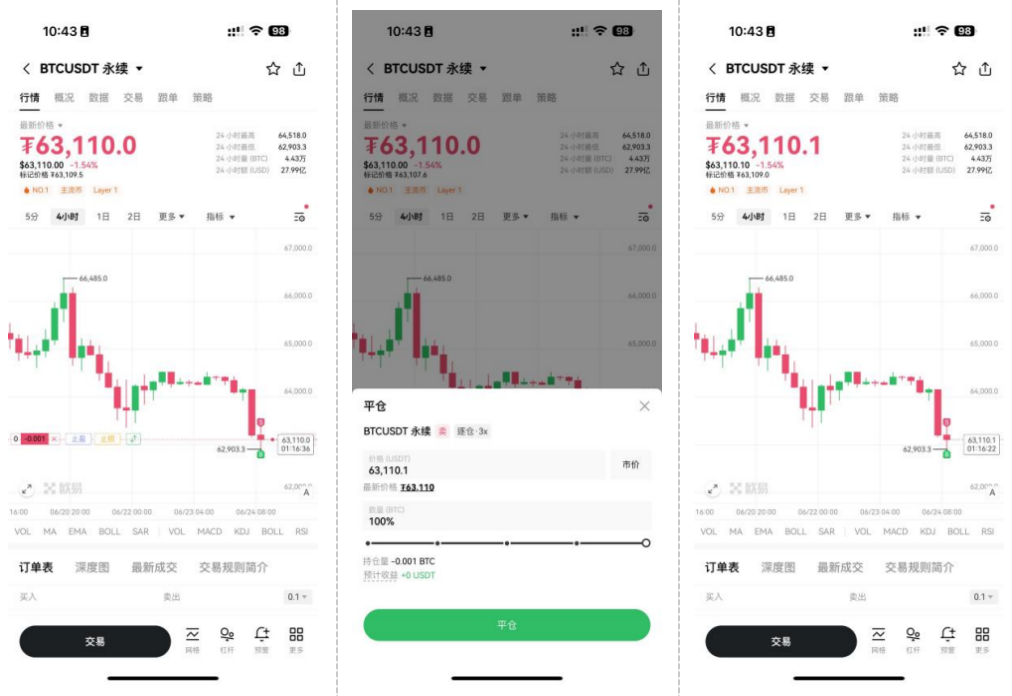
Real-time closing of positions. In focus mode, users will see an [x] close button. After clicking the [x] button, the system will pop up a confirmation window, allowing users to set the closing price and quantity. Once confirmed, the closing request will be executed. If it is a complete closing, the corresponding holding line will be removed from the chart.
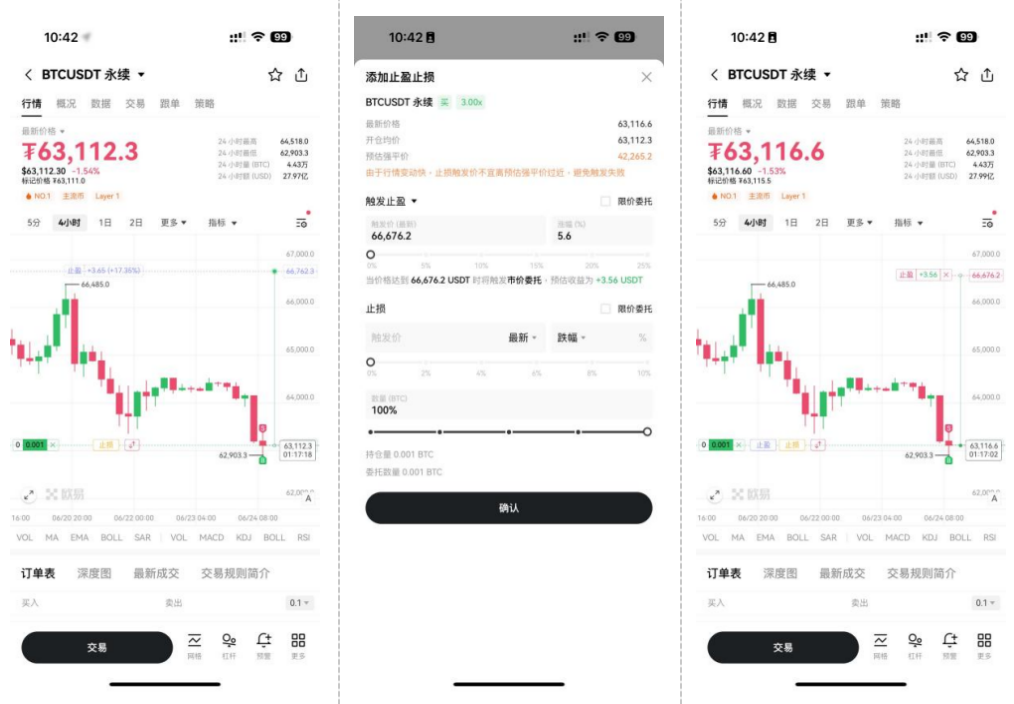
Take profit and stop-loss for positions (TPSL). Users can directly set take profit and stop-loss orders (TPSL) from the holding line. By dragging the take profit (TP) or stop-loss (SL) buttons to the corresponding price level, users can dynamically view the expected profit and loss (PnL). Once the take profit or stop-loss is set, the expected profit and loss will be directly reflected on the TP/SL line, and any order modifications affecting the profit and loss will also be updated on the line. Users can also directly modify or cancel take profit and stop-loss orders for positions.
Third, Trade History Tracker
Trade History Tracker. Supports allowing users to directly view trade history on the candlestick chart. Additionally, OKX also provides a one-click access to the order history page, helping users obtain more detailed historical order information.
Fourth, User Settings and Customization
Always visible holding line switch. OKX's candlestick chart supports the holding line to always be visible. For example, even if the user's entry price exceeds the Y-axis price range, the holding line will remain visible within the chart. Therefore, when the user clicks on the holding line, it will return to the Y-axis range, making it convenient for users to safely set take profit and stop-loss (TPSL).

Close holding line. If the user selects the "Show all holdings" option in the settings, the holding line will not be visible when the user's entry price exceeds the Y-axis price range.
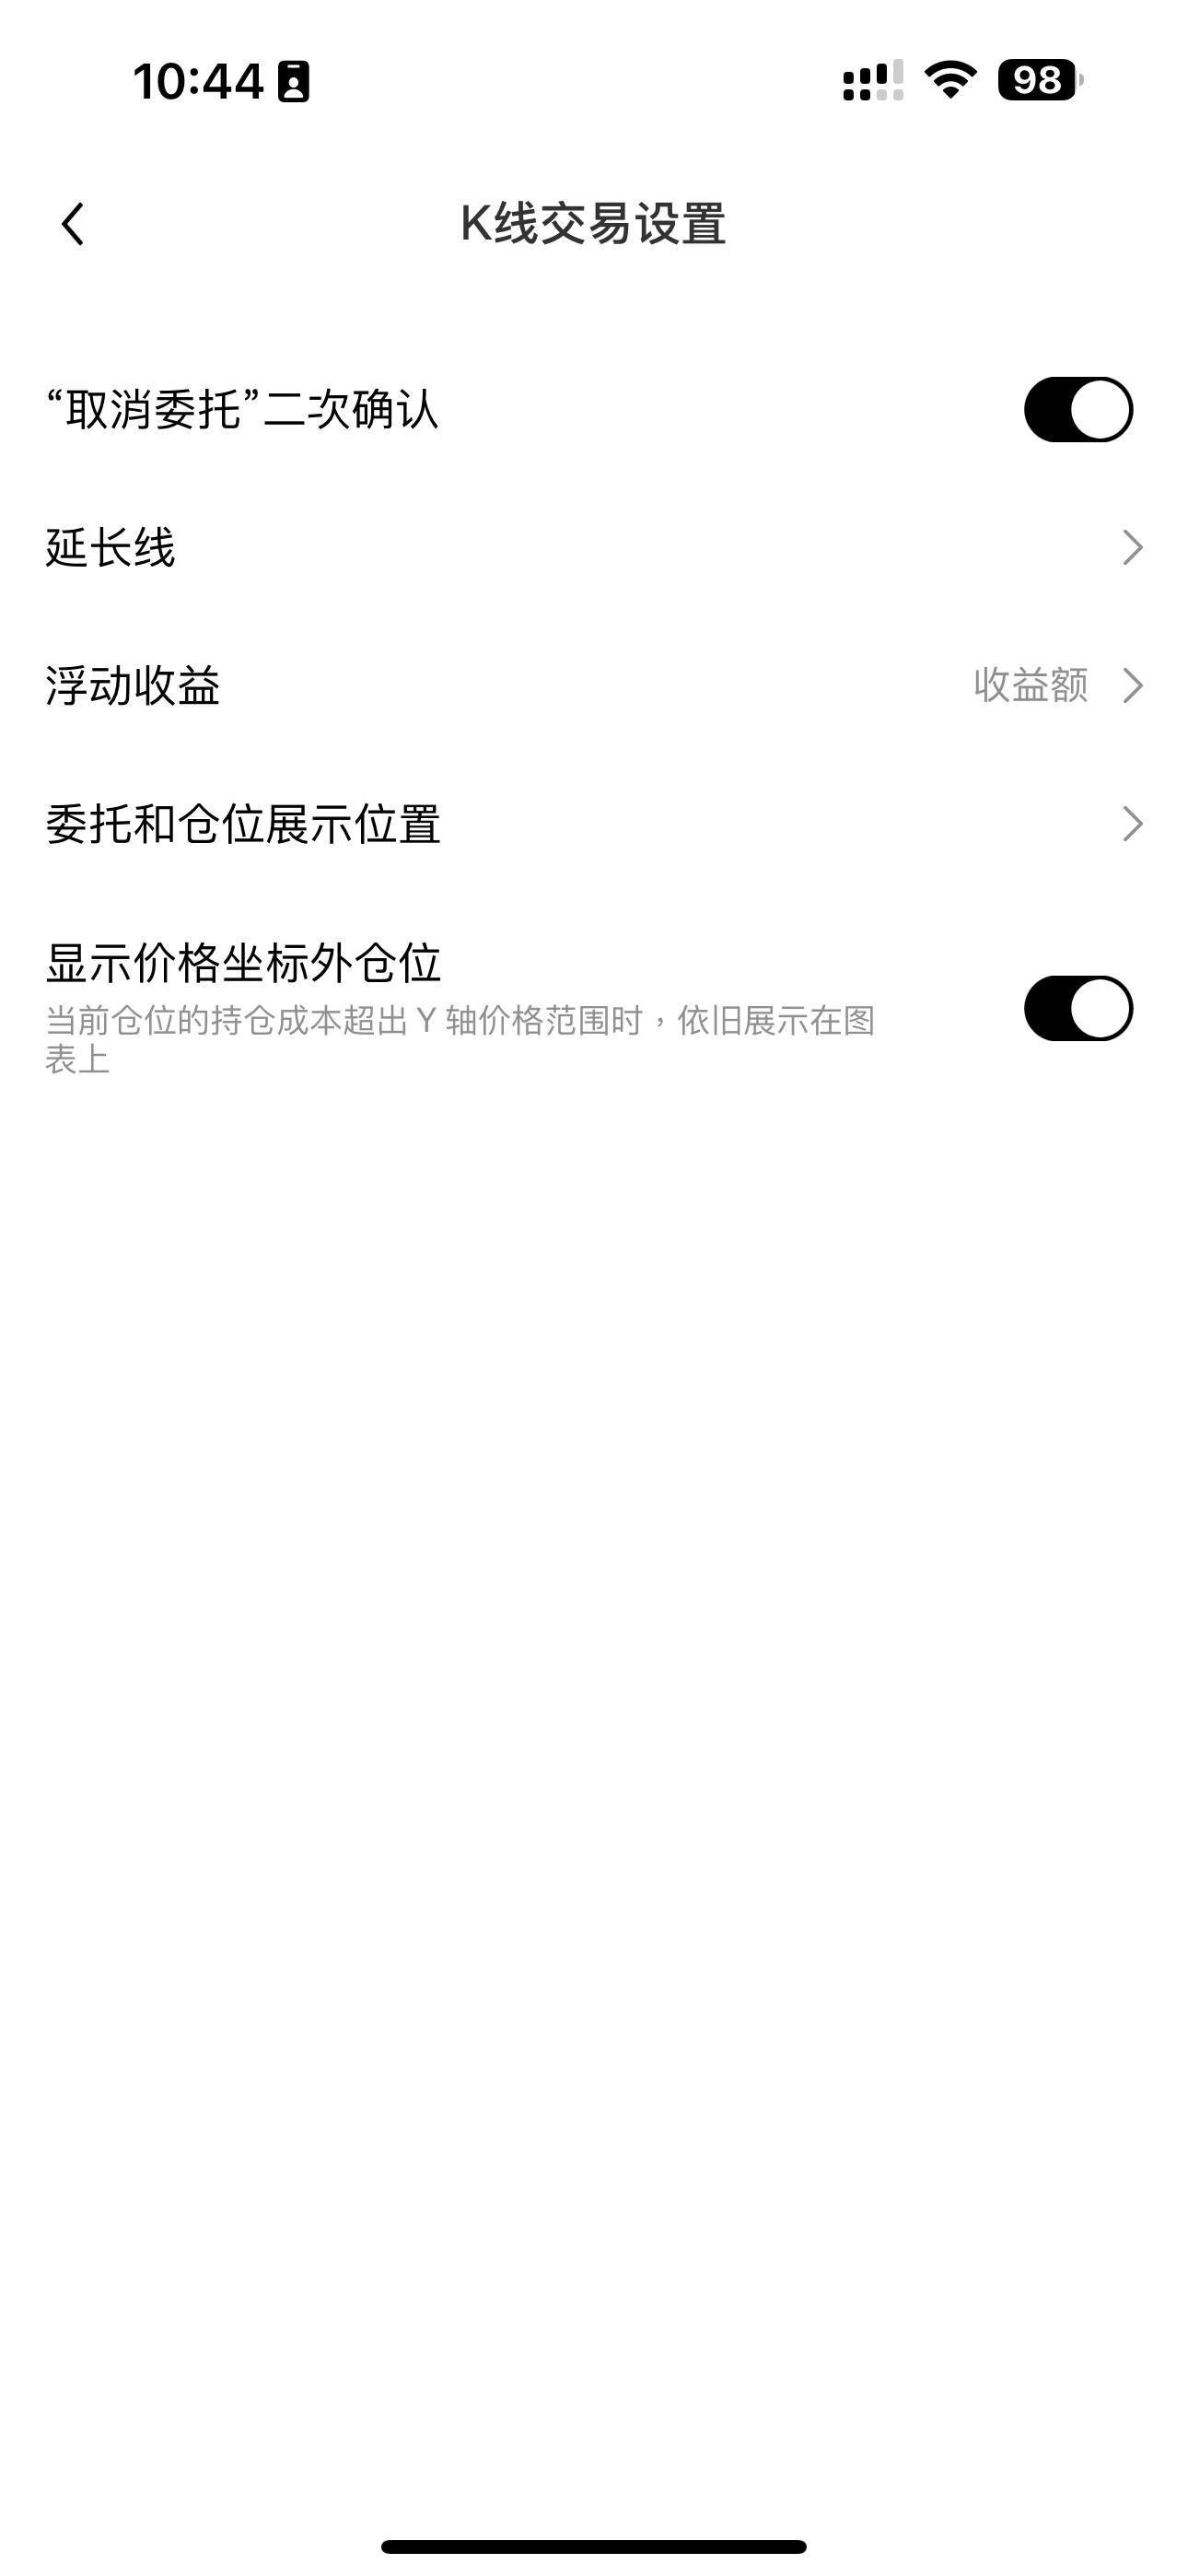
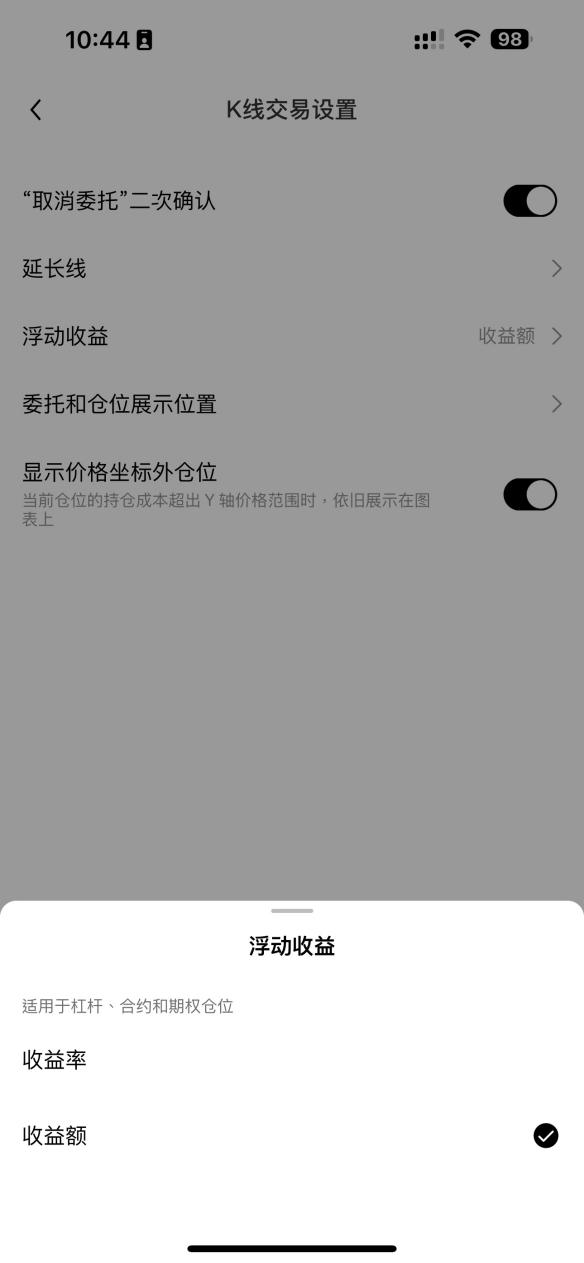
Display of profit and loss value or ratio. Users can choose to display profit and loss values or ratios on order and holding lines through the profit and loss display settings.
(II) Candlestick Analysis
On the candlestick analysis front, OKX provides users with easy-to-use tools for precise market analysis through three dimensions: professional candlestick drawing tools, rich data indicators, and customizable display styles.
In this upgrade, OKX has added many practical features to candlestick analysis, such as adding key trading data as indicators on the candlestick chart, using drawing tools in full-screen mode, and Y-axis zooming to assist in precise analysis, comprehensively enhancing the user experience.
First, addition of trading data indicators. Users can now visualize key trading data as indicators on the candlestick chart. Currently, OKX supports five different types of trading data indicators, including open interest, top trader account long/short ratio, top trader position long/short ratio, long/short account ratio, and active buy/sell order volume, and will continue to iterate and enrich them in the future.
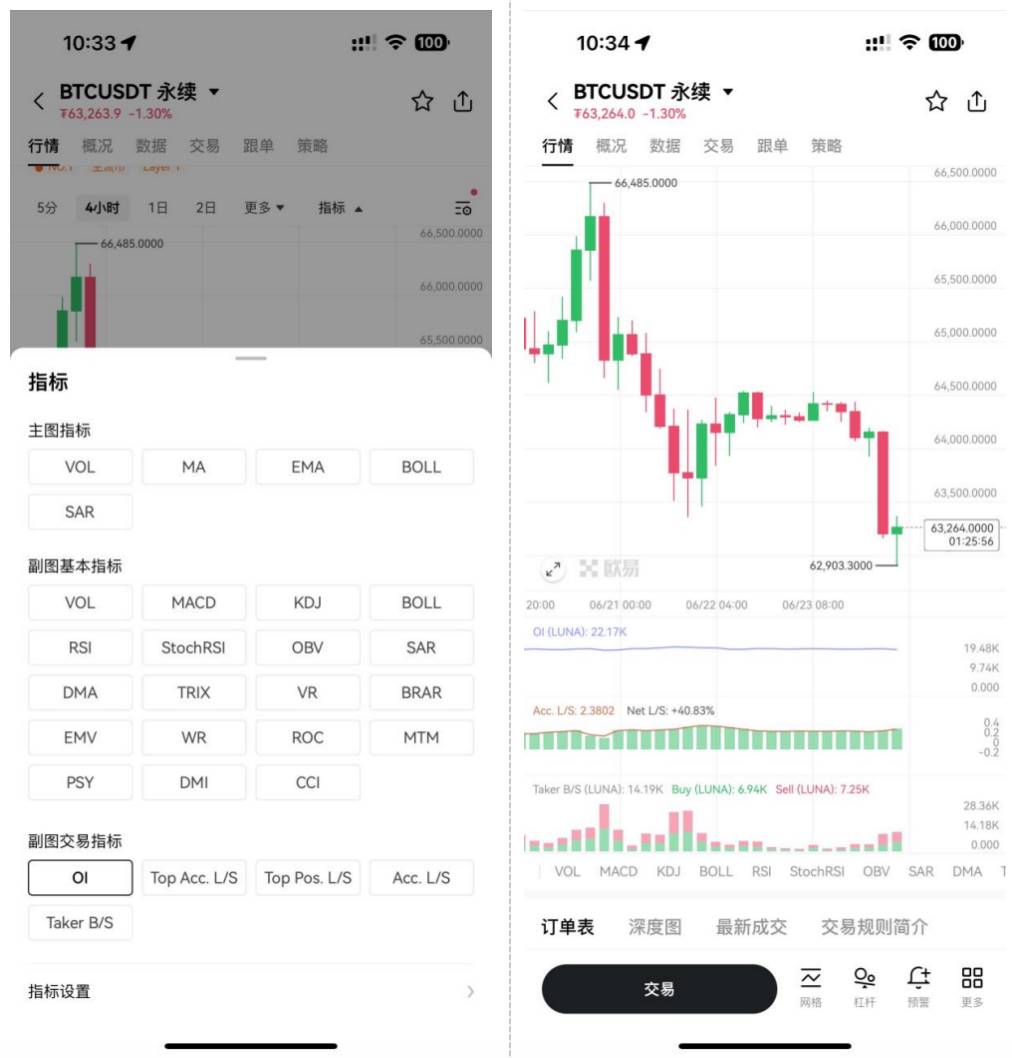
Second, drawing tools in full-screen mode. OKX's candlestick chart now supports full-screen mode and manual Y-axis zooming, making it easier for users to draw trend lines, Fibonacci retracements, and other common drawing tools on the candlestick chart. Importantly, all user drawings are saved on OKX's backend servers and synchronized across all platforms, eliminating concerns about losing any drawings or repeating operations between the OKX APP and PC.
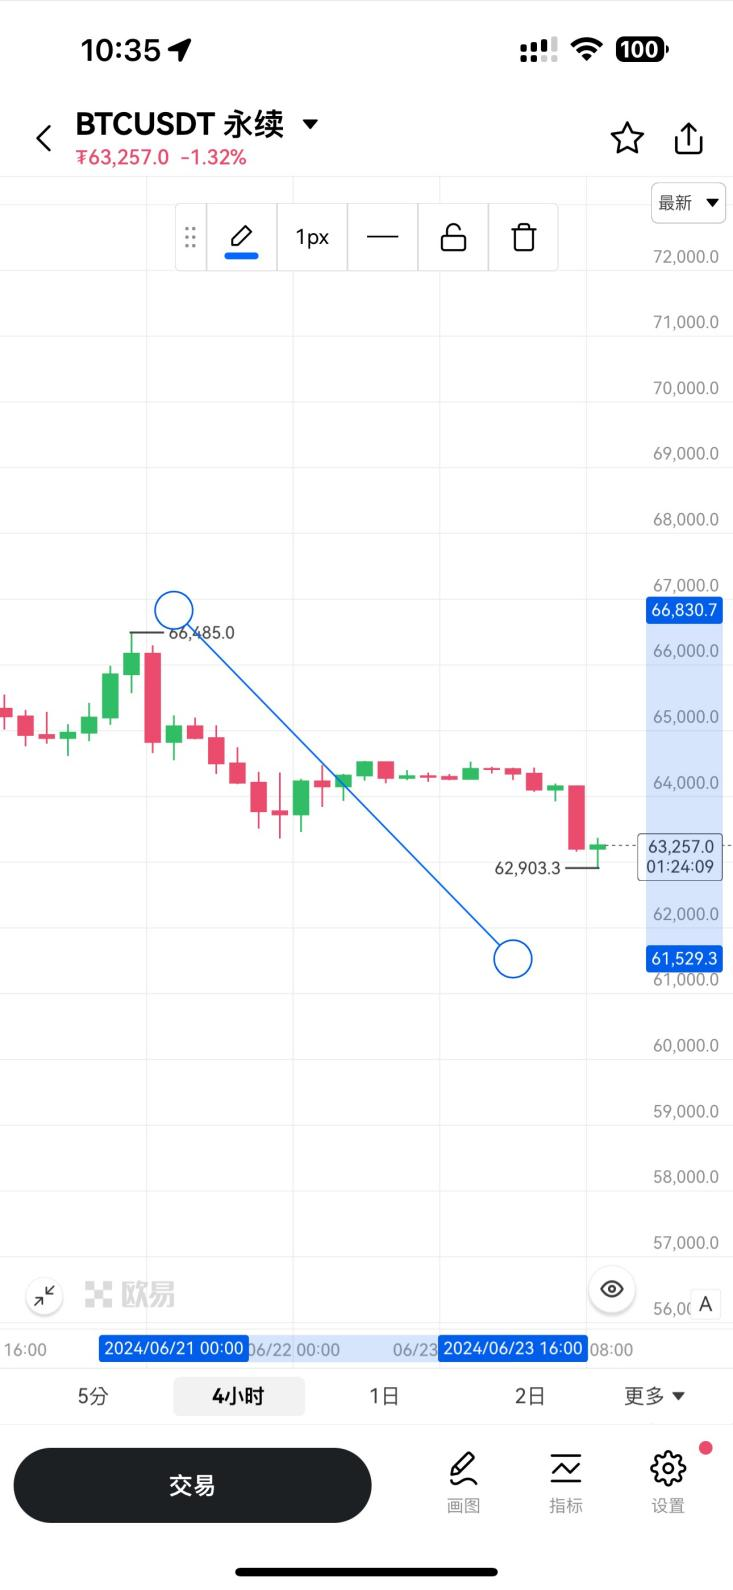
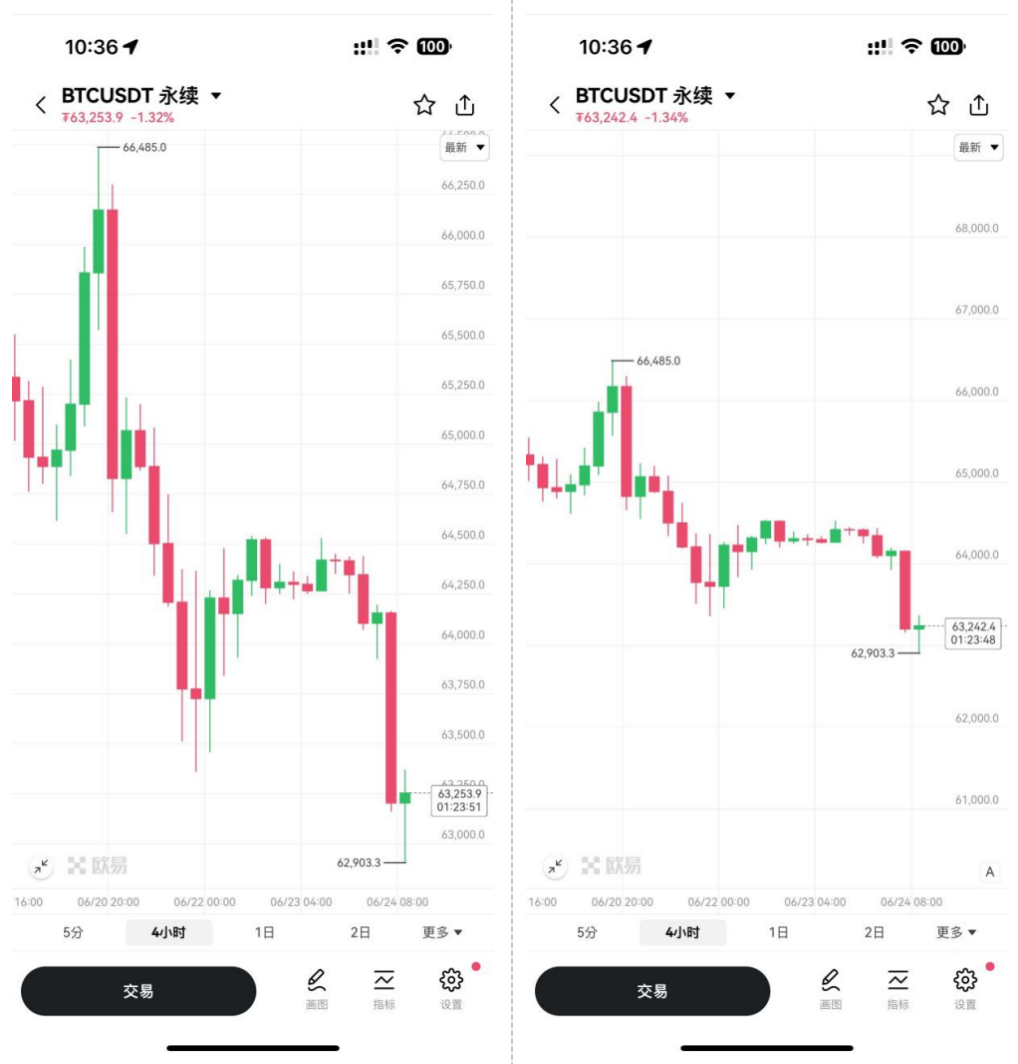
Third, support for Y-axis zooming. OKX's candlestick chart now supports manual adjustment of the Y-axis scale, helping users comfortably browse and view the candlestick chart. Additionally, users can drag and zoom the candlestick chart to more accurately select entry points, further enhancing trading precision. This personalized control allows users to switch between different tasks more easily and quickly.
Focusing on user experience, OKX drives intelligent trading
The devil is in the details.
On the one hand, OKX focuses on product details, listens to user needs, and continuously improves user experience through technological innovation. With the "Candlestick Trading Assistant," OKX further optimizes the integration of candlestick technical analysis tools and trading operations, enhancing the usability and convenience of the product through their seamless combination, providing users with a smoother and more seamless trading experience. As Amazon founder Jeff Bezos said, "The customer experience is the key to whether they will choose us again."
On the other hand, OKX continues to innovate and explore in the field of intelligent trading and future financial tools, improving the convenience and efficiency of user system usage through optimized interactions, making user operations more natural and simple. For example, based on the "Candlestick Trading Assistant" feature, users can intuitively observe market trends, make quick trading decisions, and achieve more efficient and intelligent interactions, helping users adapt to market complexity more quickly.
As a pioneer in the financial technology field, the cryptocurrency industry is constantly driving innovation and development in digital asset trading. With the market maturing and user demands increasing, advanced trading tools are becoming one of the core competitive advantages of cryptocurrency trading platforms. Balancing user needs and experience while maintaining technological and product leadership is a topic that every Web3 technology company needs to consider.
Users are the most sensitive and will always switch to the best user experience at any time.
Disclaimer
The information provided in this article and related services is for reference only and should not be construed as (i) investment advice, trading advice, or investment recommendations; (ii) an offer or invitation to buy or sell digital assets; or (iii) financial, accounting, legal, or tax advice. OKX does not guarantee the accuracy, completeness, or usefulness of such information. Digital assets (including stablecoins and NFTs) involve high risks and may depreciate or become worthless. Digital assets are not insured. Past performance does not guarantee future results. You should carefully consider whether trading or holding digital assets is suitable for you based on your financial situation, investment objectives, experience, and risk tolerance. For your specific situation, please consult your legal, tax, and investment professionals. Please be responsible for understanding and complying with applicable local laws and regulations.
免责声明:本文章仅代表作者个人观点,不代表本平台的立场和观点。本文章仅供信息分享,不构成对任何人的任何投资建议。用户与作者之间的任何争议,与本平台无关。如网页中刊载的文章或图片涉及侵权,请提供相关的权利证明和身份证明发送邮件到support@aicoin.com,本平台相关工作人员将会进行核查。


