Author: Alice Kohn, Glassnode
Translation: Daling Think Tank
In recent weeks, as more and more Ethereum validators voluntarily exit, the growth of the Ethereum validator population has begun to slow down, thereby reducing the mining speed of Ethereum. As activity within the Ethereum network continues to increase, the amount of Ethereum burned through the EIP-1559 protocol has also surged, leading to a renewed supply contraction of Ethereum.
Summary
- The trend change in Ethereum staking is becoming increasingly significant. Since October, the number of exiting validators has been increasing, closely related to the bullish trend in the digital asset market.
- The increasing number of validators exiting has led to a decrease in daily mining volume of Ethereum, which is closely related to the active Ethereum in the staking pool.
- Meanwhile, as people pay close attention to various digital assets and stablecoins, we can easily observe an increase in current Ethereum network activity. This is reflected in the fact that the increase in Gas fees burned through EIP-1559 has triggered a supply contraction of ETH.
Undoubtedly, the most important headline news in the past week was the resignation of Binance CEO CZ. In the previous lawsuit, Binance reached a final settlement amount with the authorities of 4.3 billion USD, and many consider this key event as a sign of the end of the era of wild growth in the digital asset industry.
Following this announcement, the price of BNB dropped by 9.1%. However, compared to previous price drops, this market reaction was relatively mild—earlier this year, when the SEC announced they would charge Binance, BNB experienced a drop of as much as 24%.
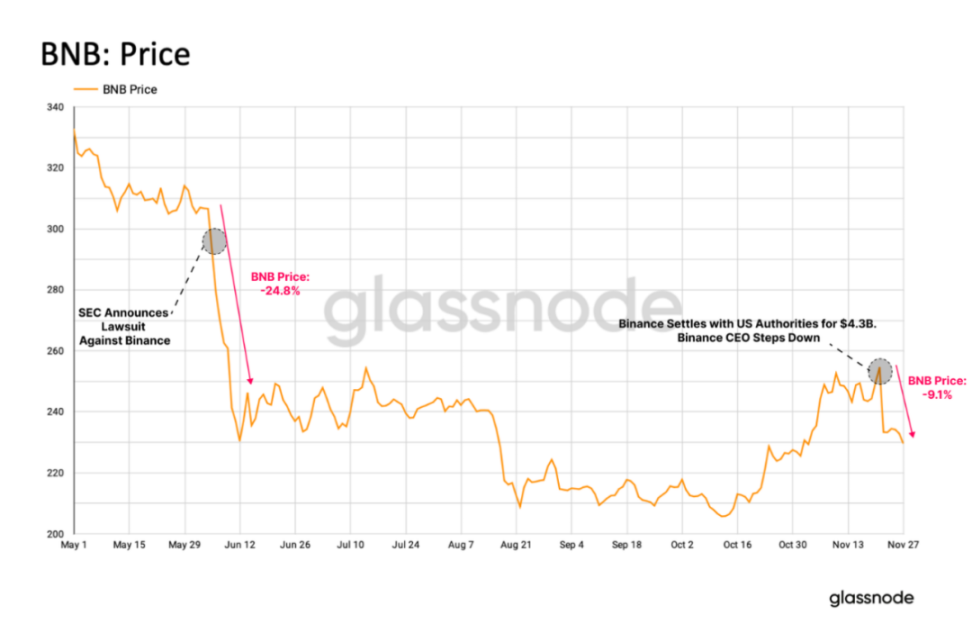
Figure 1: BNB Price Trend
After this announcement, the withdrawal activity of Binance's main assets increased. The total balance of a series of DeFi "blue chip stocks" decreased by 6.7% in the previous 24 hours, while the balances of Bitcoin, Ethereum, and stablecoins decreased by 4.4%, 4.9%, and 2.2% respectively.
However, in the six days following CZ's resignation, there were signs of recovery in Binance's balances—outflows of all four types of digital assets slowed down, and even returned to net inflows. In many ways, this indicates the level of trust users have in the Binance platform. Some also believe that considering Binance's potential settlement with U.S. regulators over the next three years, user confidence in the trading platform may even be reinvigorated.
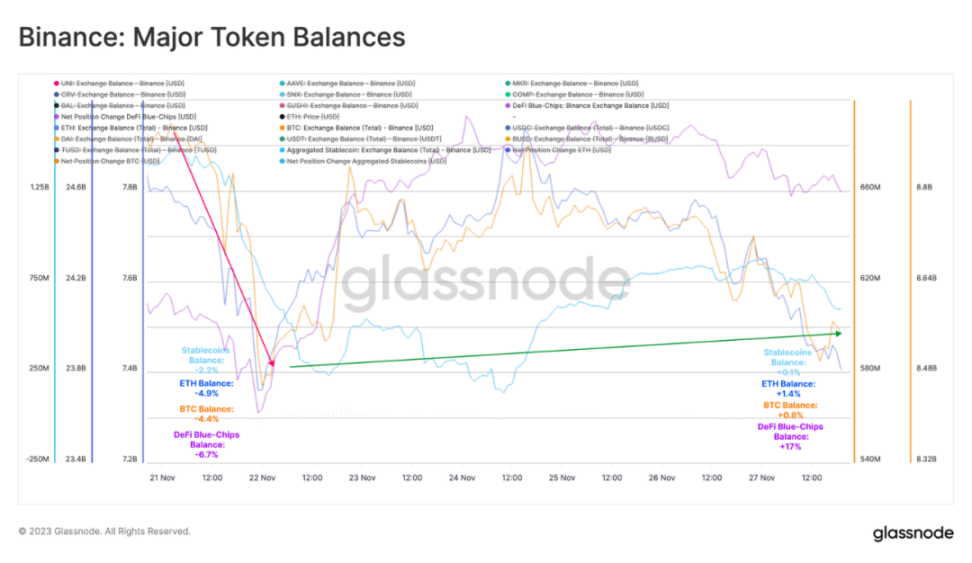
Figure 2: Recent Balance Changes of Binance's Main Assets
Validator Exits
Although not making headlines like Binance, the Ethereum staking pool has been undergoing significant changes since October this year. Now, more and more validators are exiting staking.
With the official launch of the "staking withdrawal" mechanism in the Shanghai upgrade, the number of users withdrawing staking and realizing profits has increased significantly, and at the same time, staking providers and their equipment have experienced increasingly fierce reshuffling. During this period, an average of 319 validators have been exiting staking every day.
Since early October, we have seen this exiting behavior continue to increase, reaching a peak of an average of 1,018 validators exiting staking per day. This upward trend is consistent with the recent bullish trend in spot prices of digital assets.
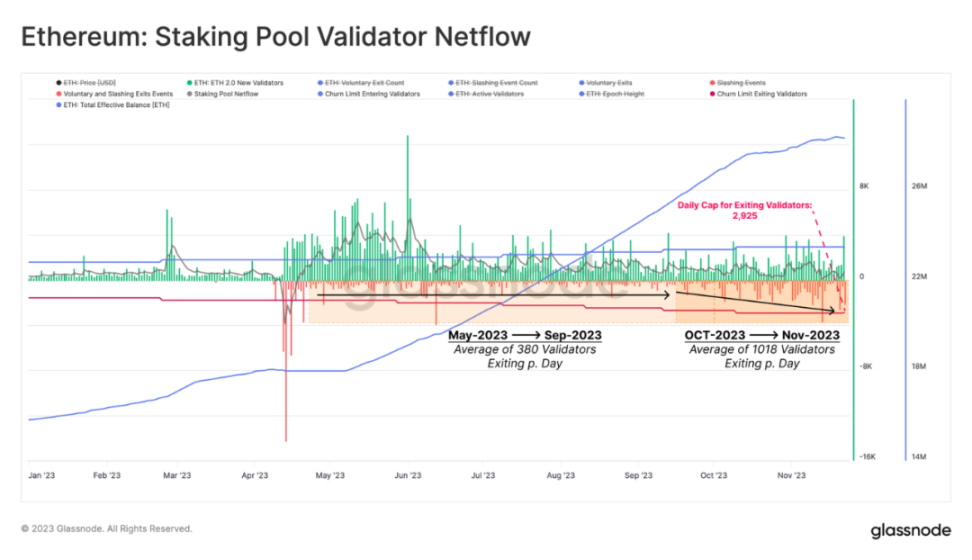
Figure 3: Ethereum Validator Traffic
As a result, the total effective staking balance of Ethereum, representing active participation in the proof-of-stake consensus, has seen a slowdown in growth, and this indicator is currently experiencing its first decline since the Shanghai upgrade.
The growth gradient of the total effective balance in the staking pool has started to level off since mid-October, with an average daily growth rate of 0.1% to 1%, more than half of the growth rate since May.
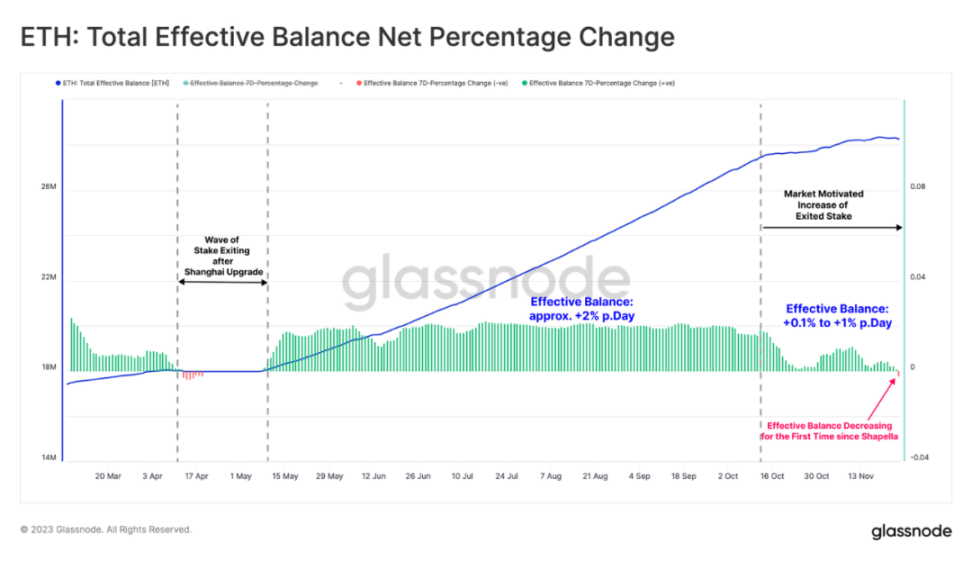
Figure 5: Net Percentage Change in Total Ethereum Balance
We carefully examined the situation of these exiting validators and found that most of them have been "voluntarily exiting" in the past eight weeks. "Voluntarily exiting" refers to validators choosing to exit staking on their own, which is different from being "slashed" from the staking pool— the latter is a punishment for validators who violate protocol rules.
During the same period, the Ethereum network has only experienced two "slashing" events, one of which was of a larger scale. This event involved 100 new validators who were penalized for signing on two different blocks simultaneously.
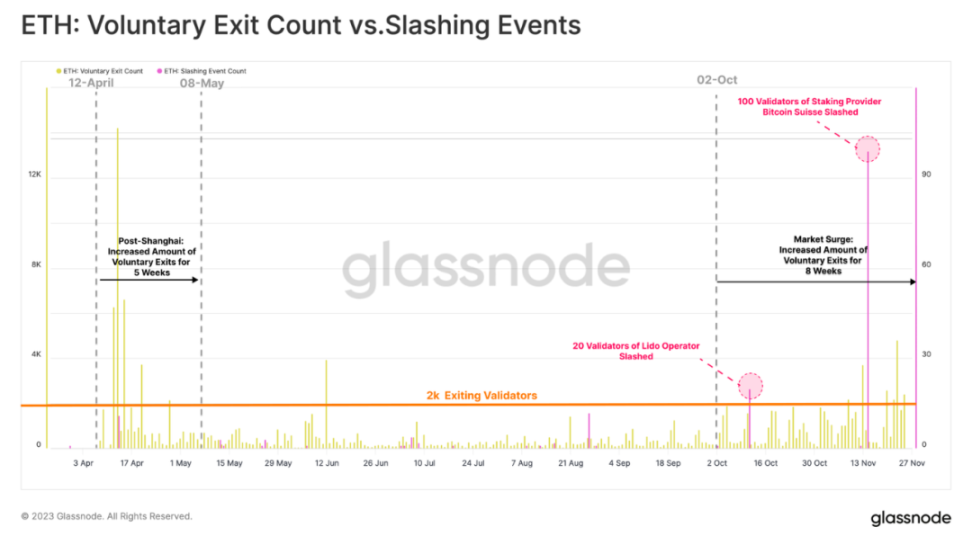
Figure 6: Comparison of Voluntary Exits and "Slashing" Events in the Ethereum Network
These exiting validators can be further classified based on their staking provider type. This classification reveals some interesting phenomena:
- Since October, centralized exchange platforms (CEX) have been the main area for staking withdrawals, with Kraken and Coinbase having the largest outflows.
- There has also been a slight increase in staked Ethereum being withdrawn, with Lido still being the largest participant in this area.
Several factors may be driving the behavior of these investors:
- Investors may be forced to change their staking configurations due to continued regulatory pressure, such as moving staked Ethereum from CEX to providers with higher liquidity.
- Investors who can access the U.S. capital market may be more inclined to invest in safer assets like U.S. treasuries, which offer higher returns than current Ethereum staking.
- Investors may also seek greater liquidity for the Ethereum they hold to cope with the upcoming bullish trend in the market, rather than continuing to hold Ethereum with lower liquidity.
We note that among the CEX with staking withdrawals, Kraken and Coinbase hold a prominent position, while the highest withdrawal rate of high liquidity staking providers comes from Lido. However, it must be pointed out that entities represented by Lido are also the main recipients of Ethereum staking, demonstrating the strong investor stickiness of these large institutions and their transcendent position in the market.
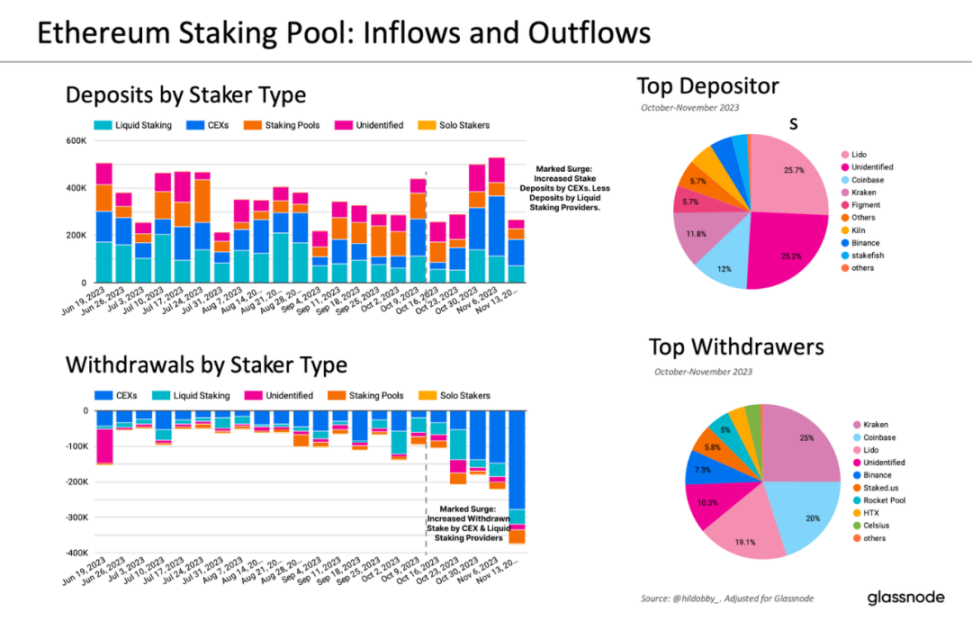
Figure 7: Ethereum Staking: Inflows and Outflows
Based on net change, Lido's dominant position has become more stable, with its total staked balance increasing by 468,000 ETH. Among CEX, the staked balances of Coinbase and Binance are still in a net increase state, while Kraken's staked balance decreased by 19,400 ETH. Among staking providers, HTX and Staked.us saw the most significant decreases in staked balances, both decreasing by over 44,000 ETH.
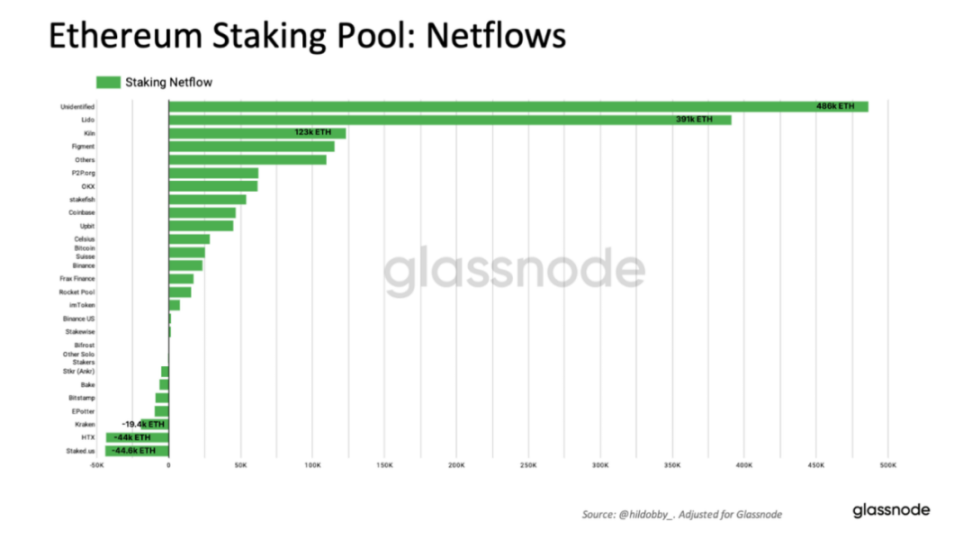
Figure 8: Ethereum Staking: Net Flow
Consistent with the observed decrease in effective balances, the mining volume of Ethereum has also decreased correspondingly—because the daily amount of Ethereum mined depends on the number of active validators or the total effective balance in the staking pool.
As the growth rate of validators slows down and even declines, the daily mining volume of Ethereum has also decreased. Over the past 7 days, the growth rate of Ethereum mining volume has decreased by 0.5% per day. It is worth noting that this is the first time the growth rate of mining volume has shown a decline in the recent period.
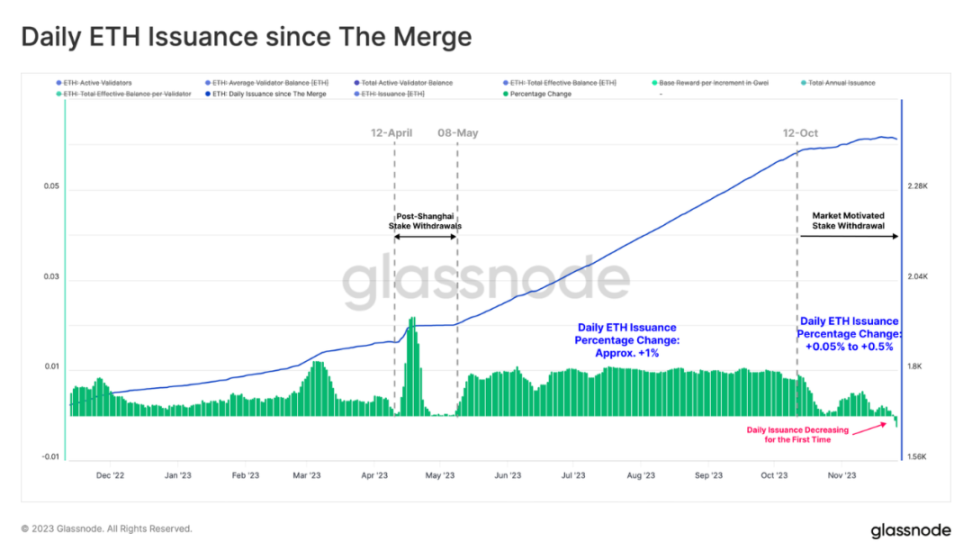
Figure 9: Daily Ethereum Mining Volume since Merge
With the decrease in Ethereum's mining rate, we can now turn our attention to another aspect that can serve as a complementary research—burn rate. Since the fee burning mechanism enabled by the EIP-1559 protocol began with the London hard fork in 2021, this part involves the transaction fees of the Ethereum fuel portion, laying the theoretical foundation for the phenomenon of Ethereum supply contraction as network usage increases.
Considering the recent increase in gas fees, which indicates a continuous growth in transaction demand on the Ethereum network, it is evident that the daily cost consumption has also increased. Throughout October, the daily burned fees in the network reached 899 ETH. And in the past month, a total of 5,368 ETH has been burned as fuel in network transactions.
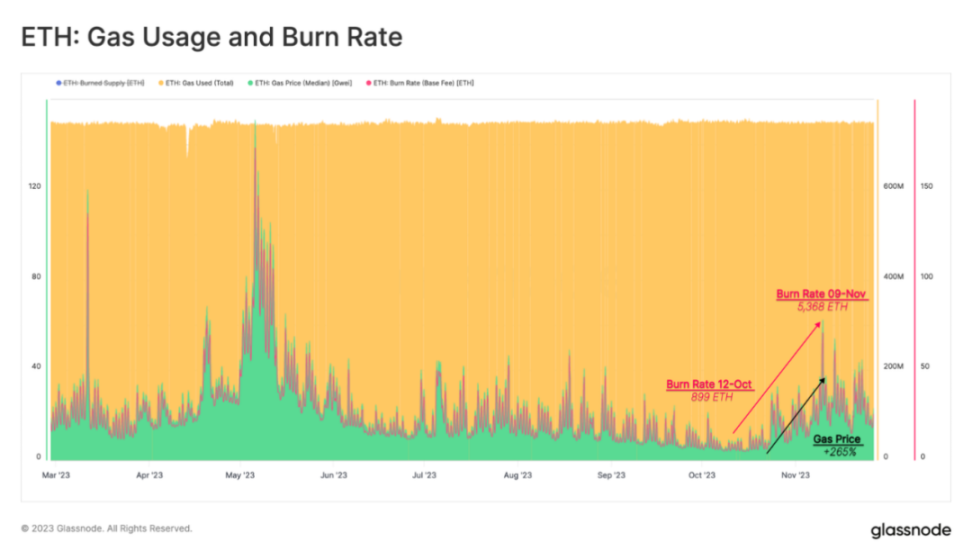
Figure 10: Ethereum: Gas Fees and Burn Rate
Furthermore, we can also evaluate detailed accounts of gas usage for various types of transactions. These metrics allow us to identify behaviors that primarily contribute to supply consumption.
By studying the two areas that historically have had the greatest impact on the Ethereum network—NFTs and DeFi, we can clearly see that transaction activity in these two areas has decreased relatively over the past four months, with decreases of 3% and 57% respectively. Our conclusion is that the binding strength of these two areas to the Ethereum network is weakening, and their contribution to the recent surge in on-chain activity is minimal.
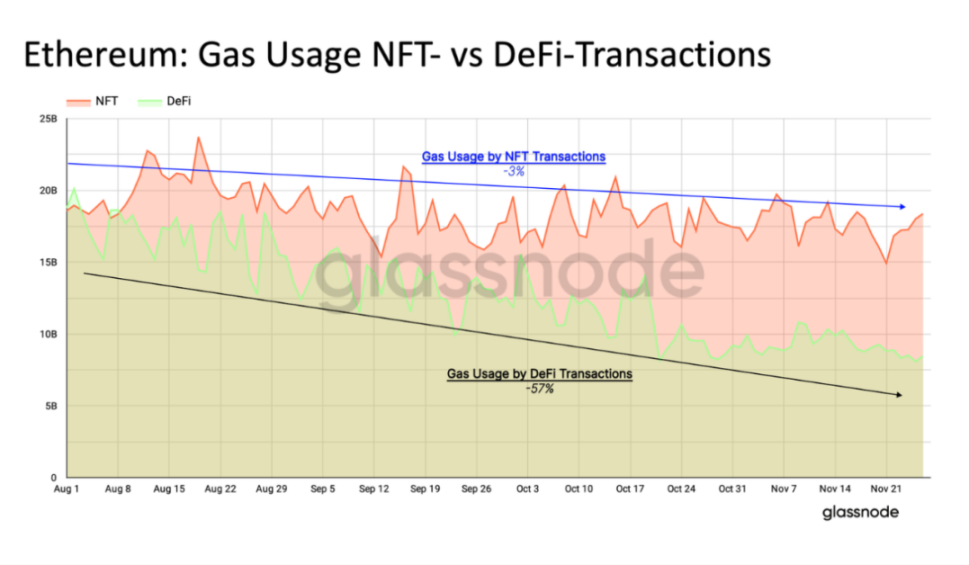
Figure 11: Ethereum: Gas Fees in NFT and DeFi Transactions
The recent surge in Ethereum network activity is mainly attributed to the trading of digital assets and stablecoins. Over the past three months, the gas volume for these digital assets has increased by 8.2%, while stablecoin gas volume has increased by 19%. This indicates that as confidence in the market strengthens, capital may shift towards long-tail assets.
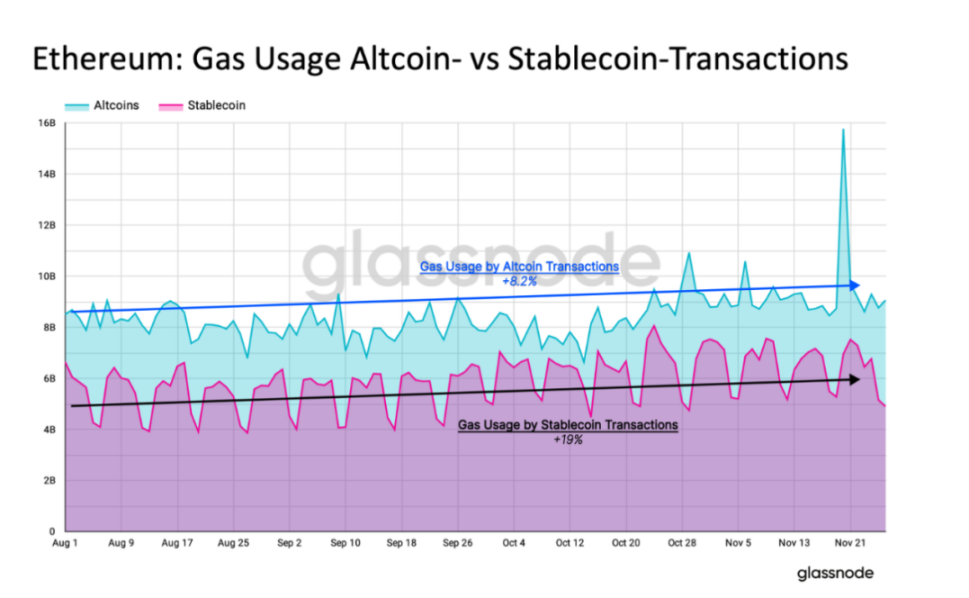
Figure 12: Ethereum: Gas Fees in Other Digital Asset and Stablecoin Transactions
Since the London hard fork, Ethereum has transitioned from net inflation to equilibrium and then entered a complete state of contraction. It is worth noting that due to the decrease in network activity, Ethereum experienced a brief period of net inflation from August to October.
In recent weeks, due to the decrease in issuance rate and increase in supply, the total supply of Ethereum has once again experienced net contraction.
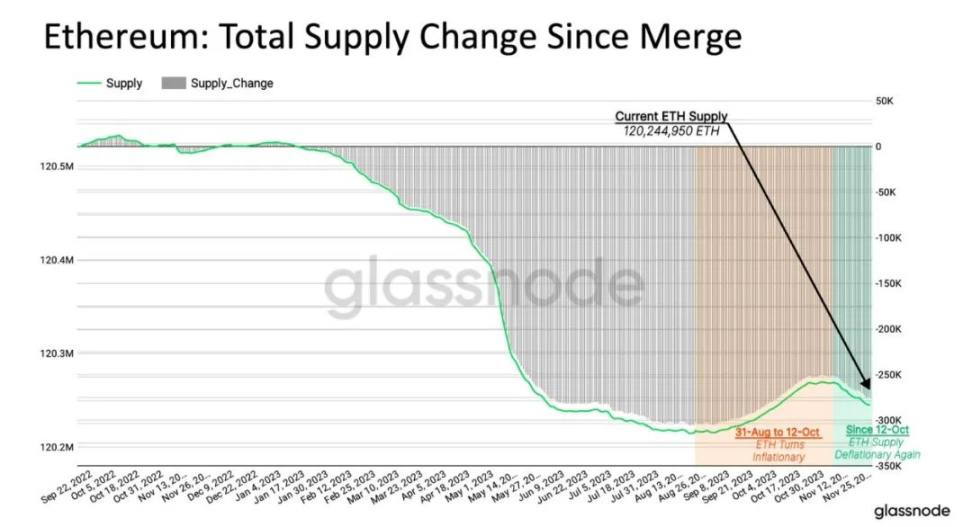
Figure 13: Ethereum: Total Market Supply since Merge
Summary
In recent weeks, with the increasing number of validators exiting the staking pool, significant changes have occurred in Ethereum staking dynamics. This has led to a slowdown in the growth rate of Ethereum's mining volume and a decrease in staking balance for the first time since the Shanghai upgrade.
Furthermore, the recent surge in Ethereum network activity, especially driven by the transfer of other digital assets and stablecoin transactions, has led to an increase in transaction demand. This, in turn, has put upward pressure on gas prices, leading to an increase in daily Ethereum fees burned through the EIP-1559 protocol.
In this context, we can see more clearly that Ethereum's network conditions and market supply are interacting with external factors such as trading activities of other digital assets and stablecoins, as well as the activities in areas such as DeFi and NFTs that are deeply dependent on the Ethereum network. It is evident that Ethereum's contraction is a natural result of the combination of these many factors.
免责声明:本文章仅代表作者个人观点,不代表本平台的立场和观点。本文章仅供信息分享,不构成对任何人的任何投资建议。用户与作者之间的任何争议,与本平台无关。如网页中刊载的文章或图片涉及侵权,请提供相关的权利证明和身份证明发送邮件到support@aicoin.com,本平台相关工作人员将会进行核查。


