This article will start with the latest version v3 of Frax, which is about to be launched, and analyze and sort out the full-stack products of Frax one by one, taking you through the full picture of Frax Finance.
🏆 Holy Grail
Decentralized stablecoins face an impossible triangle problem in capital efficiency, decentralization, and price stability, constantly seeking a balance point among these three aspects, which is an elusive goal.
USDT and USDC excel in capital efficiency and price stability, creating a large market value and application scenarios, but they are highly centralized in terms of decentralization.
DAI, as the oldest decentralized stablecoin, initially excelled in decentralization, mainly using ETH as collateral to over-collateralize stablecoins. However, the high collateral ratio, while stabilizing the price, sacrifices capital efficiency, and falls short in application scenarios and market value compared to centralized stablecoins. Later, DAI gradually accepted centralized assets as collateral, sacrificing decentralization for an increasing market value.
UST is the most controversial decentralized stablecoin, achieving extreme capital efficiency and decentralization, and at one point, creating a market value second only to USDT and USDC. However, its aggressive strategy led to a death spiral in stablecoin price in extreme situations.
So, to this day, a "perfect" decentralized stablecoin has not yet emerged, which may be the "Holy Grail" pursued by builders.

Frax Finance is a full-stack protocol centered around decentralized stablecoins, starting from a partially collateralized algorithmic stablecoin and gradually transitioning to fully collateralized, maximizing capital utilization, and expanding horizontally into multiple areas, ultimately forming a stablecoin-driven matrix full-stack DeFi protocol. It is also the longest surviving non-fully collateralized stablecoin.
Its products include:
FRAX stablecoin: Decentralized USD stablecoin ★
FPI: Inflation-resistant stablecoin pegged to a basket of commodities ★
frxETH: LSD ★
Fraxlend: Lending ★
Fraxswap: Time-weighted decentralized exchange ★
Fraxferry: Cross-chain transfer ★
FXS & veFXS: Governance module ☆
AMO: Algorithmic open market operations controller ★
Frax Bond - Bonds (to be launched in v3) ☆
RWA - Real-world assets (to be launched in v3) ☆
Frax Chain - Layer2 (not yet launched) ☆
Frax has gone through three versions since its launch, v1, v2, and v3. Unlike many protocols in the market, each version of Frax not only involves functional upgrades but also major strategic adjustments. This means that if you miss a version, your understanding of Frax may be completely different.
Frax v1: It was launched with the goal of becoming an algorithmic stablecoin, gradually reducing the collateralization ratio using the "fractional algorithm" to maximize capital efficiency.
Frax v2: Strategically abandoned the approach of gradually reducing the collateralization ratio for algorithmic stablecoins, shifted to increasing the collateralization ratio to full collateral. Developed AMO to enter the Curve war to compete for on-chain liquidity governance resources, and developed frxETH to enter the Ethereum liquidity staking track LSD.
Frax v3: Introduces real-world assets RWA and continues to use AMO to maintain on-chain and off-chain liquidity.
This article will start with the latest version v3 of Frax, which is about to be launched, and analyze and sort out the full-stack products of Frax one by one, taking you through the full picture of Frax Finance.
Frax Finance v3
Frax v3 is an upcoming version that will focus on RWA, while continuing to use the AMO from v2 to gradually transform FRAX into a fully exogenous collateralized stablecoin that captures on-chain and off-chain assets, and a multi-decentralized stablecoin.
Fully Exogenous Collateralization
According to the FRAX balance sheet, the current version's FRAX collateralization ratio CR (Collateral Ratio) is 91.85%.
CR = (Owned assets+Lent assets) / Liabilities
CR = (615,357,001+65,654,459) / 741,400,658 = 91.85%
Starting from the Frax v3 version, the protocol will introduce real-world assets (RWA) to increase the CR until CR >= 100%, ultimately achieving 100% exogenous collateralization for FRAX. In fact, in February 2023, community proposal FIP188 stopped the process of FRAX algorithmic stablecoin and began to gradually increase the collateralization ratio CR using AMO and protocol income:
FIP188
This proposal has a significant meaning for Frax. Starting from FIP188, Frax will completely stop the "fractional algorithm" and "de-collateralization" functions. It will gradually transition from partially collateralized algorithmic stablecoin to fully collateralized. Here are some key points of this proposal:
Frax's initial versions included a "fractional algorithm," i.e., a variable collateralization ratio that adjusts based on the market demand for FRAX, effectively allowing the market to determine the combination of external collateral and FXS needed to equal 1.00 USD.
The reason for stopping the "fractional algorithm" is that, from a market perspective, the cost of slightly insufficient collateral far outweighs the benefits. The market's concern about 1% under-collateralization is far greater than the demand for an additional 10% yield.
Over time, growth, asset appreciation, and protocol income will increase the CR to 100%. It should be clear that this proposal does not rely on minting additional FXS to achieve 100% CR.
Reserve protocol income to fund the increase in CR, and pause FXS buybacks.
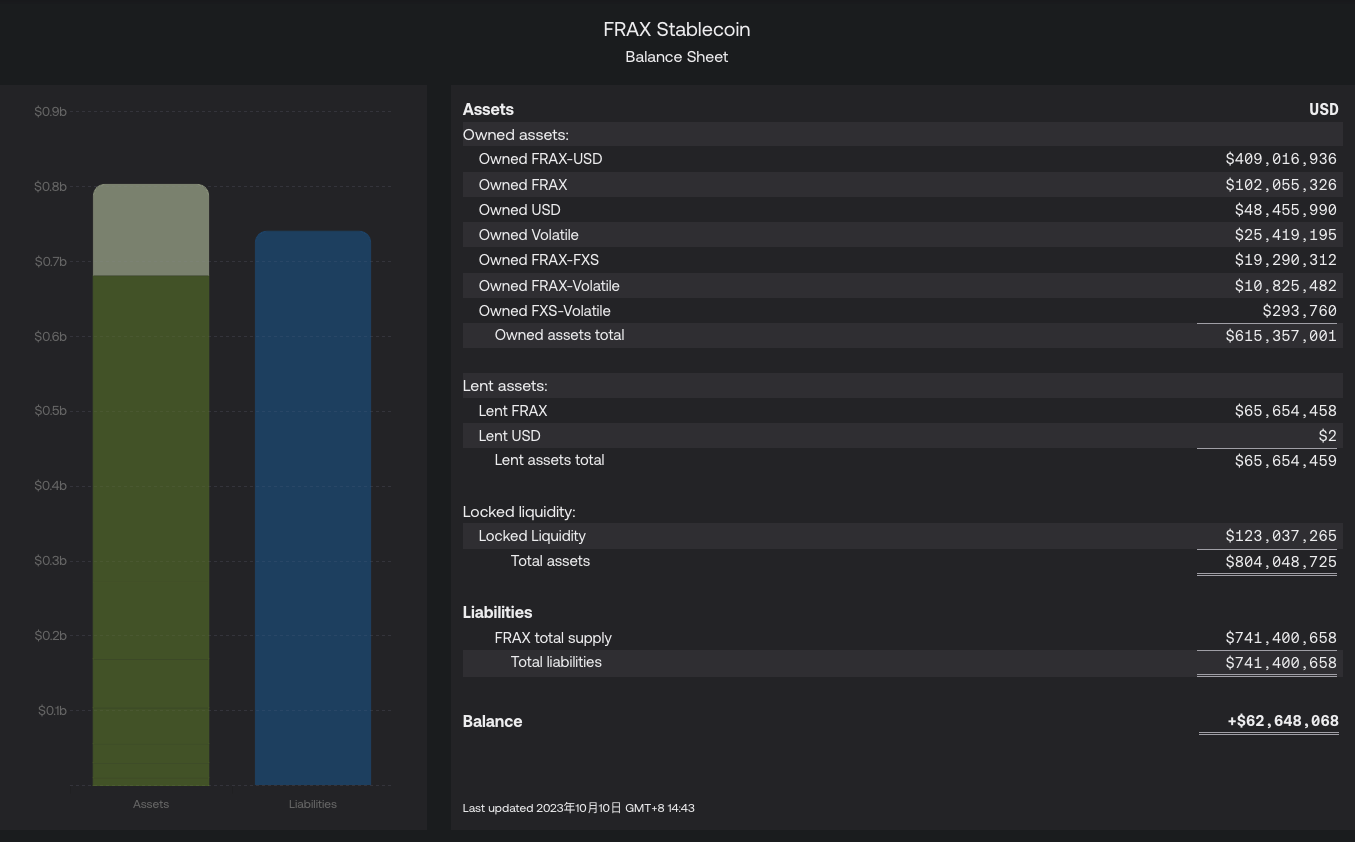
FRAX Balance Sheet 2023.10.10
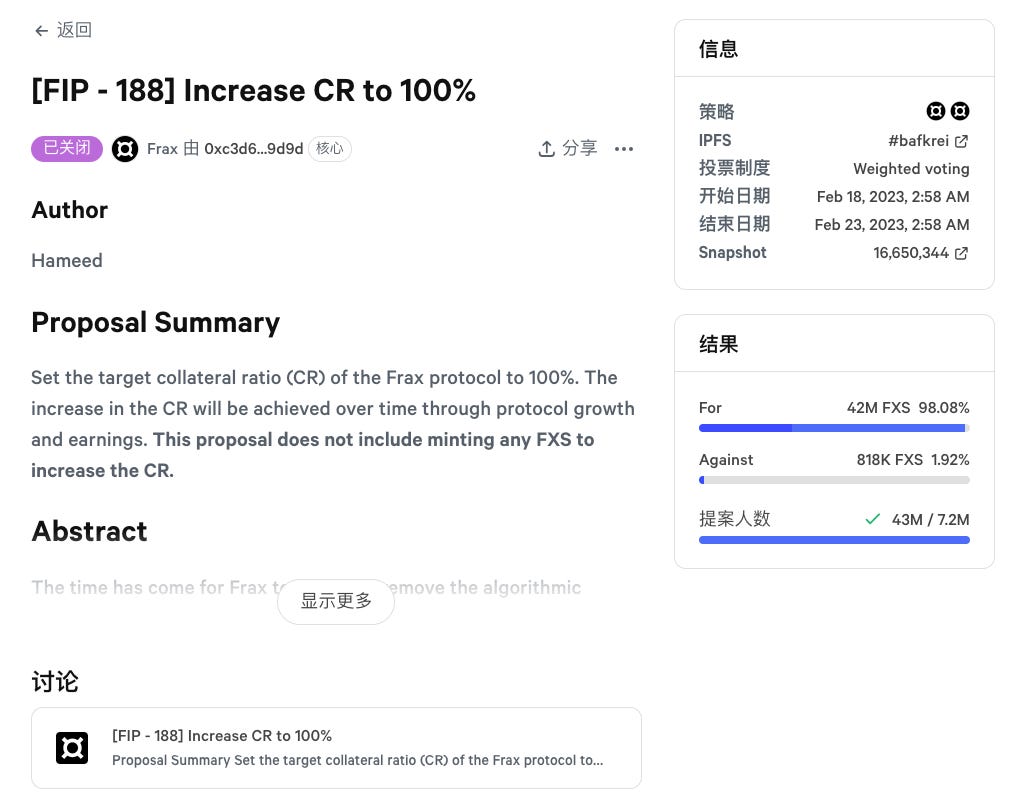
FIP 188 Proposal Approved
RWA
As one of the important means to increase CR to >=100% in Frax v3, the upcoming frxGov governance module of Frax will approve real-world entities to achieve asset purchase and holding of real-world assets controlled by AMO, such as US Treasury bonds.
Users holding FRAX can deposit it into a designated smart contract and receive sFRAX, similar to the relationship between DAI and sDAI. Let's compare the differences between sFRAX and sDAI:
One reason sDAI can earn slightly higher than the average yield of Treasury bonds (currently 5%, maximum 8%) is that not all DAI holders have deposited DAI into the DSR contract, and the income from Maker's investment in RWA only needs to be distributed to those who have deposited DAI into DSR to receive sDAI, so it's like a portion of the income is distributed to a subset of DAI holders.
sFRAX also meets this condition, but due to the accumulation of a large number of Curve and Convex tokens in the v2 phase, Frax has acquired a significant amount of voting power, allowing it to control a certain amount of CRV and CVX rewards on-chain, which will increase the overall income of sFRAX. At the same time, when on-chain or off-chain returns are not favorable or risks increase, it can quickly switch to the other side.
IORB Oracle
The FRAX v3 smart contract uses the Interest on Reserves for Banks (IORB) deposit rate to provide data for certain protocol functions, such as the equity yield of sFRAX.
When the IORB rate increases, the Frax protocol's AMO strategy will use US Treasury securities, reverse repurchase agreements, and US dollars deposited in Federal Reserve Banks paying the IORB rate to heavily collateralize FRAX.
When the IORB rate decreases, the AMO strategy will begin to rebalance FRAX collateral with on-chain decentralized assets and collateral loans in Fraxlend.
In simple terms, FRAX v3 adjusts its investment strategy based on the Interest on Reserves for Banks (IORB), sending funds to Treasury securities, Treasury bonds, etc., when off-chain returns are high, and to on-chain lending such as Fraxlend when on-chain returns are high, ensuring maximum returns and stability of the stablecoin.
frxGov Governance Module
Frax v3 will remove multisig and implement governance (veFXS) entirely through the frxGov smart contract module. This is an important step for Frax towards decentralized governance.
FraxBond (FXB) Bonds
Both sFRAX and FXB introduce the yield of Treasury bonds into Frax, but they have differences:
sFRAX represents the zero-term portion of the yield curve, while FXB represents the forward portion. Together, they form a comprehensive on-chain stablecoin yield curve.
If 50M FRAX is pledged for sFRAX, approximately 50M USDC (assuming CR=100%) can be sent off-chain to purchase short-term Treasury bonds worth 50M.
If 100M FXB with a maturity of 1 year is sold for 95M USDC, it means off-chain entities can buy 1-year Treasury bonds with 95M USD.
Additionally, FXB is a transferable ERC-20 token that can build its own liquidity in the secondary market and circulate freely, providing users with stablecoin investment choices of different terms, yields, and risk levels, and providing new components for building new Lego combinations.
Frax Finance v1
Frax v1 introduced the concept of a fractional algorithmic stablecoin, which means that part of its supply is supported by exogenous collateral (USDC), and part is unsupported (supported algorithmically using internal collateral FXS).
For example, with a CR of 85%, each redeemed FRAX will provide the user with 0.85 USD of USDC and 0.15 USD worth of FXS.
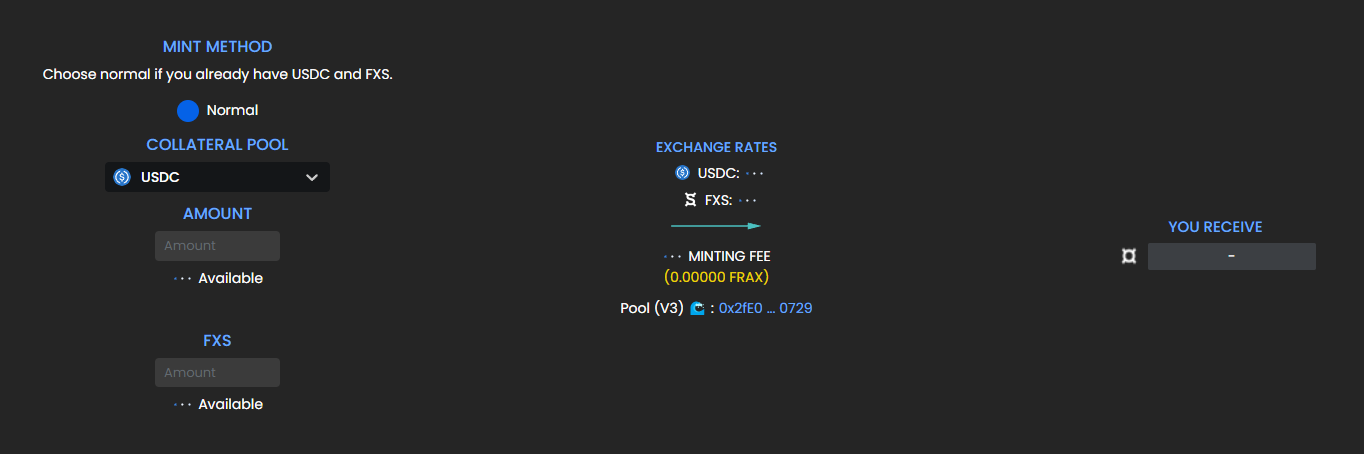
Using USDC and FXS to mint $FRAX in Frax v1
In v1, AMO existed in its simplest form, referred to as the fractional algorithm in this version. Its main function was to adjust the CR when minting FRAX based on market conditions, initially minting FRAX with a CR of 100%, meaning 1 FRAX = 1 USDC, in the "integer phase." Subsequently, AMO would adjust the CR based on market conditions to enter the "fractional phase."
If FRAX >1 is above the peg and needs to expand, the CR will decrease, allowing more FRAX to be minted with less collateral.
If the price of FRAX 1 falls below the peg, the CR will increase to increase the collateral supporting each FRAX, restoring confidence in the system.
Although the fractional algorithm can intervene in the CR when minting new FRAX, this method of affecting the overall system CR is relatively slow. In addition, Frax v1 added two features to promote dynamic changes in CR to achieve the required accurate state of the protocol in conjunction with the fractional algorithm:
Decollateralization and Recollateralization
Recollateralization: When the fractional algorithm increases the system collateralization ratio, to make the actual collateralization ratio equal to the system collateralization ratio, the system must increase the amount of USDC in the system. FRAX has set up an incentive for this: anyone can add USDC to the system and receive more FXS in return; for example, a user can add $1 worth of USDC to the system and receive $1.2 worth of FXS.
Decollateralization (Buyback): When the system collateralization ratio decreases, users can use FXS to exchange for an equivalent value of USDC from the system, and then the FXS will be burned. There is no incentive in the buyback mechanism.
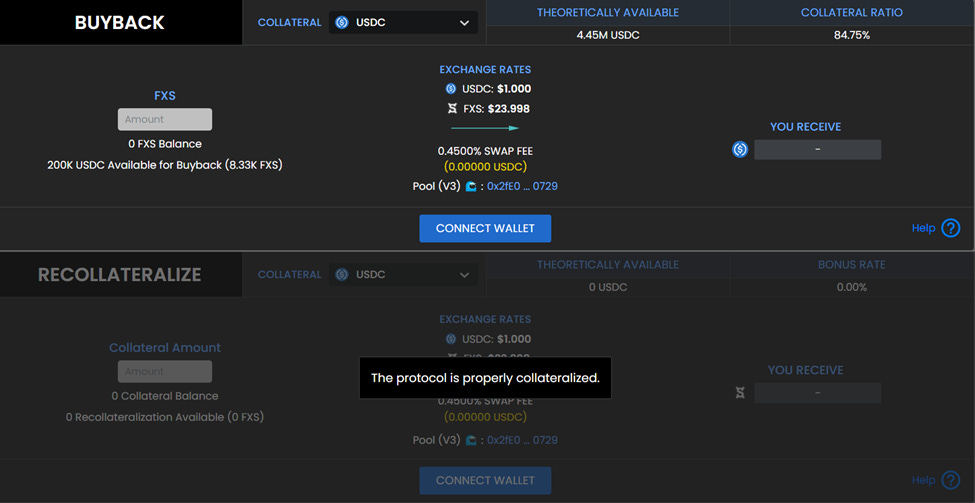
Decollateralization (Buyback) and Recollateralization Operation Page

Frax v1 was launched at a time when the DeFi market was dominated by algorithmic stablecoins. Other algorithmic stablecoin projects launched around the same time included Basis Cash and Empty Set Dollar (ESD). In terms of the market trend at the time, Frax was the most conservative algorithmic stablecoin project. As the market hype faded, only Frax survived and in the subsequent Frax v2 version, it changed course to supplement the collateralization ratio and utilize the treasury funds.
Frax Finance v2
Frax v2 was the most active version. In this version, the fractional algorithm was discontinued, and AMO was launched to manage the treasury funds, gradually filling the collateralization ratio (CR) with profits. Additionally, new businesses such as Fraxlend and frxETH were launched, and Frax participated in the Curve war, emerging as the winner in on-chain liquidity governance.
AMO (Algorithmic Market Operations Controller)
AMO is a tool similar to the Federal Reserve for implementing monetary policy. Its operation mechanism allows it to formulate any FRAX monetary policy within the limits of the strategy algorithm, as long as it does not reduce the collateralization ratio and change the FRAX price. This means that the AMO controller can execute open market operations through algorithms (hence their name), but they cannot simply mint FRAX out of thin air to break the peg.
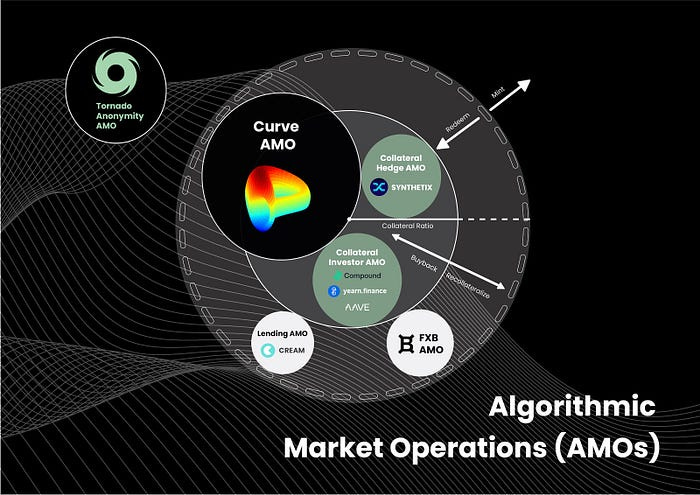
Currently, Frax operates 4 AMOs, with the Curve AMO having the largest amount of funds. Alongside the operation of AMOs, the protocol will utilize idle assets in the treasury (mainly USDC) and a certain amount of algorithmically controlled FRAX to be put into other DeFi protocols:
Maximize the utilization of treasury funds to earn additional income. For example, if the treasury holds 1M USDC, AMO mints 1M FRAX, and the two are used to provide liquidity in the USDC-FRAX LP, the actual mining income will be for a pool with a volume of 2M.
Since the minted FRAX (algorithmically controlled by the protocol) in the AMO is owned by the protocol and can be withdrawn and destroyed in the AMO strategy, it does not have a significant impact on the peg of FRAX.
Increases the market value of FRAX without actually adding new collateral.
Let's analyze the crucial "minting" capability of AMO.
The core of the "minting" strategy of AMO can be summarized as follows:
When AMO wants to add treasury funds (USDC) to the Curve Pool, if adding a large amount of USDC alone will affect the proportion of USDC in the pool and thus the price. Therefore, by minting an equivalent amount of FRAX and combining it with USDC to form LP, the funds can be added to the pool with minimal slippage, and the LP is held and controlled by AMO.
In addition, to maximize "minting," there is another scenario:
Suppose the pre-minted FRAX supply is Y, and the market's tolerance for a drop in FRAX to below $1 is X%.
If all Y is sold at once to a Curve Pool with a TVL of Z and an amplification factor of A, it will have a less than X% impact on the price of FRAX. This proves that the additional "minted" quantity of FRAX is acceptable for circulation in the open market.
In other words, since the Curve AMO can combine FRAX+USDC to form LP and put it into its own Curve Pool and control the TVL, in the event of a drop in FRAX by X%, the AMO can use the Recollateralization operation to withdraw and destroy excess FRAX, thereby increasing the CR and bringing the price back to the peg. The more LP controlled by AMO, the stronger this capability.
Therefore, before FRAX drops by X%, based on the ability of AMO to control LP, a quantity of FRAX can be calculated that is allowed to be sold to the Curve Pool at once without causing enough price impact to move the CR. This quantity is the maximum "minting."
For example, the 3.3 billion TVL FRAX3Pool can support at least $39.2 million worth of FRAX sell orders without the price changing by more than 1 cent. If X = 1%, then at least 39.2 million algorithmic FRAX can be "maximally minted" on the open market.
The above strategy is an extremely powerful market operation that will mathematically create a lower limit for the circulation of algorithmic FRAX without any risk of breaking the peg.
Fraxlend
Fraxlend is a lending platform that provides a lending market for ERC-20 assets. Unlike Aave v2's mixed lending pool, each lending pair in Fraxlend is an isolated market. When you choose to deposit a collateral for borrowers to borrow, you fully acknowledge and accept the value and risk of this collateral. The design of this isolated pool has two characteristics:
Any issues related to collateral or bad loans are limited to each pair and do not affect other lending pools.
Collateral cannot be lent out.
Fraxlend Mechanism Features - Interest Rate Models
Fraxlend offers 3 interest rate models (2 and 3 are used in practice). Unlike most lending protocols, all interest rate calculators in Fraxlend automatically adjust based on market dynamics without the need for governance intervention. The Frax team believes that letting the market determine interest rates is better than the team proposing governance proposals for every market fluctuation (as this method is slower).
1. Linear Interest Rate
When the utilization rate exceeds the critical value of the utilization rate, the steepness of the interest rate curve begins to increase. Most lending protocols use this basic interest rate growth model to ensure that when funds are borrowed too much from the pool, the interest rate is increased to encourage lenders to deposit and borrowers to repay.
2. Time-Weighted Floating Interest Rate
The time-weighted floating interest rate adjusts the current interest rate over time. It controls the interest rate through 3 parameters:
Utilization Rate: Adjusts the interest rate based on the utilization rate.
Half-life: This value determines the speed of interest rate adjustments. In simple terms, when the utilization rate is high, the interest rate will increase using a multiplier, and when the utilization rate is low, it will decrease.
Target Utilization Rate Range: No interest rate adjustments will be made within this range, as it is considered the expected market value.
In the current available interest rate calculator, the half-life of the interest rate is 12 hours. If the utilization rate is 0%, the interest rate halves every half-life, and if the utilization rate is 100%, the interest rate doubles every half-life.
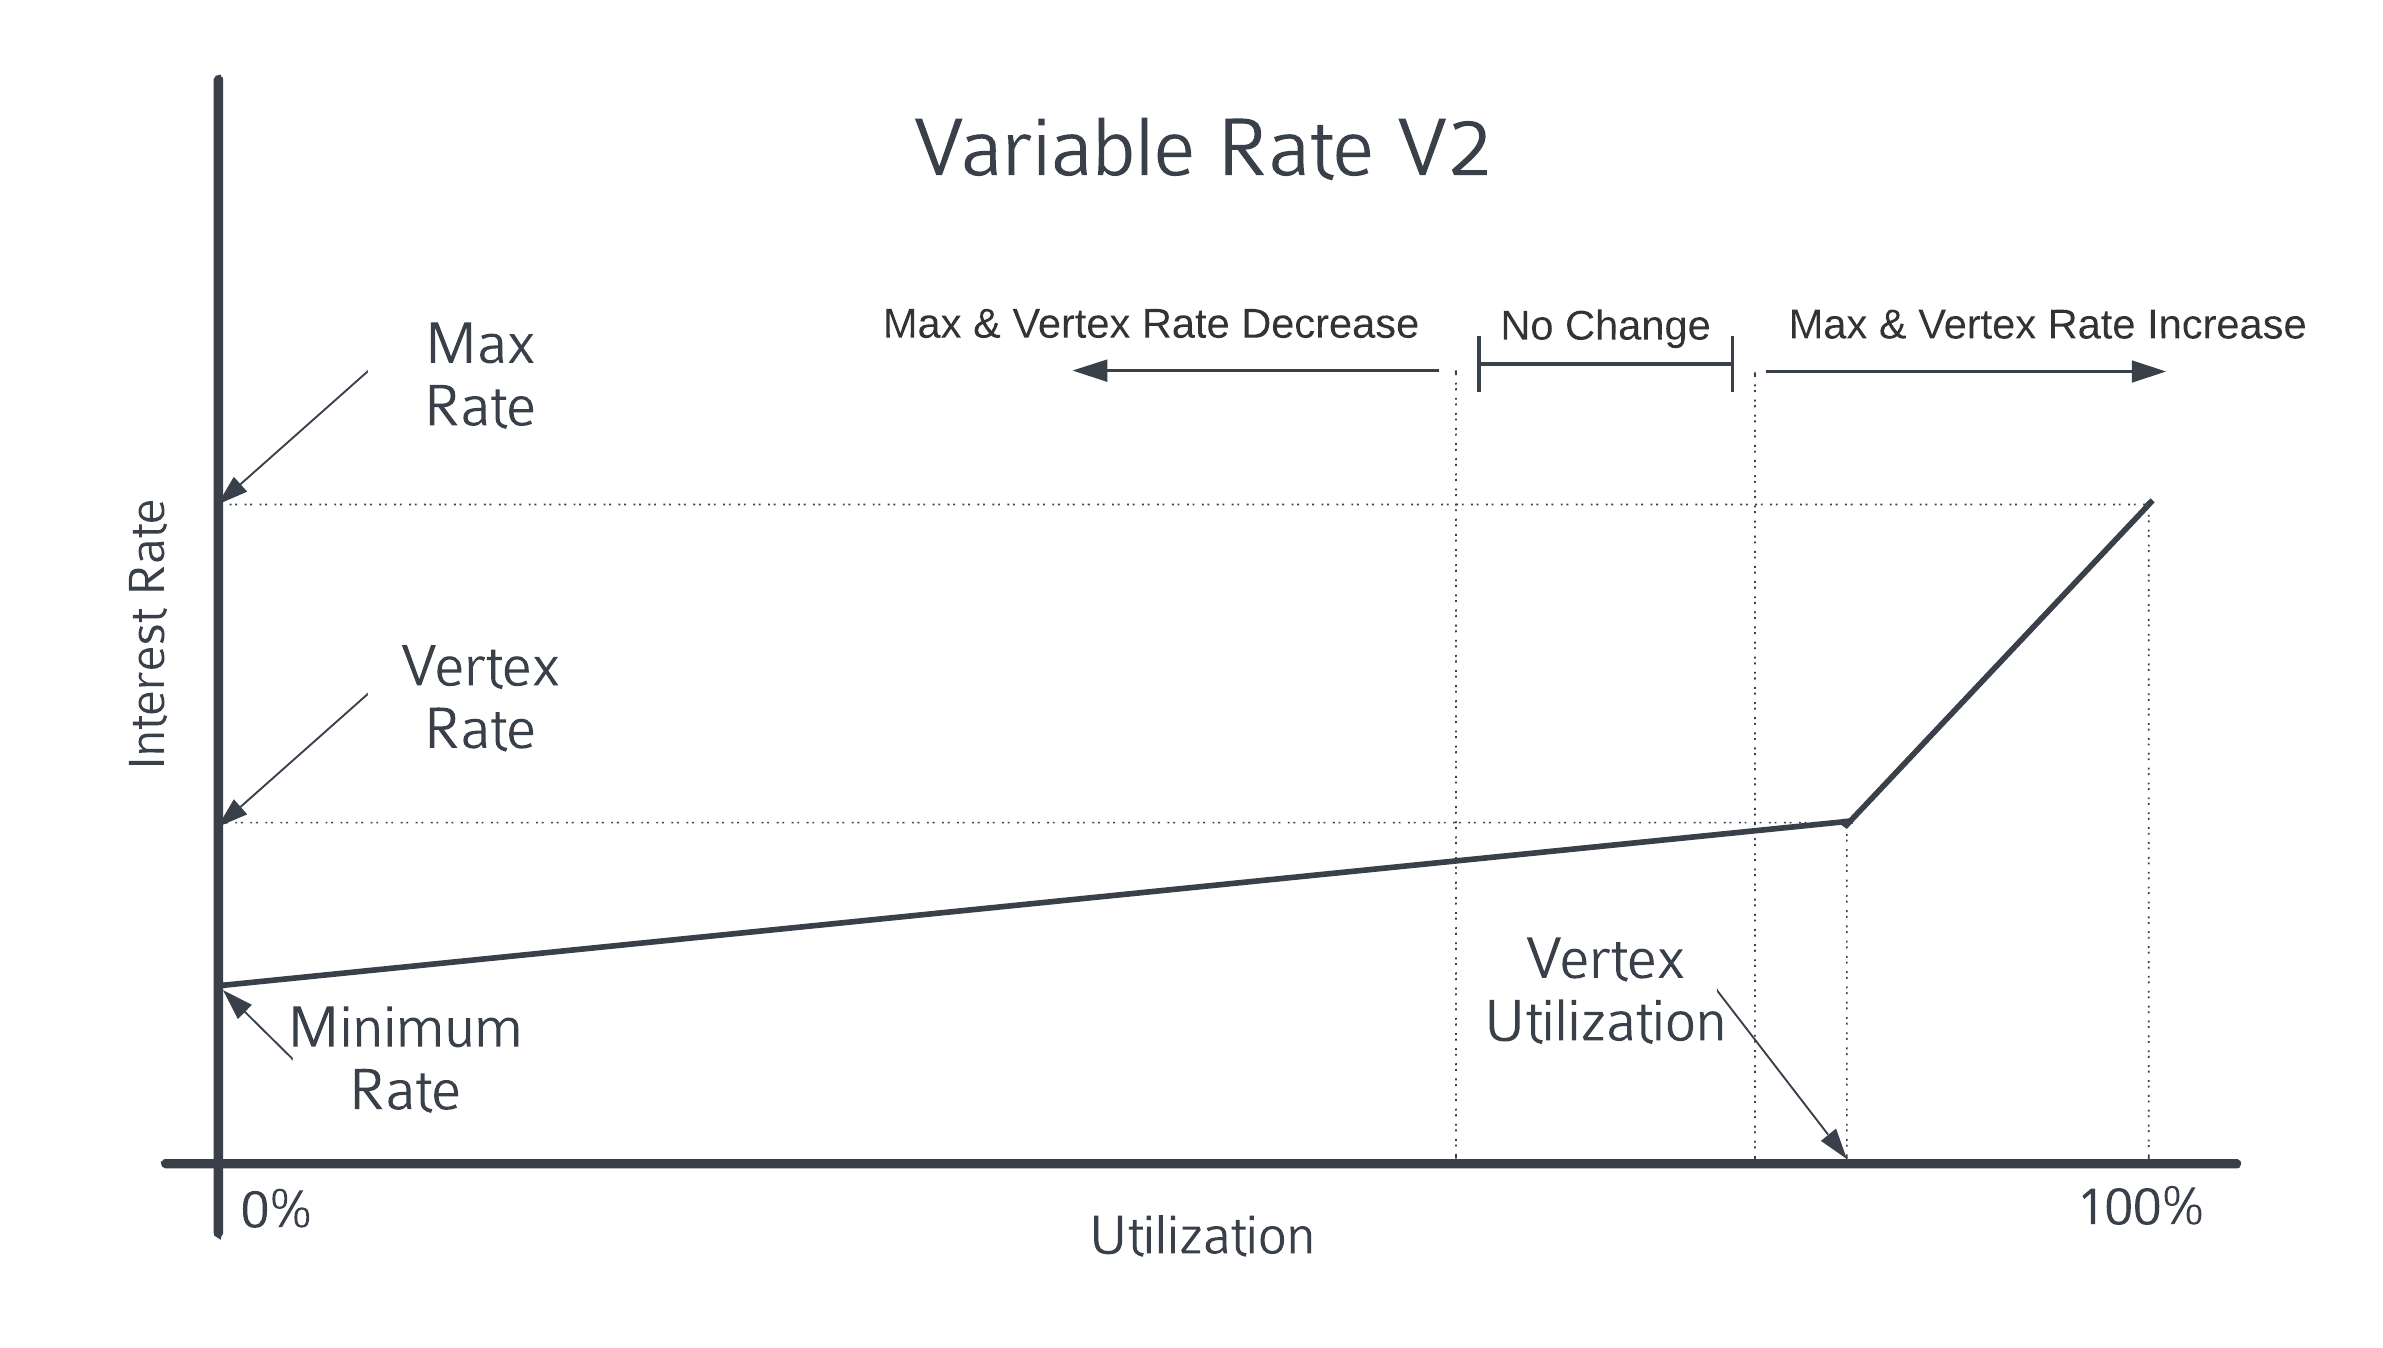
3. Floating Interest Rate V2
Floating Interest Rate V2 combines the concepts of linear interest rate and time-weighted floating interest rate. Specifically, it uses the linear function of the linear interest rate to determine the current interest rate, but adjusts the peak and maximum interest rate using the formula of the time-weighted floating interest rate. Its feature is that the interest rate will immediately respond to changes in the utilization rate on the linear interest rate curve, while adapting to long-term market conditions by adjusting the slope of the linear interest rate curve.
Like the time-weighted floating interest rate, Floating Interest Rate V2 uses parameters for half-life and target utilization rate range. When the utilization rate is low, the peak and maximum interest rates will decrease. If the utilization rate is high, the peak and maximum interest rates will increase.
Reduced/increased interest rates are determined by utilization rate and half-life. If the utilization rate is 0%, then the peak and maximum interest rates will decrease by 50% every half-life. If the utilization rate is 100%, then they will increase by 100% every half-life.
Fraxlend Mechanism Features - Dynamic Debt Reorganization
In a typical lending market, once the LTV exceeds the maximum LTV (usually 75%), liquidators can close the borrower's position. However, in volatile situations, liquidators may not be able to close unhealthy positions before the LTV exceeds 100%. In this case, bad debts may occur, and those who withdraw funds last will bear the greatest losses, turning it into a "game of chicken."
In Fraxlend, when bad debts occur, the pool immediately "socializes" the losses, distributing them to all lenders. This helps maintain market liquidity, even after bad debts occur, without immediately depleting the liquidity of the lending market.
Fraxlend AMO
Fraxlend AMO allows FRAX to be minted into the Fraxlend lending market, allowing anyone to borrow FRAX by paying interest instead of the underlying minting mechanism.
FRAX minted into the money market will not enter circulation unless borrowers over-collateralize through the money market, so this AMO will not reduce the direct collateralization ratio (CR). It helps expand the scale of FRAX and creates a new way for FRAX to enter circulation.
Strategies:
Decollateralize - Mint FRAX into the money market. The minted FRAX does not directly reduce the CR, as all borrowed FRAX is over-collateralized.
Recollateralize - Withdraw minted FRAX from the lending market.
Protocol Revenue - Fees generated by borrowers.
Additionally, because Fraxlend AMO has the ability to "mint" and "burn," it can lower interest rates by minting more FRAX or raise interest rates by burning FRAX. This interest rate adjustment capability is a powerful economic lever, as it changes the cost of borrowing FRAX for all borrowers.
In theory, if Frax is willing and committed, it can mint enough FRAX stablecoins to enter Fraxlend, attracting users to lend FRAX at rates lower than any other stablecoin in the market, creating the best lending rates, and then raising rates through Fraxlend AMO when market response is needed. Stablecoin projects find it difficult to control their lending rates.
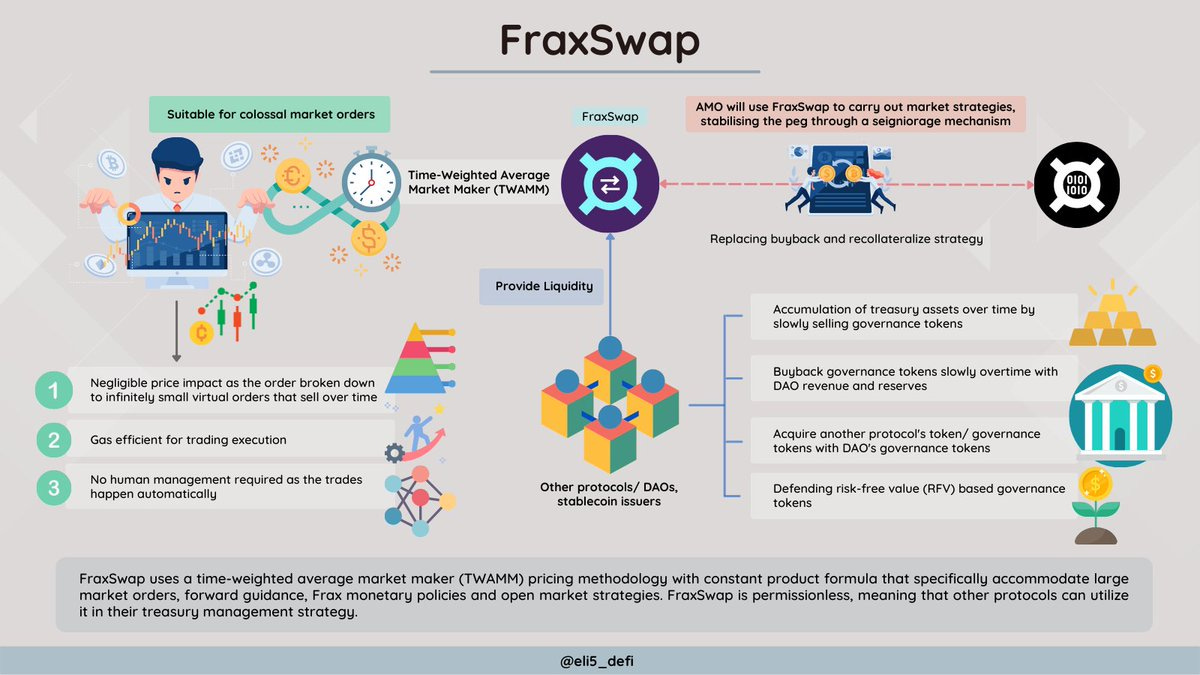
Fraxswap
Fraxswap uses Time-Weighted Average Market Maker (TWAMM) for large trades over a long period without the need for trust. It is completely permissionless, and the core AMM is based on Uniswap V2. TWAMM is detailed in another article: TWAMM Time-Weighted Average Market Maker
FPI (Frax Price Index)
FPI is the first anti-inflation stablecoin, pegged to a real-world basket of goods defined by the average U.S. CPI-U. FPI stablecoin aims to maintain its purchasing power by using on-chain stabilization mechanisms to keep its price constant with all items in the CPI basket. Like the FRAX stablecoin, all FPI assets and market operations are on-chain and use AMO contracts.
FPI uses the unadjusted 12-month inflation rate of the U.S. CPI-U reported by the U.S. federal government: a dedicated Chainlink oracle submits this data on-chain immediately after it is publicly released. The inflation rate reported by the oracle is then applied to the redemption exchange price of the FPI stablecoin. This redemption price grows on-chain every second (or decreases in rare cases of deflation).
FPIS
FPIS is the governance token of the system and also has the right to receive seigniorage from the protocol. Excess revenue will be distributed directly to FPIS holders, similar to the FXS structure.
When the revenue generated by FPI is not sufficient to maintain the increased support for FPI due to inflation, new FPIS tokens may be minted and sold to increase the funding support for FPI.
FPI Stability Mechanism
FPI uses the same type of AMO as the FRAX stablecoin, but its model always maintains a 100% collateralization ratio (CR). This means that to maintain a collateralization ratio of 100%, the protocol's balance sheet must grow at least at the rate of the CPI inflation rate. Therefore, the AMO strategy contract must earn revenue proportional to the CPI, otherwise the CR will drop below 100%. During periods when AMO revenue is lower than the CPI rate, a TWAMM AMO will sell FPIS tokens to exchange for FRAX stablecoins to ensure that the CR remains at 100%. When the CR returns to 100%, the FPIS TWAMM will be removed.
frxETH - Ethereum Collateralized Derivative
Currently, Frax ETH ranks 4th overall in the LSD track, with a TVL of $427.64M and a market share of 2.42%, but it can achieve returns of up to 3.88%, ranking 1st in terms of provided returns. The reason Frax ETH can provide returns higher than the market level also comes from the on-chain liquidity governance resources it holds.
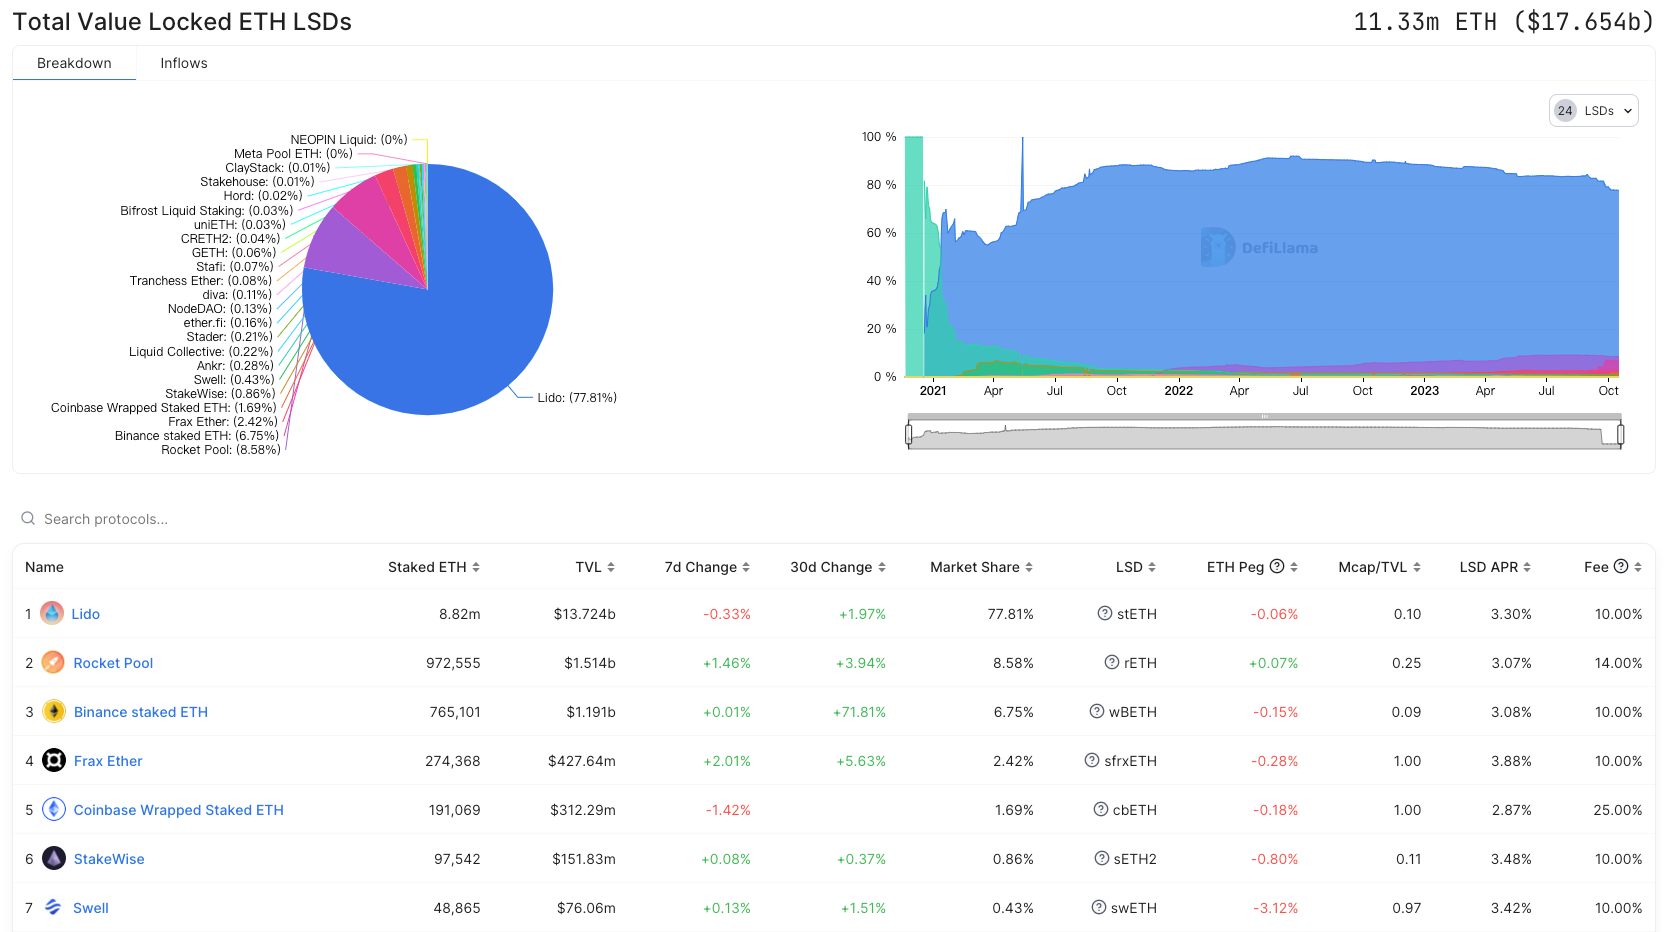
LSD data is from defillama
Frax ETH includes:
frxETH (Frax Ether): An Ethereum stablecoin pegged to ETH, where 1 frxETH always represents 1 ETH, similar to Lido's stETH. However, holding frxETH alone does not undergo rebasing and does not earn Ethereum staking rewards.
sfrxETH (Staked Frax Ether): sfrxETH is an ERC-4626 vault designed to accumulate staking rewards from Frax ETH validators. At any time, frxETH can be exchanged for sfrxETH by depositing it into the sfrxETH vault, allowing users to earn staking rewards on frxETH. Over time, as validators accumulate staking rewards, an equivalent amount of frxETH is minted and added to the vault, allowing users to exchange their sfrxETH for more frxETH than they initially deposited. Therefore, theoretically, the exchange rate of sfrxETH to frxETH will always increase over time, and by holding sfrxETH, users have a claim to a percentage of the increasing amount of frxETH in the vault. This is similar to the principle of Aave's aDAI.
How does Frax ETH raise interest rates above the market average?
Frax has accumulated a large amount of CRV and CVX governance resources in the market through AMO, and has built the frxETH Pool in Curve and Convex, allowing frxETH to receive incentives in third-party liquidity markets without increasing its own token FXS, while all Ethereum staking rewards are covered by sfrxETH.
Assuming that out of the 270,000 ETH staked in Frax ETH, 100,000 ETH is not staked in sfrxETH but is pooled in liquidity markets with other Ethereum assets such as WETH, stETH, etc., and the remaining 170,000 ETH is staked in sfrxETH. The incentives received are:
The 100,000 ETH in Curve, Convex, and other liquidity pools receive CRV and CVX incentives.
The 170,000 ETH staked as sfrxETH receives staking rewards for the entire 270,000 ETH.
Therefore, by utilizing its on-chain liquidity governance resources, Frax ETH has introduced external incentives for frxETH, increasing overall returns and indirectly raising the market interest rate of LSD (sfrxETH).
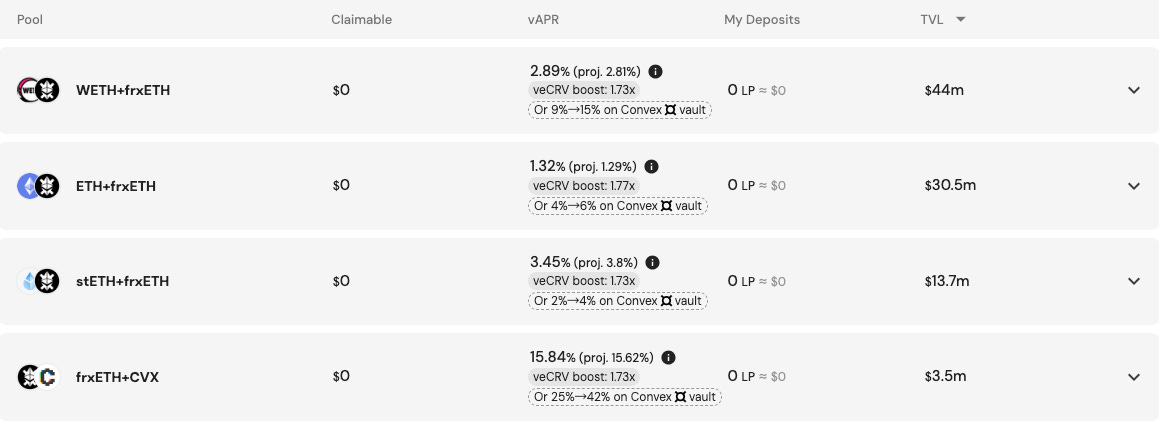
The frxETH Pool is sourced from Convex
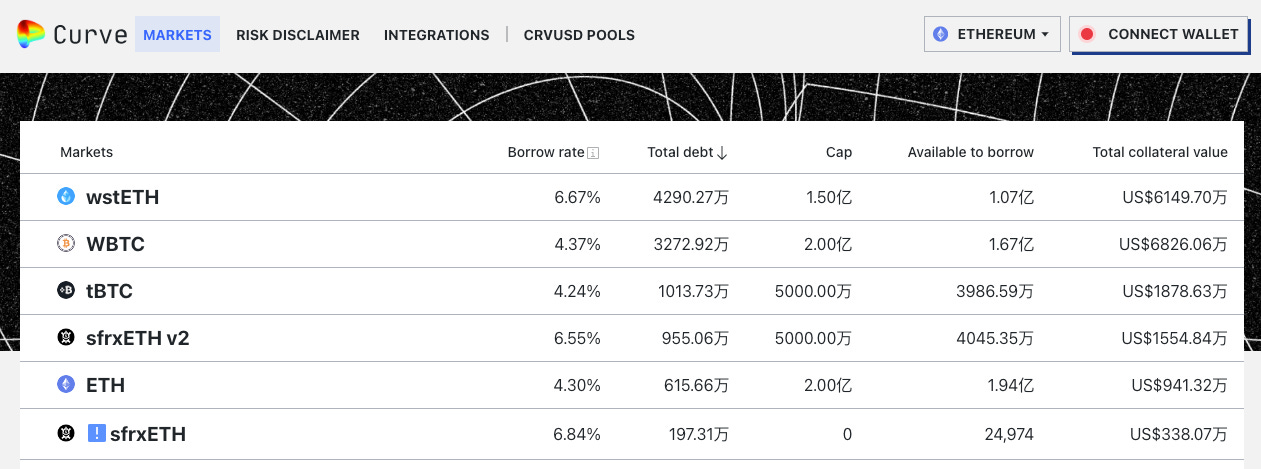
crvUSD supports sfrxETH as collateral
Frax Shares (FXS)
Funding
Frax Finance has conducted two rounds of funding in July and August 2021, with a total of 12% of the token supply allocated for funding. However, the funding amount and valuation were not disclosed.
Investors in Frax Finance include well-known investment institutions such as Parafi, Dragonfly, Mechanism, Galaxy Digital, as well as prominent DeFi project founders such as Stani Kulechov of Aave, Robert Leshner of Compound, Kain Warwick of Synthetix, Eyal Herzog of Bancor, and investors from CEX backgrounds such as Crypto.com and Balaji Srinivasan (former Coinbase CTO and A16Z partner).
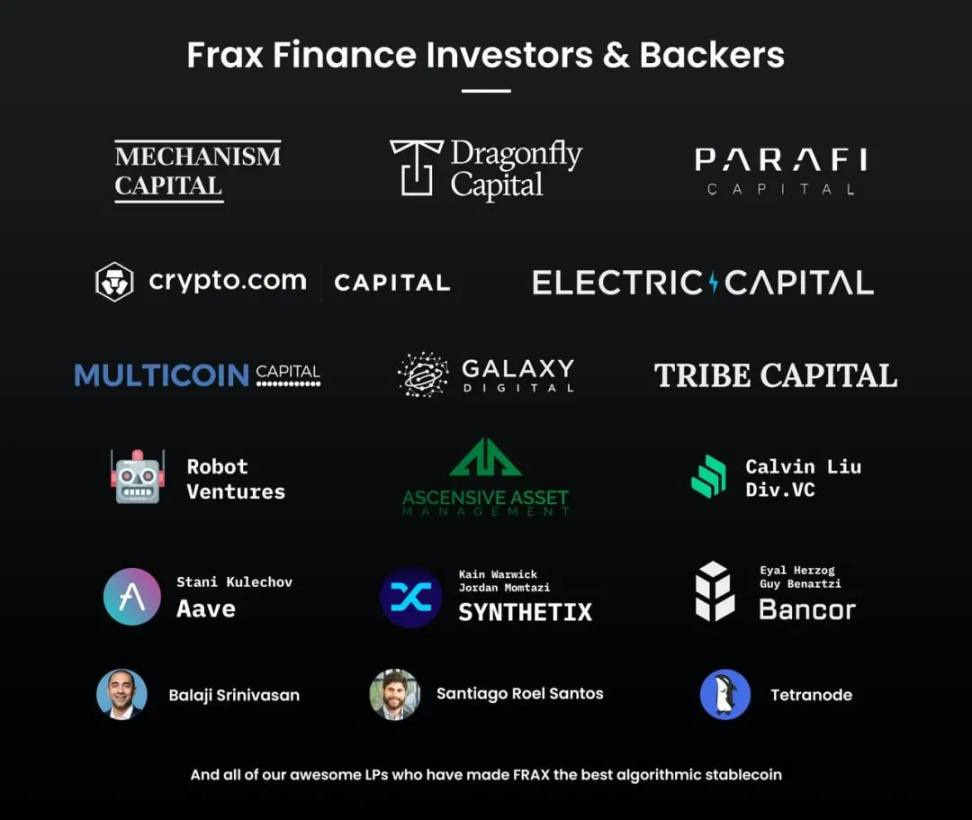
Frax Finance Investors
Token Allocation
60% – Liquidity Program/Farming/Community – Halved naturally every 12 months through governance
5% – Project Treasury/Grants/Partnerships/Bug Bounties – Decided by the team and community
20% – Team/Founders/Early Project Members – 12 months, with a 6-month cliff
3% – Strategic Advisors/External Early Contributors – 36 months
12% – Accredited Private Investors – 2% unlocked at launch, 5% vested within the first 6 months, 5% vested within 1 year, with a 6-month cliff
Currently, the circulating supply of FXS is 74.57M out of a total supply of 100M. The team, advisors, and external investors are fully unlocked, and the non-circulating portion is entirely for the community (liquidity program/treasury).
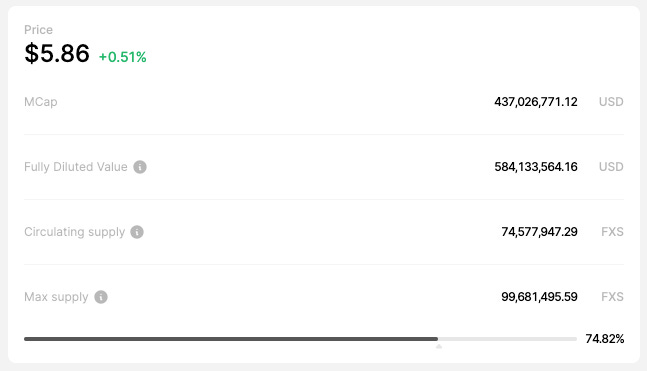
FXS Market Cap and Circulating Supply Data
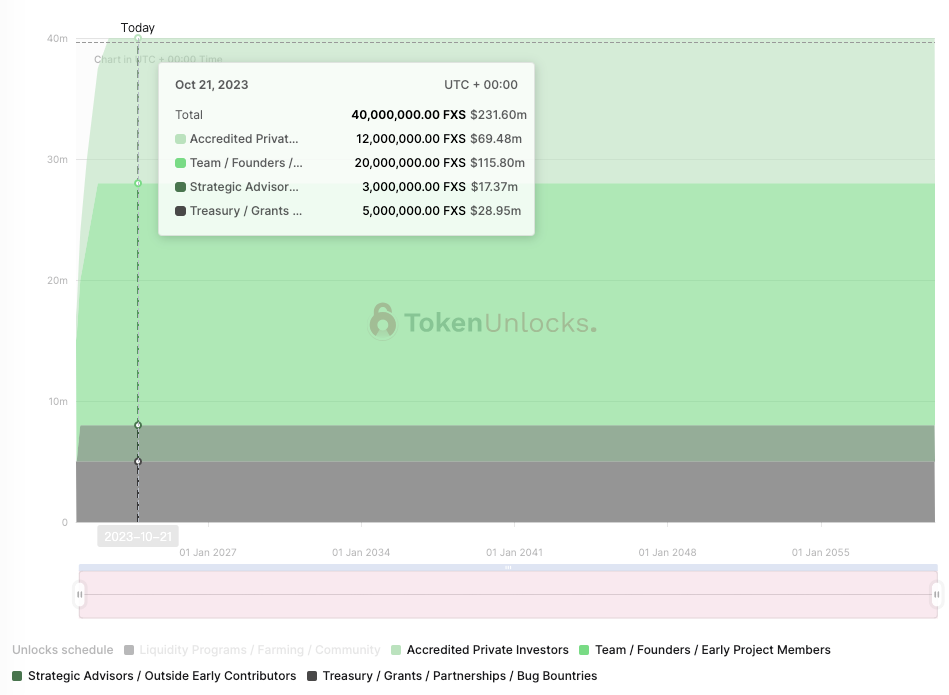
FXS Unlock Data from TokenUnlocks
veFXS Token Economics
veFXS is a ownership and reward system based on the Curve veCRV mechanism. Users can lock their FXS for up to 4 years to earn veFXS. veFXS is not a transferable token and does not trade on the open market.
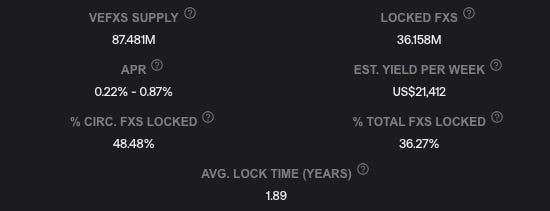
Currently, 36.15M veFXS is locked, accounting for 48.48% of the circulating supply.
As the tokens approach the end of their lockup period, the veFXS balance linearly decreases, approaching a 1:1 ratio with each FXS as the remaining lockup time reaches zero. This encourages long-term staking and an active community.
Each veFXS has 1 voting power in governance proposals. Staking 1 FXS for the longest period (4 years) will generate 4 veFXS. The veFXS balance itself will slowly decay to 1 veFXS after 4 years, at which point users can redeem veFXS for FXS.
Gauge
Similar to the power of veCRV in the Curve system, veFXS can determine the emission incentives in the liquidity pools supported by Frax through voting.
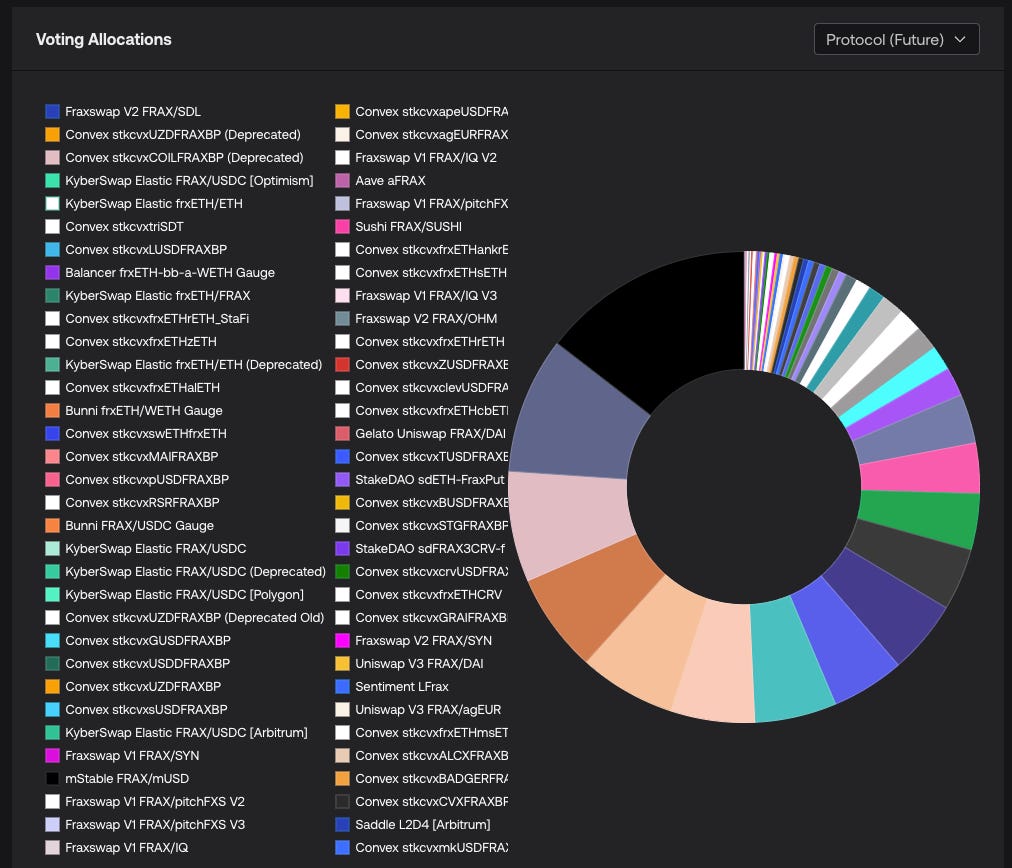
Gauge
Buyback
The primary cash flow allocation mechanism of the Frax protocol is directed towards veFXS holders. Cash flows earned from AMO, Fraxlend loans, and Fraxswap fees are typically used to buy back FXS from the market, which is then distributed as earnings to veFXS stakers.
However, with strategic adjustments in Frax v2 and v3, the protocol will prioritize raising the CR to 100%, so buybacks may be paused or restricted. Once the CR reaches 100%, veFXS will have the opportunity to capture all protocol income.
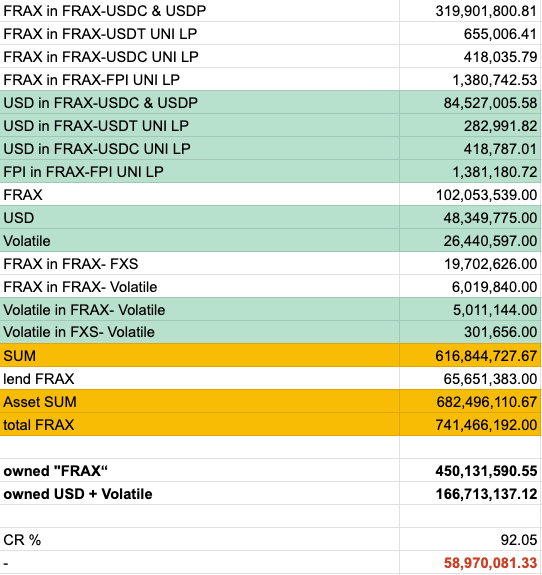
Real Collateralization Ratio Analysis
We have reorganized Frax's balance sheet (as of 2023.10.10), with total protocol-held assets amounting to 616.8M, including:
Total protocol-held FRAX amounting to 450.1M
USD and other assets totaling 166.7M
In addition, there are 65.6M FRAX lent out in Fraxlend (overcollateralized), and the total FRAX issuance (total circulating supply) is 741.4M, resulting in a collateralization ratio of 92.05%.
CR= Asset SUM / total FRAX
If we remove the protocol-held FRAX from both the asset and liability sides, the collateralization ratio value will decrease, but the absolute value of the collateralization ratio gap will not change significantly. This absolute value is currently approximately 58.97M.
From here, we can see:
Frax leverages 166.7M of underlying assets through AMO strategies without breaking the peg. (If using the traditional 1:1 issuance ratio, the circulating supply of FRAX equals the value of underlying assets, 166.7M)
To achieve a CR of 100%, the protocol needs to earn 58.9M in income for the treasury.
Frax's Profitability
Currently, most of Frax's profits come from AMO:
Curve, Convex AMO yield 2%-8%
Fraxlend AMO yield 2%-6%
RWA yield 5.5%
sDAI yield 5%
Convex AMO Annualized Yield
From two perspectives, we can estimate how long it will take for the protocol to reach a CR of 100%, using an average AMO yield of 5% APY:
If all AMO-controlled assets are maximally utilized
680M*5%=34MIf most of the AMO "printing" funds are reclaimed (current state)
200M*5%=10M
In other words, in the current market environment, it will take approximately 2-6 years to achieve a CR of 100% relying on AMO yields. Of course, since most of the income in AMO comes from CRV and CVX tokens, if the market conditions improve and the CRV and CVX tokens appreciate, this process will be accelerated.
1. Assessing the Impact of CRV and CVX Appreciation on CR
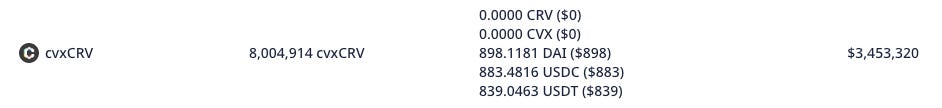
Currently, Frax holds 8M CRV (~$3.4M) and 3.7M CVX (~$9.8M)

If the prices of CRV and CVX increase by 4 times from the current levels, the CR can directly rise to nearly 100%.
CRV $0.44 → $1.76
CVX $2.68 → $10.72
2. Impact of RWA Business on CR
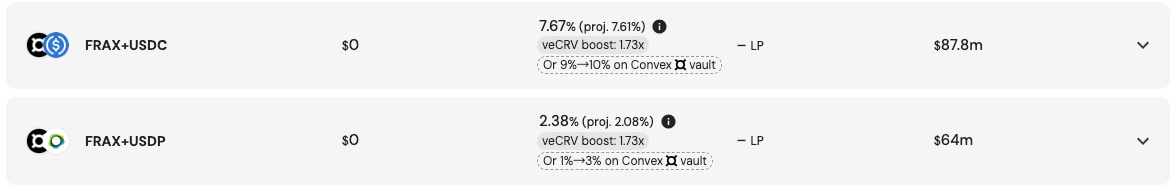
In Frax v3, sFRAX was introduced to capture the yield of real-world assets, which is a standout track in DeFi during the bear market. Currently, the yield calculation for sFRAX tracks the IORB rate, and 50K FRAX is pre-deposited every Wednesday to pay the current sFRAX yield. The total annual yield is 50K * 52 = 2.6M, calculated with an actual annualized RWA yield of 5.5%. Frax will need to deploy at least 2.6M / 5.5% = 47M USD assets to RWA. (This data is estimated based on the current yield situation and may change in the future with IORB fluctuations).
When the deposits in the sFRAX contract are below 26M, the annualized yield of sFRAX will be 10%, gradually decreasing as more FRAX is deposited.
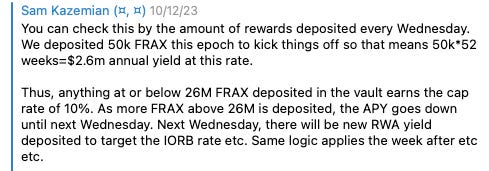
From Frax founder Sam
Currently, the potential income of the Frax Finance protocol in the RWA business is to deploy AMO funds here to earn income. Additionally, in the future, Frax may charge fees or protocol dividends for the income from RWA. Once the scale of Frax's RWA business grows, and the protocol charges fees or dividends for this portion of the profit, it will greatly accelerate the process of reaching CR = 100%.
3. Impact of Frax ETH Business on CR
The current income from Frax ETH is $1.31M per year, compared to Lido's profitability of $55.46M per year. Based on the current situation, the income from Frax ETH has a relatively small impact on CR. However, there is significant potential for growth in the LSD track. Once Lido's dominant position is challenged, other protocols will experience significant growth.
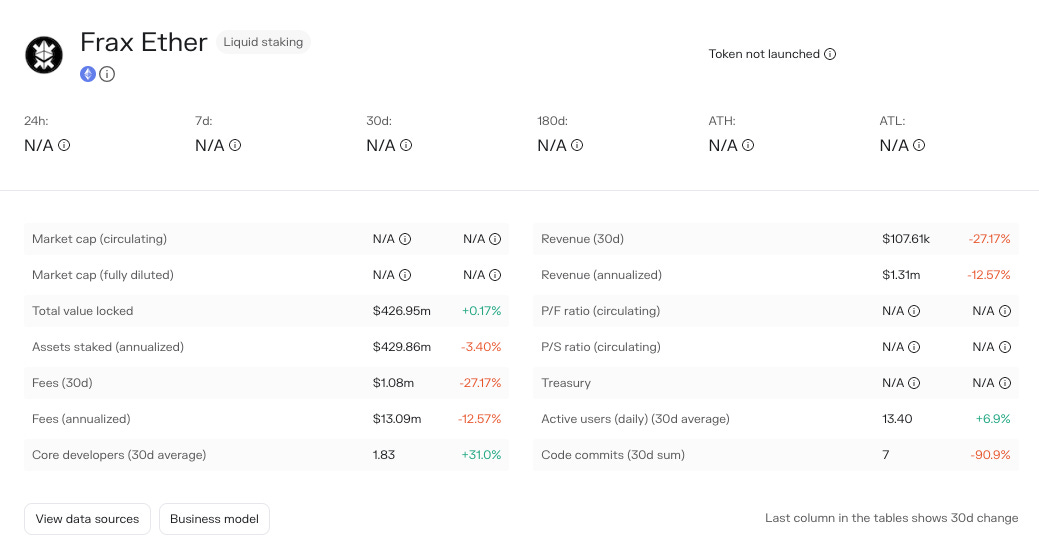
Frax ETH data from Tokenterminal
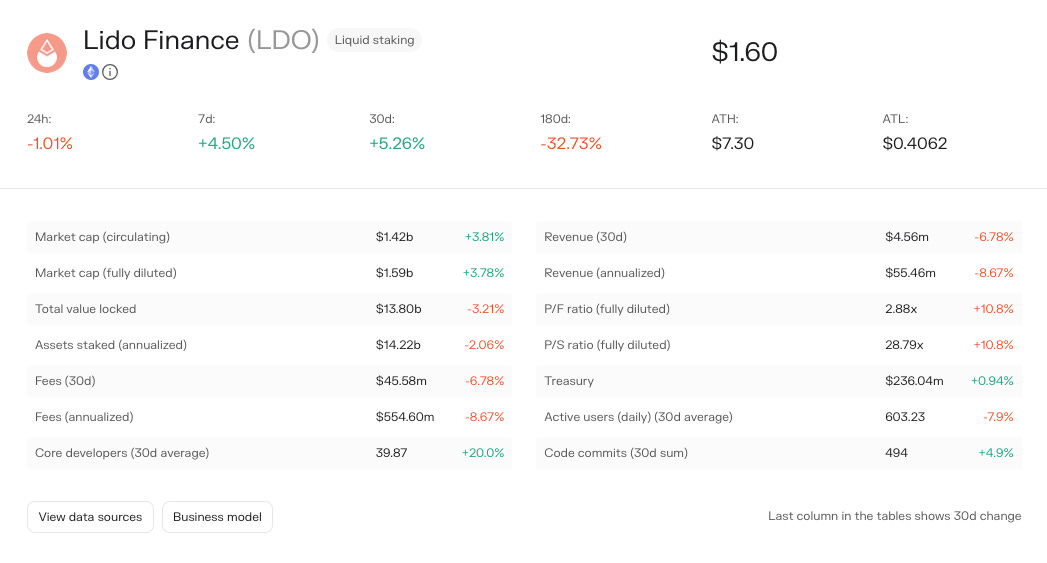
Lido data from Tokenterminal
Summary
Overall, a conservative estimate suggests that it will take 2-6 years for the CR to reach 100% in the current situation, with a significant margin of fluctuation, primarily depending on how Frax utilizes its AMO.
From a relatively optimistic perspective, a significant increase in CRV and CVX prices would greatly help speed up the CR, but at that time, Frax will also face a dilemma of whether to sell these tokens to ensure CR or hold and lock CRV and CVX, which would provide on-chain liquidity governance resources. Selling would immediately boost CR but could lead to loss of on-chain incentive measures.
From a business potential perspective, the current growth of the RWA business is a key factor driving the increase in CR. MakerDAO has already absorbed a significant amount of USD liquidity through sDAI. If sFRAX gradually gains market acceptance, its growth potential far exceeds that of other businesses. If Frax chooses to allocate a portion of RWA income to the treasury to continuously increase CR, the process of reaching CR = 100% will be greatly accelerated.
So from an investment perspective, we should focus on the following indicators:
Utilization and profitability of all AMOs
Prices of CRV and CVX tokens
Growth of the RWA business and whether the protocol treasury can receive dividends
Frax has built a sufficiently large full-stack stablecoin system. Regardless of whether it's Fraxswap, Fraxlend, or other services, they all serve Frax Finance itself, similar to the subDAO in MakerDAO's endgame plan:
The similarity is that both MakerDAO and Frax plan to horizontally expand around their core (stablecoin) to build a full-stack product.
The difference is that MakerDAO decides to outsource these functions to other subDAOs, while Frax is governed by frxGov.
The advantage is that Frax has captured almost all the right needs in the DeFi market, with a high ceiling and forward-looking mechanism design. However, the potential problem is that such a huge system covering stablecoins, trading systems, lending systems, cross-chain systems, LSD, and potentially the upcoming Frax Chain Layer2, requires a very efficient and sound governance module. Risk isolation between functions is also crucial, testing the stability of future protocol functions and on-chain governance.
免责声明:本文章仅代表作者个人观点,不代表本平台的立场和观点。本文章仅供信息分享,不构成对任何人的任何投资建议。用户与作者之间的任何争议,与本平台无关。如网页中刊载的文章或图片涉及侵权,请提供相关的权利证明和身份证明发送邮件到support@aicoin.com,本平台相关工作人员将会进行核查。


