Author: CoinGlass
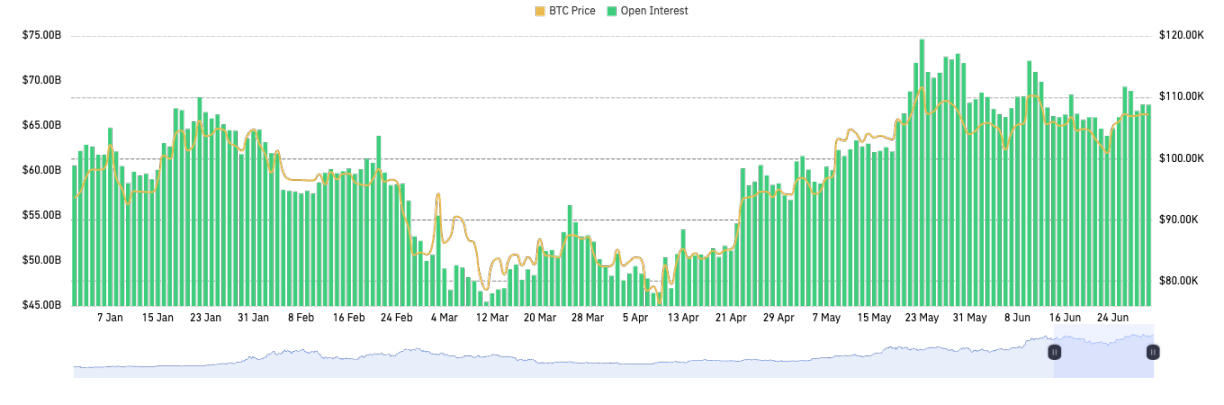
In the first half of 2025, the global macro environment continued to be turbulent. The Federal Reserve paused interest rate cuts multiple times, reflecting that its monetary policy has entered a "wait-and-see tug-of-war" phase, while the Trump administration's increased tariffs and escalating geopolitical conflicts further tore apart the global risk appetite structure. Meanwhile, the cryptocurrency derivatives market continued the strong momentum from the end of 2024, with the overall scale reaching new highs. After BTC broke through the historical high of $111K at the beginning of the year and entered a consolidation phase, the global BTC derivatives open interest (OI) saw significant growth, with the overall open interest rising from about $60 billion to over $70 billion by June. As of June, although the BTC price remained relatively stable around $100K, the derivatives market experienced multiple rounds of long and short liquidations, with leveraged risks being released, resulting in a relatively healthy market structure.
This report looks ahead to Q3 and Q4, expecting that under the influence of the macro environment (such as changes in U.S. interest rate policy) and institutional capital, the derivatives market will continue to expand, volatility may remain convergent, and risk indicators need to be continuously monitored, maintaining a cautiously optimistic attitude towards the continued rise in BTC prices.
Market Overview
Market Summary
In the first and second quarters of 2025, BTC prices experienced significant volatility. At the beginning of the year, BTC prices reached a high of $110K in January, then fell back to around $75K in April, a decline of about 30%. However, with improved market sentiment and sustained interest from institutional investors, BTC prices climbed again in May, reaching a peak of $112K. By June, the price stabilized around $107K. At the same time, BTC's market share continued to strengthen in the first half of 2025. According to Tradingview data, BTC's market share reached 60% at the end of the first quarter, the highest level since 2021, and this trend continued into the second quarter, with market share exceeding 65%, indicating a preference among investors for BTC.
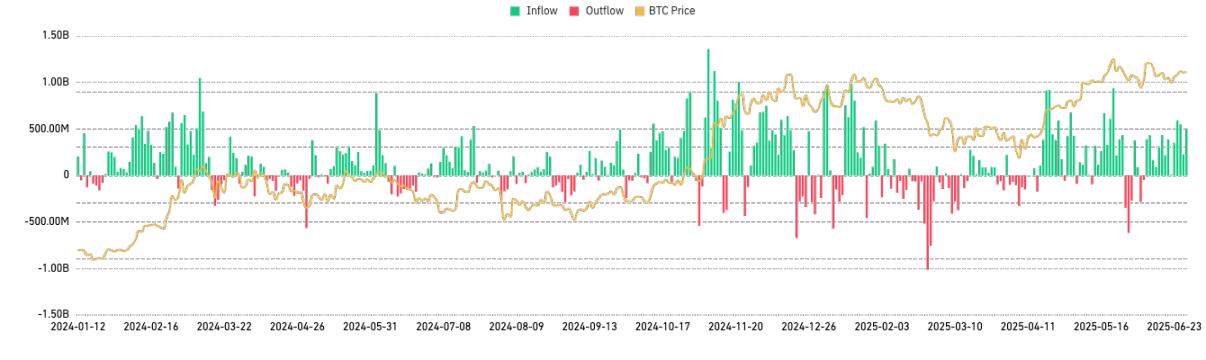
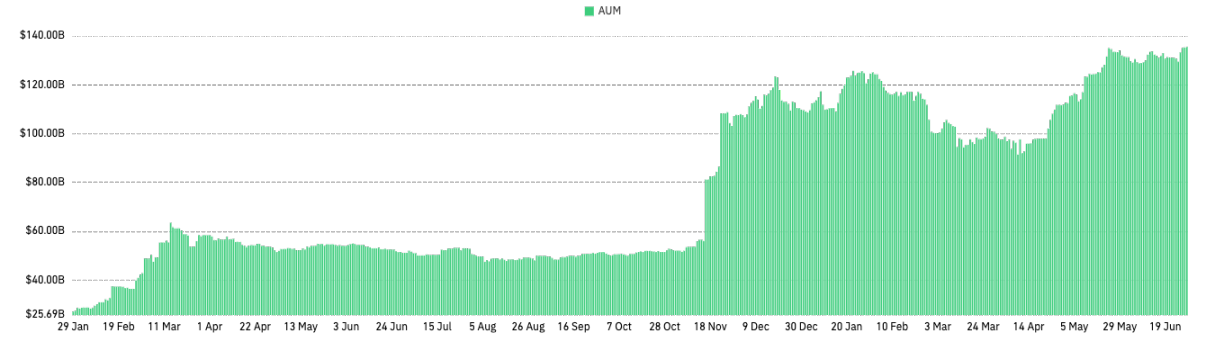
At the same time, institutional interest in BTC continued to grow, with BTC spot ETFs showing a continuous inflow trend, and their total assets under management exceeding $130 billion. Additionally, some global macroeconomic factors, such as the decline of the U.S. dollar index and distrust in the traditional financial system, have also enhanced BTC's appeal as a store of value.
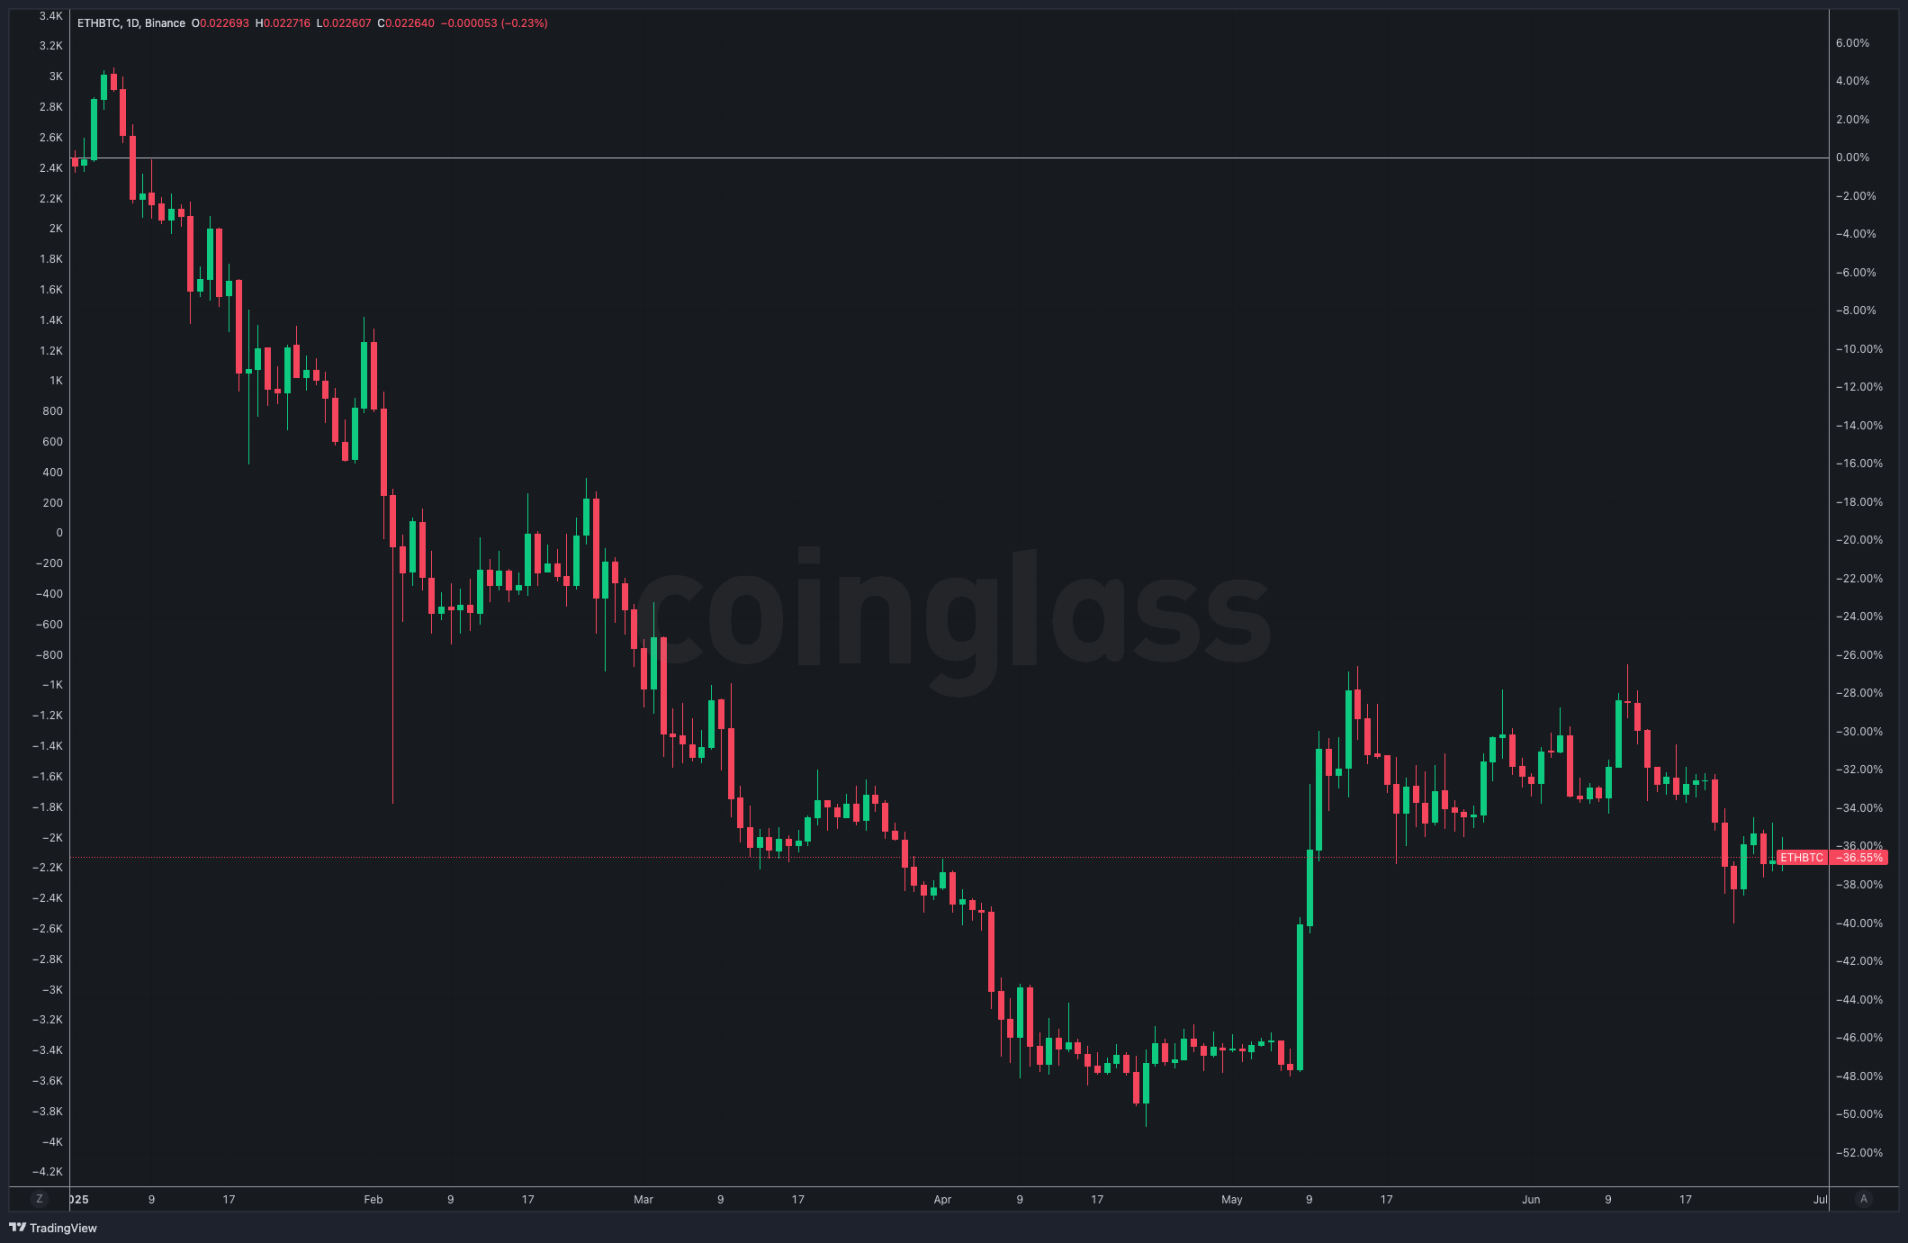
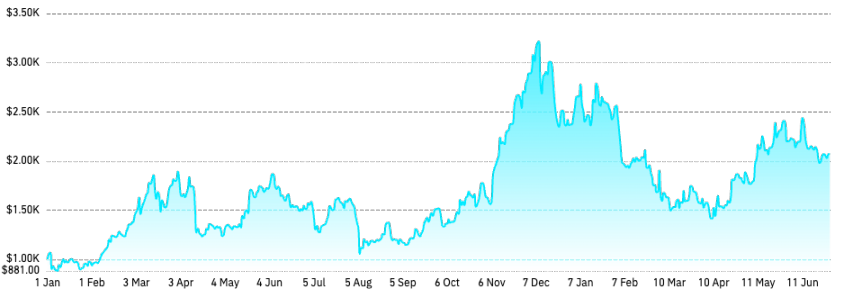
In the first half of 2025, ETH's overall performance was disappointing. Although ETH prices briefly touched around $3,700 at the beginning of the year, they subsequently experienced a significant decline. By April, ETH had fallen below $1,400, a drop of over 60%. The price recovery in May was limited; even with the release of technical benefits (such as the Pectra upgrade), ETH only rebounded to about $2,700, failing to recover the early-year high. As of June 1, ETH prices stabilized around $2,500, down nearly 30% from the early-year high, showing no strong signs of sustained recovery.
The divergence between ETH and BTC was particularly evident. Against the backdrop of BTC's rebound and continued market dominance, ETH not only failed to rise in tandem but also showed significant weakness. This phenomenon was reflected in the notable decline of the ETH/BTC ratio, which fell from 0.036 at the beginning of the year to a low of about 0.017, a drop of over 50%. This divergence reveals a significant decline in market confidence in ETH. It is expected that in the third to fourth quarters of 2025, as the staking mechanism for ETH spot ETFs is approved, market risk appetite may rebound, and overall sentiment is expected to improve.
The overall performance of the altcoin market was even more pronouncedly weak. CoinGlass data shows that some mainstream altcoins, represented by Solana, although briefly surged at the beginning of the year, subsequently experienced continuous pullbacks. SOL fell from a high of about $295 to a low of around $113 in April, a decline of over 60%. Most other altcoins (such as Avalanche, Polkadot, ADA) also experienced similar or larger declines, with some altcoins even dropping more than 90% from their highs, indicating an increased risk aversion sentiment towards high-risk assets in the market.
In the current market environment, BTC's position as a risk-averse asset has been significantly strengthened, with its attributes shifting from "speculative asset" to "institutional allocation asset/macroeconomic asset," while ETH and altcoins remain primarily "crypto-native capital, retail speculation, and DeFi activities," positioning them more like tech stocks. The ETH and altcoin markets have continued to show weakness due to reduced capital preferences, increased competitive pressure, and the impact of macro and regulatory environments. Aside from a few public chains (like Solana) that continue to expand their ecosystems, the overall altcoin market lacks significant technological innovation or new large-scale application scenarios to effectively attract sustained investor attention. In the short term, due to liquidity constraints at the macro level, if there are no new strong ecological or technological drivers, the ETH and altcoin markets will struggle to significantly reverse their weak trends, and investor sentiment towards altcoins remains cautious and conservative.
BTC/ETH Derivatives Positions and Leverage Trends
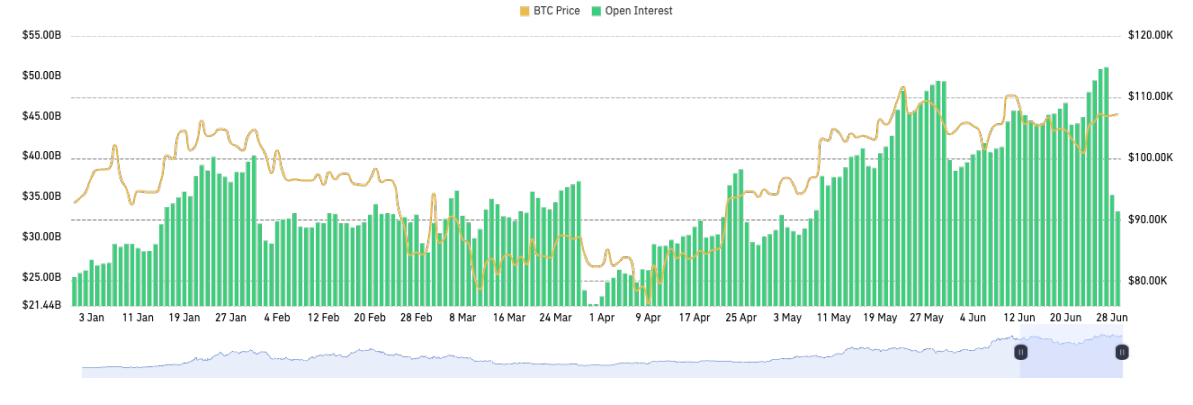
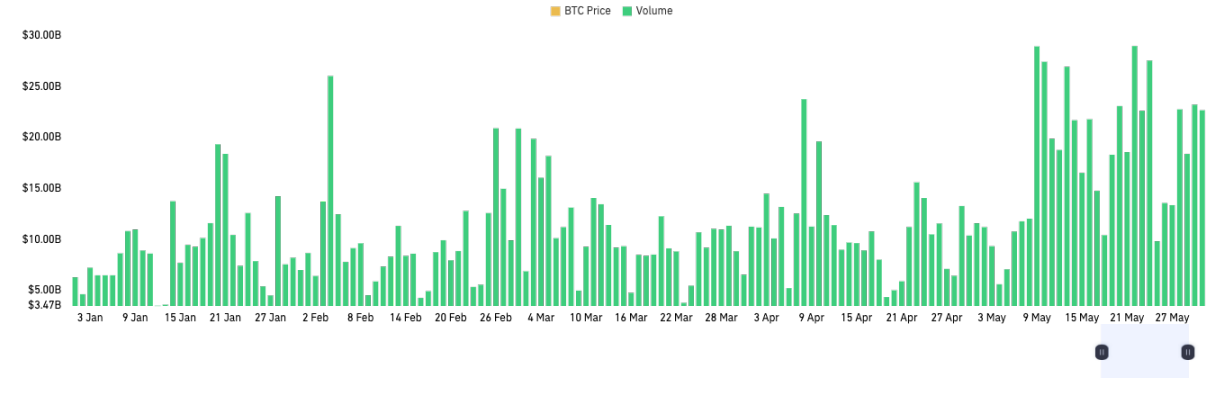
The total open interest for BTC reached a new high in the first half of 2025, driven by massive capital inflows into spot ETFs and strong demand for futures, with BTC futures OI further climbing, surpassing $70 billion in May.
Notably, the share of traditional regulated exchanges like CME has rapidly increased. As of June 1, CoinGlass data shows that CME BTC futures open interest reached 158,300 BTC (approximately $16.5 billion), ranking first among all exchanges, surpassing Binance's 118,700 BTC (approximately $12.3 billion) during the same period. This reflects that institutions are entering the market through regulated channels, with CME and ETFs becoming important increments. Binance remains the largest exchange in terms of open interest, but its market share has been diluted.
For ETH, similar to BTC, its total open interest also reached a new high in the first half of 2025, surpassing $30 billion in May. As of June 1, CoinGlass data shows that Binance ETH futures open interest reached 2.354 million ETH (approximately $6 billion), ranking first among all exchanges.
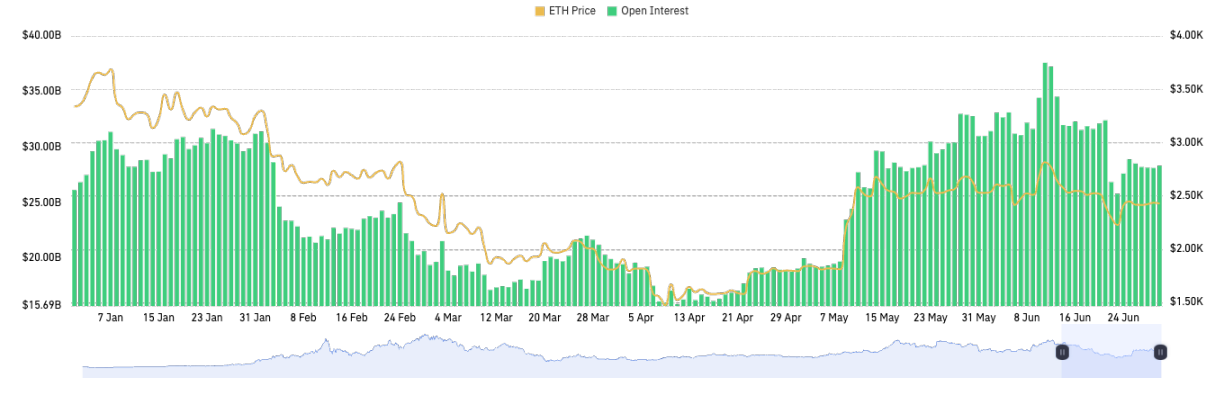
Overall, the use of leverage by exchange users in the first half of the year has become more rational. Although the total open interest in the market has risen, multiple rounds of severe volatility have cleared excessive leveraged positions, and the average leverage ratio for exchange users has not spiraled out of control. Especially after the market fluctuations in February and April, exchange margin reserves remained relatively ample, and although the overall market leverage ratio indicators occasionally reached peaks, they did not show a sustained upward trend.
CoinGlass Derivatives Index (CGDI) Analysis
The CoinGlass Derivatives Index (CGDI) is an index that measures the price performance of the global cryptocurrency derivatives market. Currently, over 80% of the trading volume in the crypto market comes from derivatives contracts, while mainstream spot indices do not effectively reflect the core pricing mechanism of the market. CGDI dynamically tracks the prices of the top 100 mainstream cryptocurrency perpetual contracts by open interest and combines their open interest for value weighting, constructing a highly representative indicator of the derivatives market trend in real-time.
In the first half of the year, CGDI exhibited a divergence from BTC prices. At the beginning of the year, BTC surged under institutional buying pressure, maintaining prices near historical highs, but CGDI began to decline from February—this drop was due to the weak prices of other mainstream contract assets. Since CGDI is weighted by the OI of mainstream contract assets, while BTC was performing strongly, ETH and altcoin futures failed to strengthen in tandem, dragging down the overall index performance. In short, in the first half of the year, capital clearly concentrated on BTC, which remained strong mainly supported by institutional long-term accumulation and the spot ETF effect, leading to an increase in BTC's market share, while the speculative enthusiasm in the altcoin sector cooled and capital flowed out, causing CGDI to decline while BTC prices remained high. This divergence reflects a change in investor risk appetite: favorable ETF news and risk-averse demand led capital to flow into high market cap assets like BTC, while regulatory uncertainty and profit-taking pressured secondary assets and the altcoin market.
CoinGlass Derivatives Risk Index (CDRI) Analysis
The CoinGlass Derivatives Risk Index (CDRI) is an indicator that measures the risk intensity of the cryptocurrency derivatives market, quantifying the current level of leverage usage, trading sentiment, and systemic liquidation risk. CDRI focuses on forward-looking risk warnings, issuing alerts in advance when market structures deteriorate, even if prices are still rising, it will show a high-risk state. This index conducts weighted analysis across multiple dimensions, including open interest, funding rates, leverage multiples, long-short ratios, contract volatility, and liquidation volumes, to construct a real-time risk profile of the cryptocurrency derivatives market. CDRI is a standardized risk scoring model ranging from 0 to 100, with higher values indicating that the market is closer to overheating or a fragile state, making it prone to systemic liquidation events.
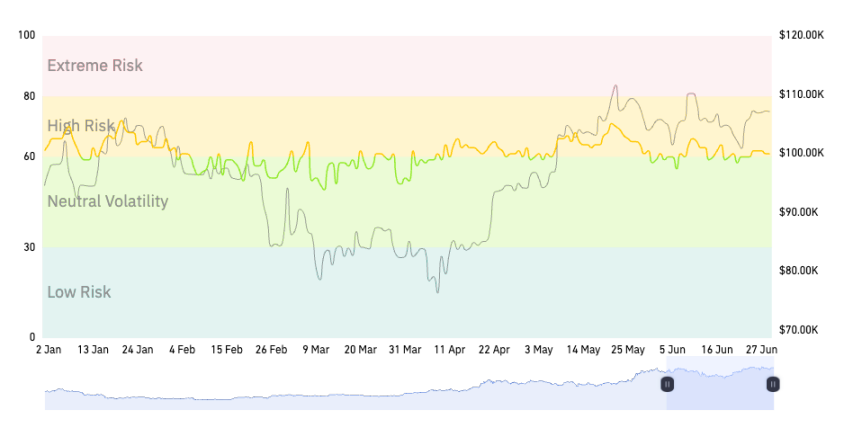
The CoinGlass Derivatives Risk Index (CDRI) maintained a generally neutral to slightly high level in the first half of the year. As of June 1, the CDRI was at 58, within the "medium risk / volatility neutral" range, indicating that the market did not show significant overheating or panic, and short-term risks were manageable.
II. Cryptocurrency Derivatives Data Analysis
Perpetual Contract Funding Rate Analysis
The changes in funding rates directly reflect the use of leverage in the market. A positive funding rate typically indicates an increase in long positions, suggesting bullish market sentiment; while a negative funding rate may indicate rising short pressure, leading to a more cautious market sentiment. The fluctuations in funding rates signal to investors the need to pay attention to leverage risks, especially during rapid changes in market sentiment.
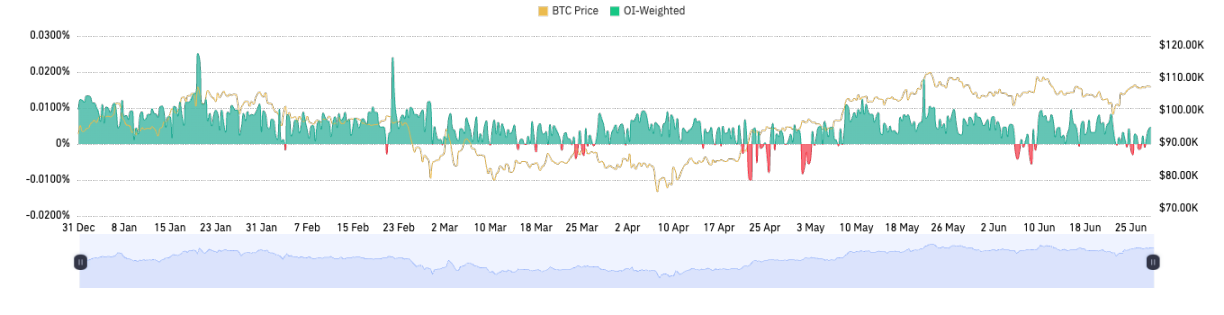
In the first half of 2025, the cryptocurrency perpetual contract market showed a dominant bullish trend, with funding rates being positive most of the time. The funding rates for major crypto assets remained positive and above the 0.01% benchmark level, indicating a generally bullish market. During this period, investors held an optimistic view of the market outlook, driving an increase in long positions. As long positions became crowded and profit-taking pressure increased, BTC experienced a pullback in mid to late January, and the funding rate returned to normal.
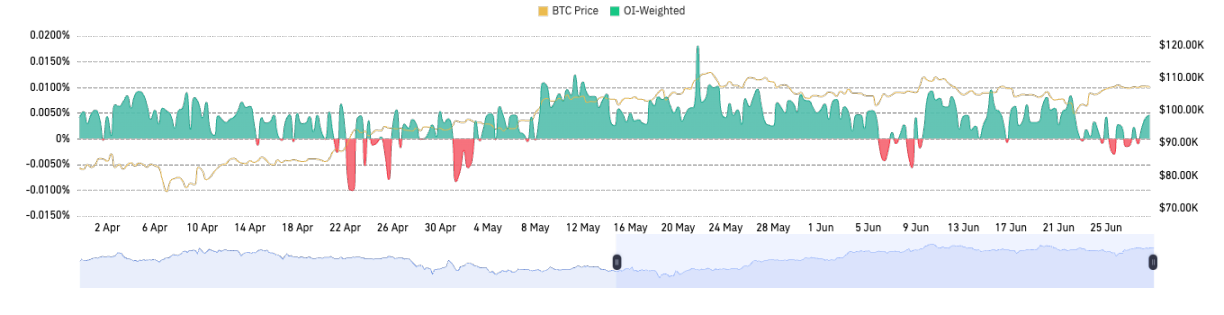
Entering the second quarter, market sentiment rationally returned, with funding rates mostly maintaining below 0.01% (annualized about 11%) from April to June, and at times even turning negative, indicating a retreat of speculative fervor and a tendency towards balanced long and short positions. According to CoinGlass data, the number of times the funding rate turned from positive to negative was very limited, suggesting that the moments of concentrated bearish sentiment were few. In early February, when news of Trump's tariffs triggered a sharp drop, the BTC perpetual funding rate briefly turned negative, indicating that short sentiment reached a local extreme; in mid-April, when BTC quickly dipped to around $75K, the funding rate again briefly turned negative, showing that panic sentiment led to a clustering of shorts; in mid-June, geopolitical shocks caused the funding rate to fall into negative territory for the third time. Aside from these extreme cases, the funding rate remained positive for most of the first half of the year, reflecting a long-term bullish tone in the market. The first half of 2025 continued the trend of 2024: instances of the funding rate turning negative were rare, each corresponding to a dramatic reversal in market sentiment. Therefore, the frequency of switching between positive and negative rates can serve as a signal for sentiment reversals—this year's few switches precisely indicated the emergence of turning points in the market.
Options Market Data Analysis
In the first half of 2025, the BTC options market saw significant growth in scale and depth, with activity reaching new highs. As of June 1, 2025, the cryptocurrency options market remained highly concentrated among a few exchanges, primarily Deribit, OKX, and Binance, with Deribit holding over 60% of the options market share, maintaining an absolute leading advantage as the mainstream BTC/ETH options liquidity center. This was especially true in the high-net-worth and institutional markets, where it was widely adopted due to its rich product offerings, excellent liquidity, and mature risk management. Meanwhile, the options market shares of Binance and OKX saw slight increases. As Binance and OKX continued to improve their options product systems, the market share of leading exchanges is expected to become more dispersed, but Deribit's leading position is unlikely to be shaken in 2025. The market share of DeFi on-chain protocol options (such as Lyra, Premia, etc.) has increased, but the overall volume remains limited.
According to CoinGlass statistics, the total open interest of global BTC options reached a historical peak of approximately $49.3 billion on May 30, 2025. Against the backdrop of a stabilizing spot market and declining volatility, options positions increased rather than decreased, clearly indicating a heightened demand from investors for using options for cross-period layouts and risk hedging. In terms of implied volatility (IV), the first half of the year showed a trend of first decreasing and then stabilizing. As the spot market entered a high-level consolidation, the implied volatility of options significantly retreated compared to last year. In May of this year, the 30-day implied volatility of BTC fell to a near-historical low, indicating that the market expected limited short-term volatility. This starkly contrasts with the massive open positions: on one hand, there are enormous options positions, while on the other, there is historically low volatility, suggesting that investors expect prices to oscillate within a narrow range or adopt selling strategies to earn profits. However, ultra-low volatility itself is also a risk—once a black swan event occurs, it may trigger a sharp rise in volatility and position squeezes. During the geopolitical crisis in June, we indeed observed a slight jump in IV, with the Put/Call ratio rising to about 1.28, indicating a warming of short-term risk-averse sentiment. Overall, the average implied volatility of options in the first half of the year remained at a moderate level, without the significant spikes seen in 2021.
Key points of the options market summary: in the first half of the year, options positions continued to rise, and market depth increased; investors showed strong interest in high-priced call options while simultaneously hedging with put options; implied volatility remained low, with selling strategies prevailing. Looking ahead to the second half of the year, if the spot market breaks out of the consolidation range, implied volatility (IV) may rise rapidly, and the options market may welcome a new round of pricing reshaping.
Cryptocurrency Perpetual Contract Liquidation Data Analysis
In the first half of 2025, the scale of long liquidations was particularly prominent. Especially during several sharp market declines, the risk exposure accumulated by long positions was concentrated and released through liquidations. On February 3, 2025, according to CoinGlass statistics, a total of approximately $2.23 billion in positions were forcibly liquidated within 24 hours, of which long positions accounted for $1.88 billion, with over 729,000 positions being liquidated during this drop. This was the largest single-day liquidation event in the first and second quarters of 2025, triggered by Trump's sudden announcement of large-scale trade tariffs, leading to panic selling in the market.
On February 25, a concentrated outbreak of macro-negative factors occurred, with Trump confirming that tariffs would be implemented as scheduled, U.S. retail giant Walmart warning of future performance slowdowns, and the Federal Reserve's meeting minutes turning hawkish, further exacerbating the already fragile market. The cryptocurrency market experienced another round of panic selling, with BTC dropping below the important psychological level of $90,000, hitting a new low since November of the previous year. On that day, the total forced liquidations across the network amounted to approximately $1.57 billion, with the liquidation structure similar to early February, still dominated by long positions. Due to the continuous market decline, long leveraged funds accumulated at high levels were concentrated and liquidated. For example, one exchange, Bybit, saw approximately $666 million in positions liquidated, with nearly 90% being long positions. In terms of assets, besides BTC and ETH being severely impacted, altcoins experienced even sharper declines—for instance, Solana's price halved from its mid-January peak by the end of February, dropping over 50%, with related perpetual contract liquidations exceeding $150 million. In early March, BTC's price briefly dipped to around $82,000, with mainstream coins hitting new lows in several months.
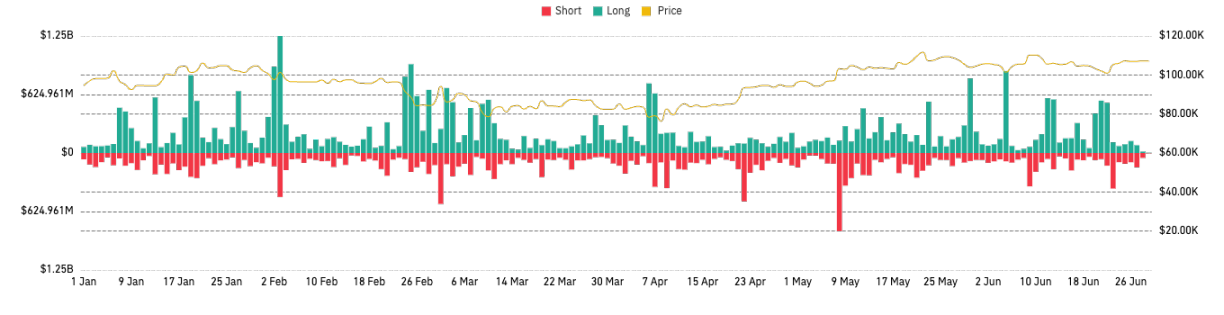
After the market hit an annual low on April 7, the overall market's long leverage had been largely cleared, creating favorable conditions for further increases. Historically, after large-scale long position liquidations, the market tends to stabilize due to the release of leverage risks, which is conducive to bottoming out, entering a "post-deleveraging recovery" phase. On April 23, 2025, the cryptocurrency market experienced the largest scale of short liquidations of the year, becoming one of the most significant market turning points of 2025. On April 22, BTC surged nearly 7% to $93K in a short time, leading to over $600 million in short positions being forcibly liquidated, accounting for 88% of the total liquidations that day, far exceeding long losses. The proportion of short liquidations on major exchanges exceeded 75%, and in a rapidly rising market, short liquidations can dramatically amplify upward momentum, creating a "cascade" of short covering. However, from a broader perspective, the absolute scale of short liquidations in the first half of the year was generally lower than that of long liquidations: for example, the scale of the largest short liquidation day (approximately $500-600 million) was significantly smaller than that of the long liquidation day in February (approximately $1.88 billion), which is related to the overall market being in an upward cycle. Long positions were more willing to leverage, taking on greater risk exposure, but excessive optimism and high leverage among long positions can easily trigger a chain liquidation once key price levels are breached, leading to a "death spiral" of liquidation.
In February 2025, Bybit again pushed full liquidation data to the market and the public through its API, becoming one of the most significant events in the recent cryptocurrency derivatives market. The direct background for this move was the increasing criticism of the lack of transparency in trading platform data, especially regarding the incompleteness of liquidation data, which has long led to information asymmetry in the market, affecting participants' ability to identify and manage market risks. In this context, Bybit proactively enhanced the breadth and depth of data disclosure, demonstrating its determination to enhance platform credibility and improve market competitiveness. Bybit's push for comprehensive and timely public disclosure of liquidation data is an important measure to promote transparency and standardized development in the cryptocurrency derivatives market. The real-time push of full liquidation data helps market participants and analysts more accurately assess market risks, especially during periods of severe market volatility, effectively alleviating risk misjudgments and trading losses caused by information asymmetry. This move sets a good example for data transparency across the industry and positively contributes to the healthy development of the cryptocurrency derivatives market.
Derivatives Exchange Development Analysis
Derivatives Trading Volume Analysis
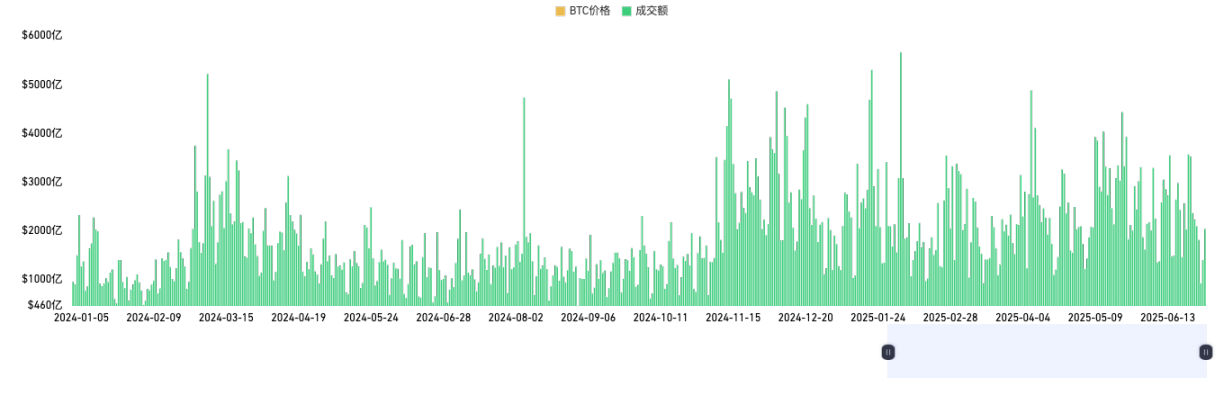
Data from 2025 shows that the total trading volume of cryptocurrency derivatives has exhibited a moderate growth trend compared to 2024, but volatility has significantly increased. Influenced by the global macroeconomic environment, the launch of BTC spot ETFs, and Federal Reserve policies, market activity in 2025 has notably risen, especially during periods of sharp market fluctuations, with derivatives market trading volumes reaching new highs. At the same time, market structure has further concentrated towards leading exchanges, with platforms like Binance, OKX, Bybit, Bitget, and Gate holding major market shares. Binance, as the leading platform, continues to solidify its market monopoly, with trading volumes far ahead of other cryptocurrency derivatives exchanges. While OKX, Bybit, and others remain competitive, the gap with Binance is widening. Notably, since 2024, the participation of compliant institutions (such as CME) has increased, promoting the institutionalization of the derivatives market. The steady growth in derivatives trading volume reflects an enhanced demand for risk management and leverage tools, but it is also essential to be cautious of liquidity risks and regulatory policy changes in a high-volatility environment. Overall, market trading volume is highly concentrated on leading platforms, with the market share of top exchanges continuing to rise, exacerbating the Matthew effect. Investor trust is closely related to liquidity, making quality platforms the preferred venues for mainstream capital and trading activities.
Binance
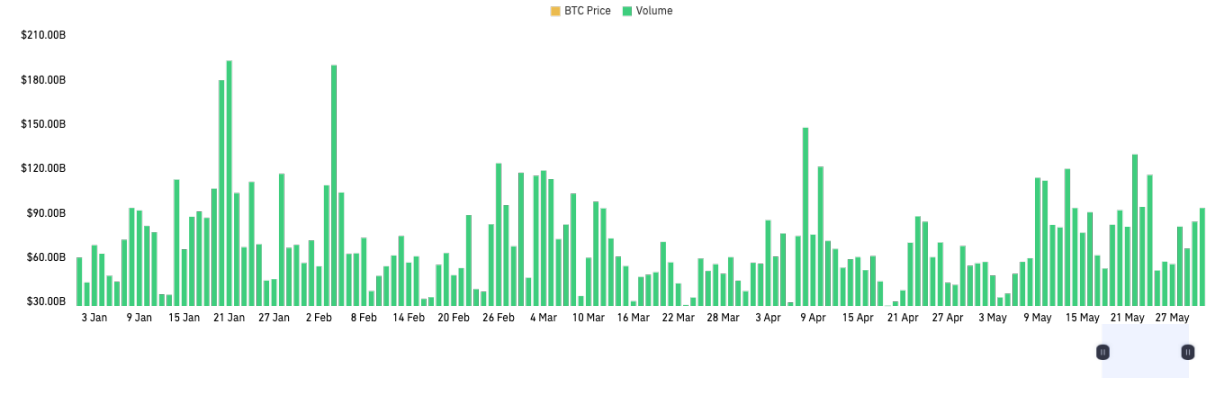
In the first half of 2025, Binance consistently maintained extremely high daily trading volumes, with several days approaching $200 billion. Throughout the period, Binance's trading volume remained high and volatile, with extreme highs frequently occurring, reflecting the platform's strong market appeal and liquidity across various market conditions (including significant fluctuations and normal ranges). Notably, during periods of intense market volatility (such as sharp price increases or corrections), Binance's trading volume significantly increased, indicating that large funds and primary users prefer to choose the platform with the strongest liquidity for risk hedging and strategic trading.
Binance's daily trading volume is unmatched, demonstrating a significant head effect. Compared to mainstream exchanges like OKX and Bybit, Binance's volume advantage is evident, with its market share continuously expanding. For most of the time, Binance's trading volume on a single platform has approached or exceeded the total of other major platforms. Based on high trading volumes, Binance possesses global pricing power for BTC and mainstream derivatives contracts, giving it greater influence over market direction and volatility.
OKX
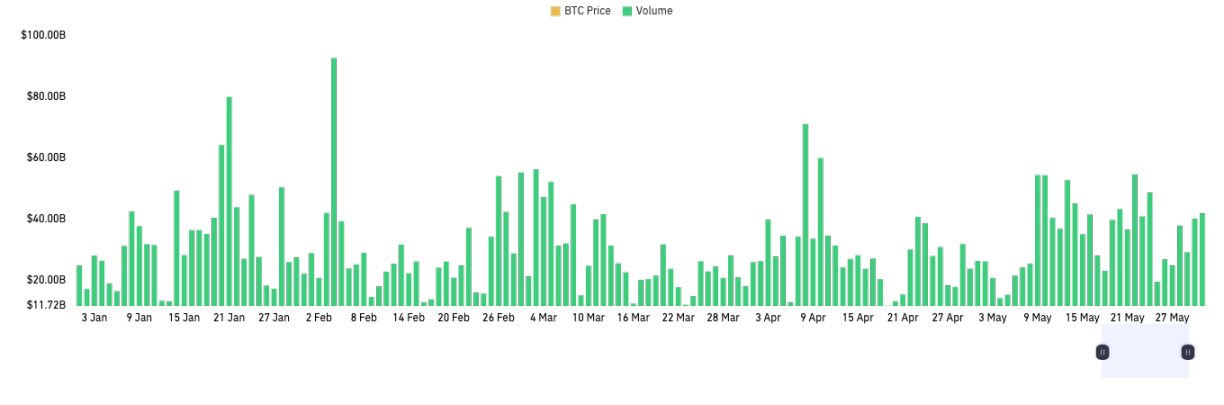
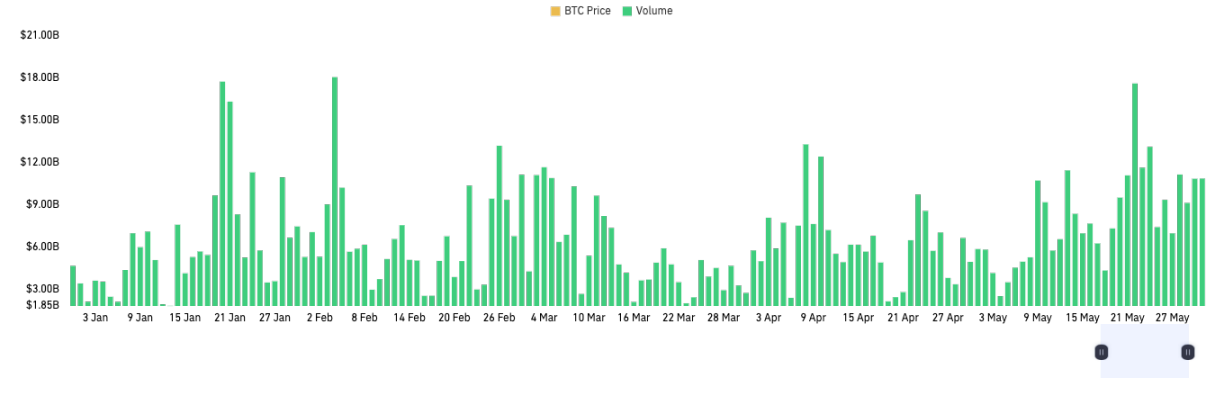
In the first half of 2025, OKX maintained a relatively high trading volume for derivatives contracts, with an average daily trading volume of about $30 billion, fluctuating mostly between $20 billion and $40 billion. However, there remains a significant gap compared to Binance. OKX's trading volume exhibited notable volatility, especially during periods of sharp market fluctuations, with several days showing significant increases, indicating that the platform still possesses strong market responsiveness and appeal. For most of the time, OKX's trading volume remained within a relatively stable range, but overall, it still lags behind Binance and some rapidly growing emerging platforms, suggesting that OKX has a solid user base and liquidity in the derivatives market, but its high growth momentum is gradually weakening.
In 2025, OKX's strategic focus has clearly shifted from traditional centralized exchanges (CEX) towards Web3 and wallet ecosystems. The explosive growth of OKX Wallet has driven the development of its DeFi, on-chain asset management, NFT, and DApp integration ecosystem, attracting a large number of new users and the migration of on-chain assets. However, this has also led to a slowdown in the growth rate of derivatives trading volume on the CEX side of OKX, with some active users and assets flowing into on-chain or multi-chain ecosystems. Although the derivatives trading volume on the CEX platform remains among the industry leaders, the growth logic and liquidity patterns are undergoing profound changes. In the first half of 2025, OKX's derivatives trading volume remained robust, but its growth momentum is not on par with leading platforms. Whether it can achieve a new breakthrough through Web3 businesses like OKX Wallet will be a key variable determining its market positioning.
Bybit
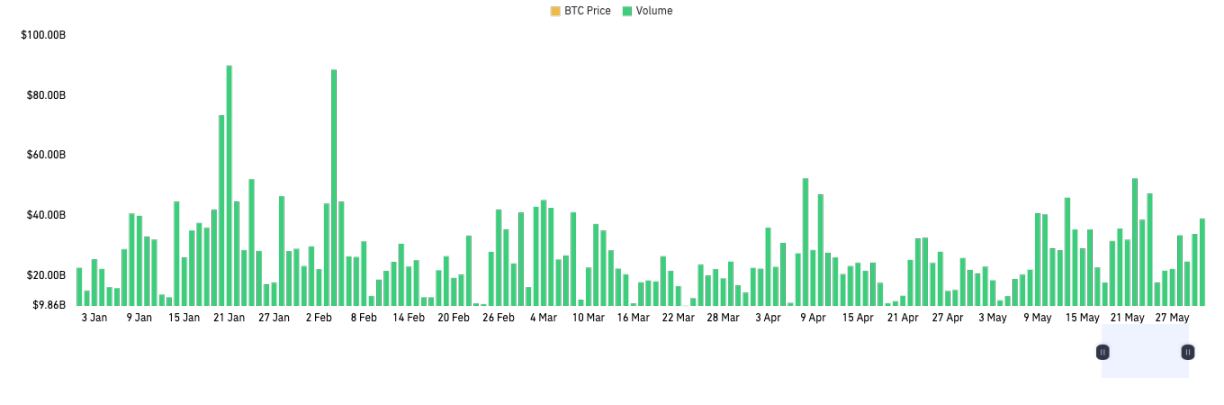
In the first half of 2025, Bybit demonstrated robust trading activity in the perpetual contract market. The distribution of trading volume was relatively dense, with no prolonged periods of trading exhaustion, indicating an active user base and sustained liquidity. The average daily trading volume ranged from $17 billion to $35 billion. Bybit ranks third in the global perpetual contract market, following Binance and OKX, maintaining a market share of about 10%-15%. Its peak trading volumes can match those of OKX during certain periods, highlighting its strong competitiveness in the cryptocurrency derivatives market. Although there remains a significant gap with Binance, Bybit has latecomer advantages in retail trading experience, Web3 community influence, and expansion into emerging markets, with higher penetration rates and stronger brand influence in Europe, America, and Southeast Asia. It is expected to continue capturing market share from mid-tier platforms and narrow the gap with the second-place OKX.
Bitget
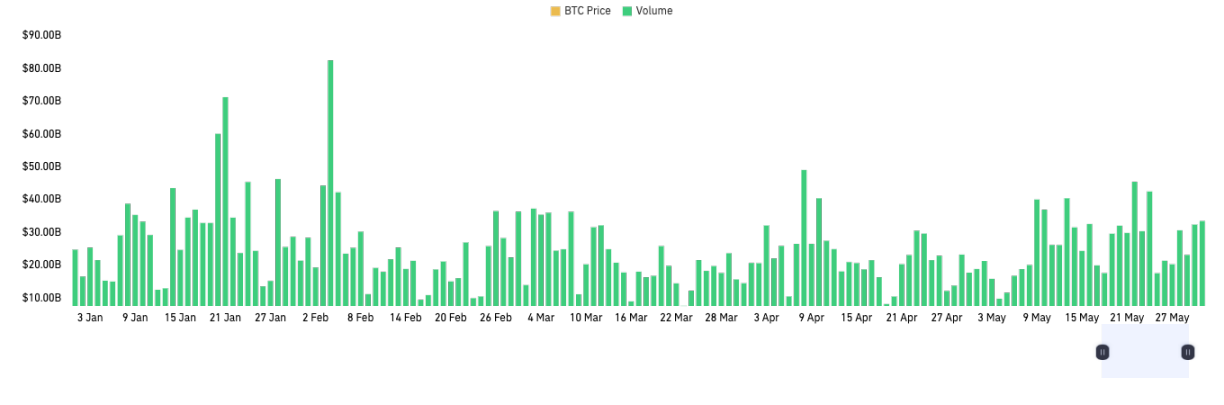
In the first half of 2025, Bitget exhibited significant growth momentum in the global cryptocurrency derivatives market, particularly in the perpetual contract trading sector. According to CoinGlass data, Bitget's average daily trading volume steadily rose to a range of $15 billion to $30 billion, with peaks approaching $90 billion, demonstrating its strong performance in the market. The platform meets diverse trading needs through a rich array of perpetual contract offerings, attracting a large number of young users, especially in emerging markets like Southeast Asia and Latin America. Through localized marketing and brand partnerships, it has enhanced its brand influence and user coverage. Additionally, Bitget continues to advance technological innovation, optimizing its trading system and improving user experience, further solidifying its market position. Although there remains a gap with Binance and OKX, it has become one of the most promising exchanges poised to join the ranks of leading platforms.
Gate
In the first half of 2025, Gate's contract trading segment demonstrated significant growth momentum, with average daily trading volumes steadily increasing to a range of $10 billion to $30 billion, peaking at nearly $60 billion, indicating that the trading activity in the platform's derivatives market remains at a high level. From the perspective of trading volume growth rate and market share expansion, Gate is gradually establishing a differentiated advantage in the current global digital asset derivatives market competition, strengthening its influence among emerging markets and small to medium-sized investor groups.
The platform continues to expand the coverage of contract varieties, optimizing its matrix of perpetual contracts, options, leveraged products, and other diverse derivatives to meet the needs of users with different risk preferences and investment demands. Although there is still distance from leading platforms like Binance and OKX, Gate has become one of the most growth-oriented and influential emerging contract trading platforms, attracting significant attention from the industry.
Hyperliquid
Hyperliquid is one of the newly emerging decentralized derivatives exchanges (DEX) representatives during the 2023-2025 period. As of the first half of 2025, Hyperliquid's average daily trading volume has steadily surpassed $3 billion, with some peak periods exceeding $17 billion. Hyperliquid employs self-developed matching technology on its native chain, achieving extremely low latency and high liquidity without the need for oracle settlement, significantly enhancing trading depth and price efficiency.
Hyperliquid's month-on-month and quarter-on-quarter growth rates in trading volume are the highest in the DEX industry, with active user numbers, TVL (Total Value Locked), protocol revenue, and other core metrics significantly surpassing traditional DEXs. Over the past year, Hyperliquid has achieved explosive growth from an average daily trading volume of less than $100 million to as high as $3-5 billion, with its growth rate and speed unprecedented in the DEX field. Hyperliquid currently occupies over 80% of the DeFi perpetual contract market share.
Exchange Market Depth Analysis
Market depth is an important indicator that measures the accumulated volume and distribution of buy and sell quotes at different price levels in an exchange's order book, directly reflecting the market's liquidity level and trading capacity. For cryptocurrency exchanges, deep market depth can effectively reduce the impact of large trades on prices, minimize slippage, and enhance users' trading experience and cost efficiency. This is particularly crucial for attracting high-frequency traders, institutional market makers, and other professional liquidity participants, as they typically need to maintain price stability during large and frequent trades. Ample market depth also lays the foundation for the stable operation of derivatives markets such as contracts and options, helping to form tight bid-ask spreads and enhancing the overall market's price discovery function and risk hedging efficiency.
According to CoinGlass data, Binance continues to maintain an absolute leading position in BTC market depth among global cryptocurrency spot exchanges. The median order book depth in the market remains in the range of $20 million to $25 million on each side, while Binance holds about $8 million in single-side depth, accounting for approximately 32% of the market share, far ahead of the second-place Bitget (about $4.6 million) and third-place OKX (about $3.7 million). Notably, in terms of the depth of orders exceeding $1 million, only Binance has achieved a depth of over $1 million on each side, while other mainstream exchanges fall below $500,000. Binance's absolute lead in BTC market depth fully reflects its excellent liquidity level as the world's largest cryptocurrency exchange, while other exchanges like OKX and Bybit still have room to catch up in terms of market depth and liquidity.
V. Summary
In the first half of 2025, the cryptocurrency derivatives market demonstrated strong resilience and structural differentiation against the backdrop of global macro turmoil and rising geopolitical risks. On one hand, driven by the continuous inflow of funds into BTC spot ETFs and a surge in institutional allocations, BTC not only broke through historical highs but also stabilized at elevated levels, with both the derivatives market size and open interest reaching new highs. In terms of market structure, the proportion of compliant exchanges like CME has increased, and the ETF effect continues to reinforce BTC's positioning as an "institutional allocation asset," leading to profound changes in risk appetite across the entire sector. On the other hand, ETH and mainstream altcoins have been burdened by multiple pressures from technology, ecology, and funding, resulting in overall weak performance, a significant decline in the ETH/BTC ratio, and cautious investment sentiment in altcoins, with a lack of new technological innovations and application scenarios driving the sector.
From a trading perspective, the overall leverage structure of derivatives has trended towards health, with the futures and options markets continuing to expand. Leverage risks have been effectively released after several periods of intense market activity, with open interest and liquidity in the options market reaching historical highs, while implied volatility remains low, leading to a balance between bullish and bearish forces. The options market is active, with both bullish and hedging demands coexisting, and the market must remain vigilant against the sudden risks of "black swan" events under the contradictory pattern of high positions and low volatility. The large-scale liquidations of long and short positions that occurred in 2025 not only released market leverage risks but also created conditions for subsequent price recovery and market stabilization. At the platform level, Binance continues to maintain its advantages in global market liquidity and pricing power, while OKX, Bybit, Bitget, and others are strengthening their competitiveness in their respective niche markets. Decentralized derivatives exchanges like Hyperliquid are showing explosive growth, and the DeFi sector's innovative vitality is continuously being released.
Looking ahead to the second half of 2025, the core variables of the market remain macro policies, ETF flows, and shifts in risk appetite. If there is a substantial adjustment in the Federal Reserve's interest rate policy or the implementation of an ETH spot ETF staking mechanism, it could serve as an important catalyst for the repair of risk appetite. Overall, BTC's characteristics as a "macro asset" are becoming increasingly prominent, and the trends of institutionalization and compliance in the derivatives market are accelerating, benefiting leading platforms and innovative protocols. Meanwhile, regulatory policies, sudden risks, and changes in liquidity remain unresolved structural challenges. Investors need to continuously monitor market leverage and liquidity indicators, dynamically adjust their risk exposure, and actively seek a balance between asset allocation and risk hedging amid cyclical shifts and waves of innovation.
免责声明:本文章仅代表作者个人观点,不代表本平台的立场和观点。本文章仅供信息分享,不构成对任何人的任何投资建议。用户与作者之间的任何争议,与本平台无关。如网页中刊载的文章或图片涉及侵权,请提供相关的权利证明和身份证明发送邮件到support@aicoin.com,本平台相关工作人员将会进行核查。


