Author: Biteye
Source: Biteye
On November 15, BTC fell to a low of $62,006, almost halving from last October's historical high.
How severe is this decline? Even He Yi showcased his account earnings on Binance Square, with assets shrinking by over $100 million in the past 30 days.
As the market continues to decline, pessimistic sentiment is spreading. Some believe BTC is nearing the bottom, while others worry there will be even greater declines ahead.
So, what step has this bear market reached? How far are we from the next bull market? This time, we will try to find answers from the angles of the reasons for the decline, historical patterns, and the current market environment.
Why is BTC continuing to fall?
In the face of the ongoing decline, CZ specifically summarized several possible reasons for BTC's drop:
1. ETF funds continuously withdrawing: As of November 13, U.S. spot BTC ETFs faced a net outflow of about $1.91 billion over seven consecutive trading days, with ETH ETFs also experiencing fund withdrawals.
2. AI competing for market liquidity: With Anthropic about to go public, the market speculates that some investors are selling BTC and other assets to free up funds for U.S. stock IPOs.
3. Macroeconomic environment facing short-term pressure: U.S. inflation continues to rise, and the market is starting to bet on the Federal Reserve raising interest rates again, with U.S. bond yields and the dollar strengthening, exerting pressure on risk assets like BTC.
4. Security incidents undermining confidence in holding coins: Some centralized platforms have encountered security issues, such as wallet security and browser vulnerabilities, decreasing investors' willingness to hold crypto assets.
5. Political and regulatory uncertainty: After the U.S. midterm elections, the market is beginning to worry about the potential re-tightening of crypto regulations.
In addition, there are three structural factors worth mentioning:
1. CEX security anxiety is increasing: As previously stated by Yi Lihua, hacking techniques have continually upgraded in the AI era, and centralized platforms’ security defenses are facing serious tests.
2. High-yield stablecoin investments divert risk appetite: Currently, some mainstream platforms offer attractive yields on stablecoin investment, where investors can earn nearly 10% annualized risk-free returns, significantly diverting their willingness to hold volatile assets.
3. AI and quantum computing raise long-term concerns: Sun Yuchen mentioned in a recent interview that breakthroughs in AI algorithms and the future quantum threat (Q-Day) may challenge the foundations of existing asymmetric cryptography, and the market has not yet fully digested this potential long-term risk.
What step has the bear market really reached?
Looking back at the past three complete BTC bear market cycles:
· 2013 cycle: fell about 85% from the peak, lasting 406 days to bottom;
· 2017 cycle: fell about 84% from the peak, lasting 364 days to bottom;
· 2021 cycle: fell about 77% from the peak, lasting 366 days to bottom.
From a statistical perspective, the past three major bear markets took approximately one year to form a bottom after falling from the historical high point.
This round of BTC peaked in October 2025, and the adjustment period has already exceeded 13 months. From a time perspective, we are currently entering a high-probability phase for the historical bear market to experience a periodic bottom.
How much longer until we exit the bear market?
As the wizard (@0xcryptowizard) said, even if the market has a hundred bullish reasons and a thousand bearish reasons, everyone is ultimately just ordinary participants unable to predict the future accurately.
Since no one can accurately anchor the absolute bottom, we might as well look for patterns from historical bull-bear cycle evolutions to provide reference coordinates for current market assessments.
Halving cycle indicators
BTC has gone through four halvings in history, occurring in 2012, 2016, 2020, and 2024, with approximately four years between halvings.
Looking back at the past three cycles, BTC initiated clear recovery trends about 272 days, 404 days, and 462 days before each halving, with significant turning points taking place well ahead of the halving.
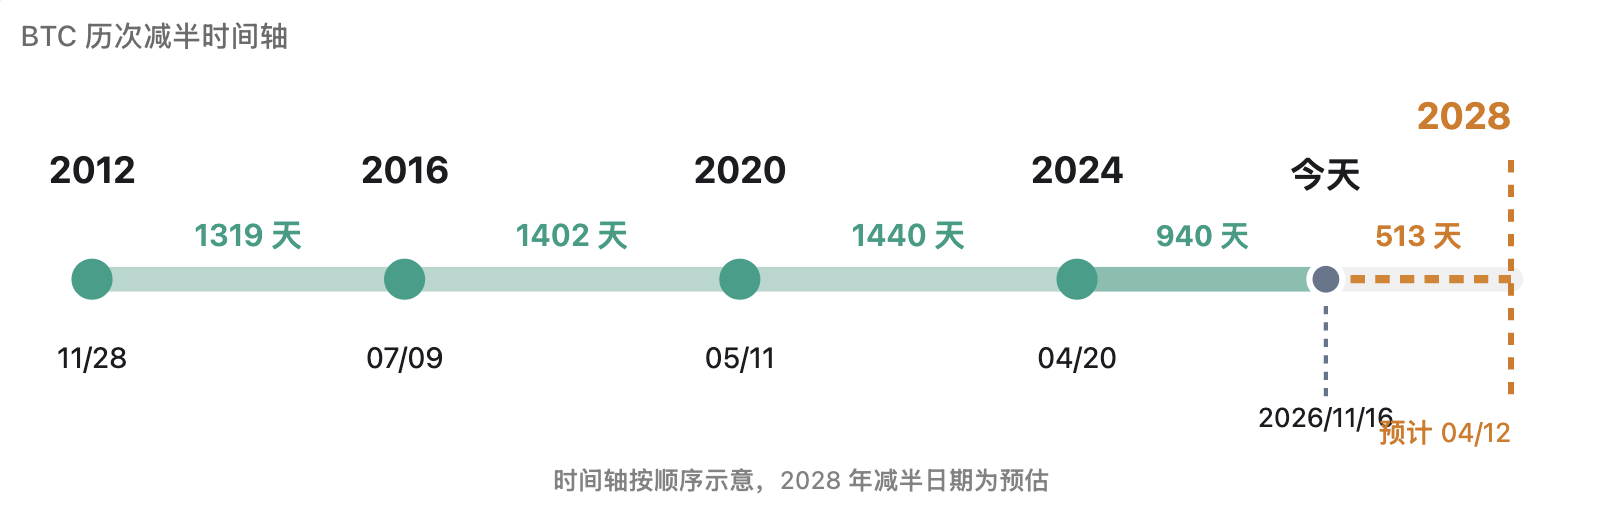
Figure: Comparison of BTC historical halving cycles and recovery rhythms
If we extend this historical rhythm, BTC may see a new round of sustained recovery between January and July 2027, which is approximately 2 to 8 months from the current window.
Midterm election indicators
Historical experience shows that after U.S. midterm elections settle down, the stock market often sees strong performance. Statistics from BlackRock indicate that since 1970, the S&P 500 index has averaged an increase of about 14.1% in the six months following midterm elections.
Reviewing BTC's past three bear markets, the bottoms in 2015, 2018, and 2022 all occurred within 1 to 71 days after the U.S. midterm elections concluded.
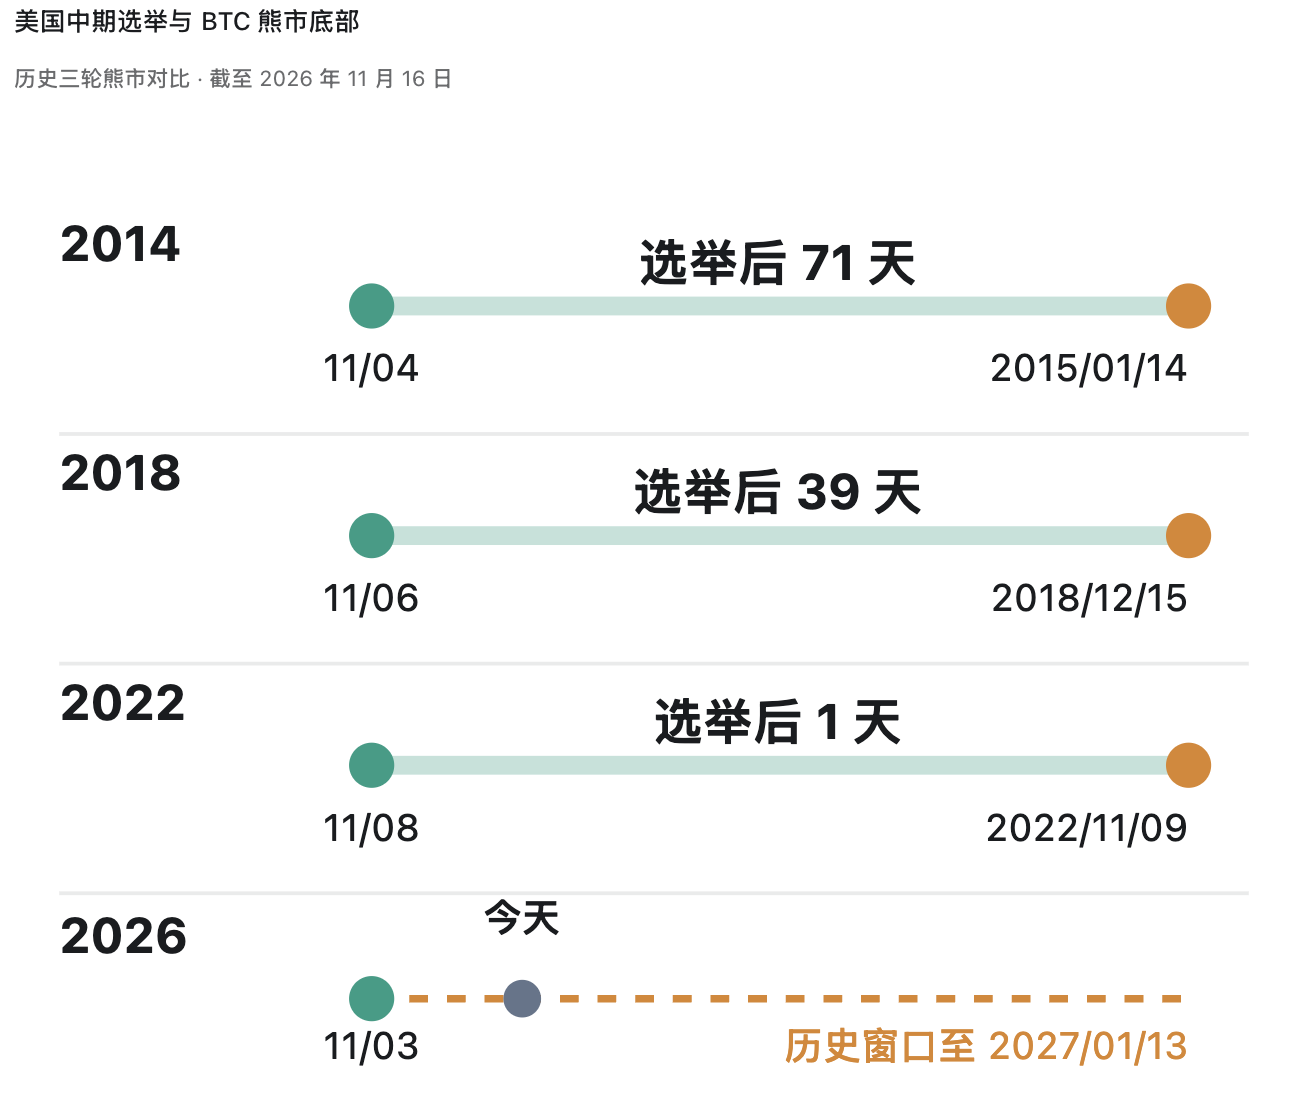
Figure: Relationship between historical U.S. midterm elections and BTC bottom times
As the midterm elections come to a close, uncertainties regarding taxation, regulatory policies, and fiscal expenditures will gradually fade, and the capital market's expectations for future policy directions will also become clearer.
Global M2 liquidity cycle
Global M2 is a key barometer measuring macro monetary liquidity. Historically, the expansion of global M2 often resonates with BTC's upward trajectory; the expansion of the monetary reservoir drives incremental funds to spill into the crypto ecosystem.
Currently, global M2 remains in an overall expansion mode, mainly driven by the monetary supply of major economies like the U.S. and China. U.S. M2 has grown by 5.7% year-on-year, with bank credit and deposit creation still being important drivers of monetary expansion.
Research by Coinbase shows that the cyclical turning points of global M2 typically lead BTC by about 110 days (or 3 to 4 months).
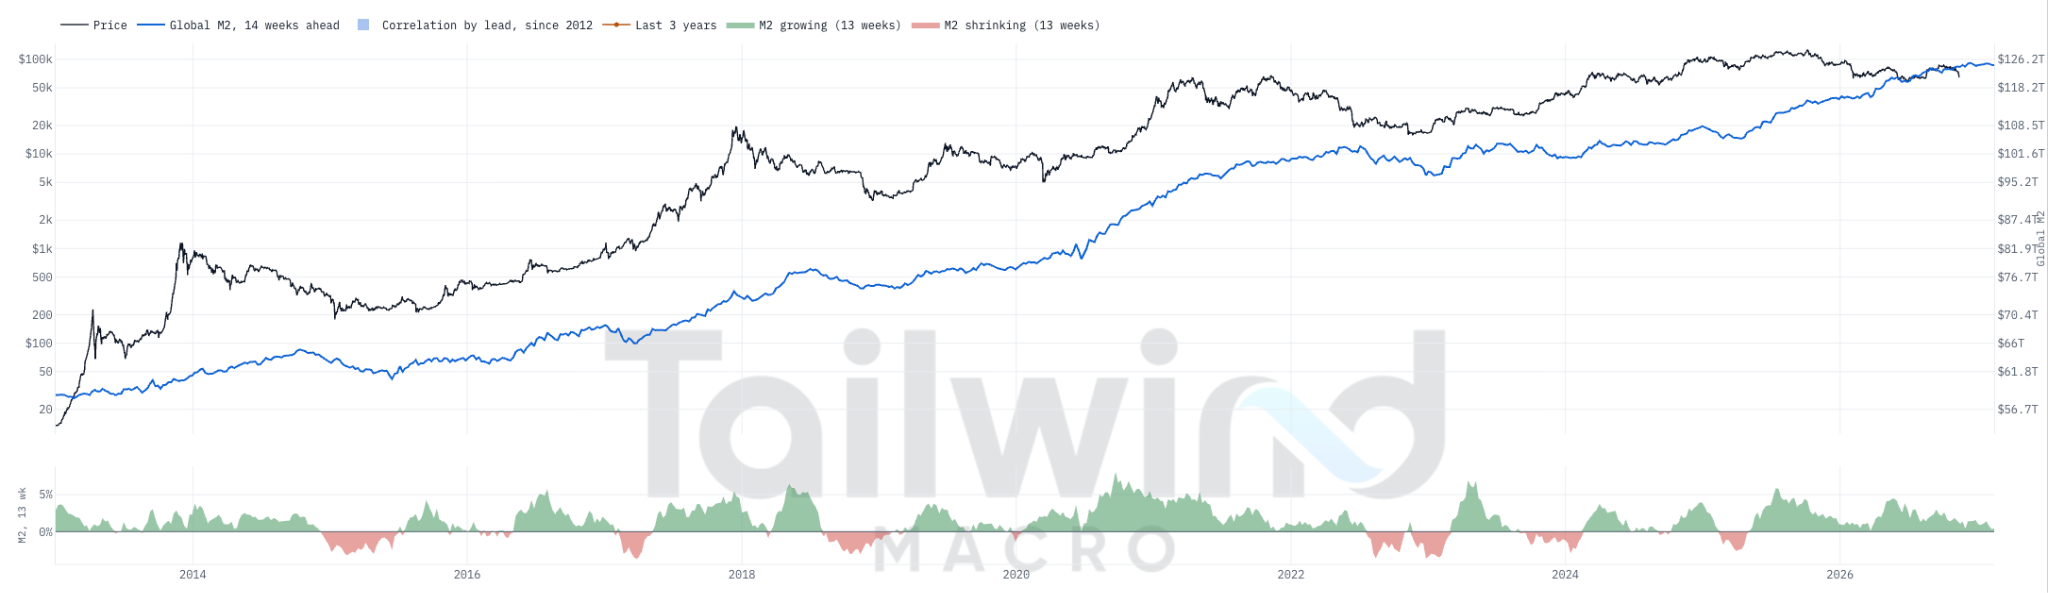
Figure: Relationship between global M2 supply growth rate and BTC market trends
If we calculate based on the historical pattern that M2 leads by 110 days, the first quarter of 2027 will be an important time window to observe BTC's renewed strength.
Current environment: Does BTC have the conditions to exit the bear market?
From the perspectives of halving cycles, midterm elections, and liquidity patterns, the bear market is gradually approaching its end in terms of time scale. However, reverting to reality, there are still many constraining factors in the current financial environment:
1. Fed interest rate hike expectations rising again: U.S. inflation continues to exceed expectations, with the market anticipating a potential increase of about 64 basis points within the next 12 months, possibly extending tightening pressure until 2027. A tight policy environment means that dollar liquidity is unlikely to turn to easing quickly in the short term.
2. U.S. bond yields and the dollar both remain strong: The yield on U.S. 10-year Treasury bonds has risen to about 5.15%, and the dollar index continues to fluctuate above 103. Preference for risk-free yields and dollar assets puts pressure on the willingness to allocate to non-yielding assets like BTC.
3. Surge in AI capital expenditure leads to tech stock valuation reevaluation: Leading AI firms’ capital expenditures reached $230 billion in the third quarter, with some exceeding operating cash flows. The market is beginning to examine the investment return rates of AI commercialization, putting pressure on tech stocks. If subsequent corporate profits can digest current valuations, the U.S. stock market is expected to rebuild support.
4. Phased contraction of liquidity in the crypto market: Spot BTC ETFs have faced a continuous net outflow, with the supply of major stablecoins shrinking by about $11.5 billion in the past 30 days, as both on-site and institutional funding narrow, resulting in a lack of abundant incremental buying support in the short term.
5. Institutional holding costs facing tests: The current spot price of BTC has fallen below the average holding cost line of some key institutions (such as MicroStrategy), and a tightening market financing environment may limit institutions' ability to continue increasing their positions.
Overall, the current market is undergoing a triple resonance adjustment involving macro monetary policy, technology stock valuation systems, and liquidity in crypto assets. As interest rate hike conclusions become clearer, the U.S. stock market stabilizes, and institutional buying flows back in, BTC will gradually construct the necessary conditions to exit the bear market.
How much longer will the bear market last?
Whether through the early recovery patterns of halving cycles or the time window of U.S. midterm elections, historical statistics show that BTC has already entered the bottoming phase of a major bear market.
However, the current macro and capital environment has structural differences compared to previous cycles: the extension of the Fed's monetary tightening cycle, valuation discrepancies in the technology sector, and withdrawal of on-site liquidity have all prolonged the time it takes for the market to recover.
Considering all dimensions, the end of 2026 to the first half of 2027 is likely to be a crucial window period for this bear market to thoroughly complete its bottoming process and establish a new cycle. The wolf wave cycle index from Sha Po Lang (@wolfyxbt) also provides a similar timing judgment, even suggesting that BTC is theoretically approaching or even entering the budding phase of a new cycle.
免责声明:本文章仅代表作者个人观点,不代表本平台的立场和观点。本文章仅供信息分享,不构成对任何人的任何投资建议。用户与作者之间的任何争议,与本平台无关。如网页中刊载的文章或图片涉及侵权,请提供相关的权利证明和身份证明发送邮件到[email protected],本平台相关工作人员将会进行核查。


