
Author: matteo
Translation: Saoirse, Foresight News
Editor's Note: Long-tail assets were once Hyperliquid’s most core moat, attracting traders through ample market liquidity. This article relies on one and a half years of order book data, benchmarking against Binance and OKX, to compare the depth, trading costs, and price spread changes of long-tail targets on HL, exploring the trend of small to medium-sized market makers gradually exiting as they face pressures from fees, on-chain congestion, and priority fee auctions, while liquidity concentrates on the top players. It also highlights that the HIP-4 prediction market ecosystem equally relies on the support of small to medium-sized market makers. The following is the content of this article:
In recent months, we have conducted a deep analysis of the liquidity of various trading varieties on major decentralized exchanges. Relying on the trading business of 0d Labs, we accumulated more than a year and a half of complete order book data and observed a surprising phenomenon across all long-tail sectors of cryptocurrency: market liquidity is continuously depleting.
Initially, we anticipated that liquidity contraction would only concentrate around the pre-and post-phase of the October 10 market impact, but as of now, the entire cryptocurrency market has yet to recover its vitality from this impact.
In addition, many familiar trading peers have recently reported that the competitive pressure of market-making trading on Hyperliquid is increasing, with profit resources continuously tilting towards a small number of top players: priority fees are monopolized by Wintermute, unreasonable fee rules, and frequent congestion on L1 public chains, all of which make it extremely difficult for small and medium-sized market makers.
Therefore, I delved deep into reviewing Hyperliquid's liquidity evolution logic, attempting to clarify a question: whether the deteriorating survival environment for small and medium-sized market makers is causally related to the decline in platform liquidity. After all, Hyperliquid's core competitive barrier in its early days was precisely the ample and solid market liquidity of long-tail tokens.
Establishing a Comparison Benchmark
To assess liquidity changes, reliable reference standards are needed first. Liquidity contraction could be a common issue across the entire industry; we need to distinguish which impacts are due to the general market downturn and which are unique issues of Hyperliquid. Binance is the most suitable benchmark platform for measuring the liquidity level of altcoins.
This study selects 86 tokens that are listed on both platforms and have a maximum leverage of no more than 10 times as a sample, with a statistical period from November 1, 2025, to November 1, 2026, forming our long-tail sample pool.
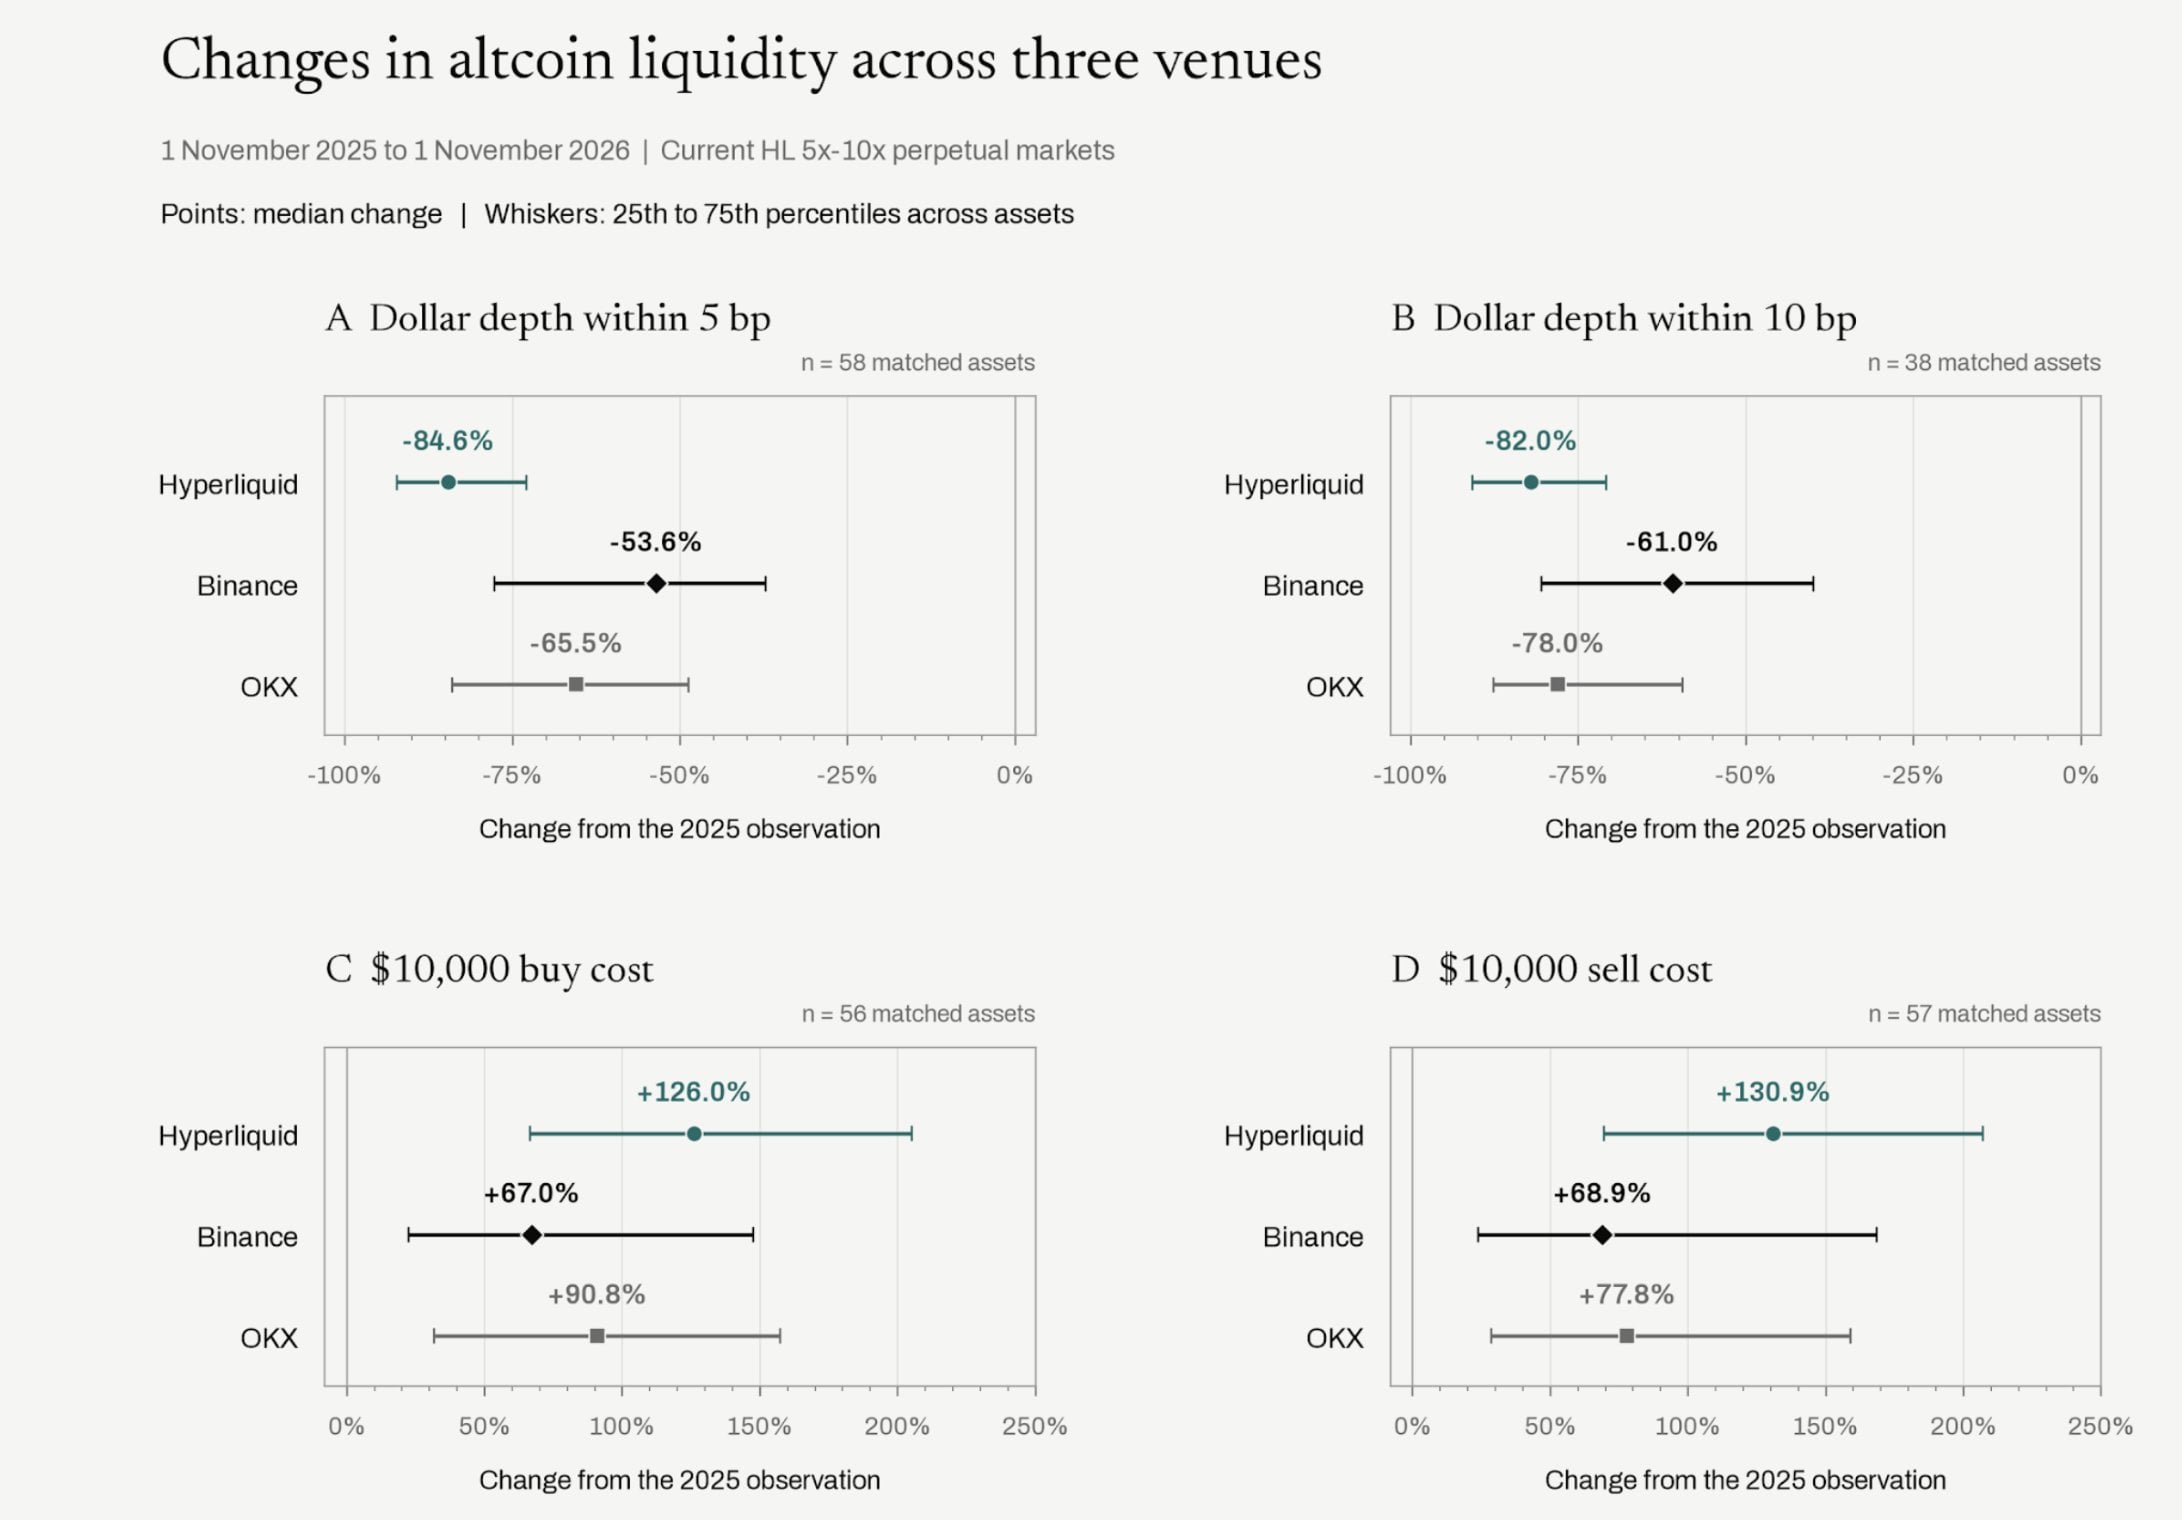
Data from November 1, 2025 – November 1, 2026, shows that compared to Binance and OKX, Hyperliquid’s long-tail altcoin perpetual contracts have the largest decline in 5bp and 10bp market depth, and the highest increase in slippage for $10,000 orders.
Among the 38 trading pairs with comparable conditions, the median decline in the dollar depth of the 10 basis points market is as follows: Hyperliquid is 82%, Binance is 61%, and OKX is 78%, with a significant disparity. Of course, token price declines directly depress the dollar-denominated depth, so we also simultaneously checked the number of corresponding token orders to exclude the interference caused by price fluctuations.
To separately measure the changes in Hyperliquid's relative competitiveness, we calculated the ratio of Hyperliquid’s market depth to Binance’s market depth for each token, comparing the differences year-over-year. At the 5 basis points level, the median of this ratio declined by 57.5%. In other words, even comparing the same token, Hyperliquid's liquidity advantage relative to Binance has significantly weakened. This ratio is calculated independently for each trading pair, rather than directly dividing the median of the two platforms.
If a token worth $10,000 was purchased within the later sample period, referring only to the market orders and not accounting for fees, Hyperliquid's median slippage is 5.21 basis points, while Binance’s is only 2.95 basis points. Even this relatively small order size shows a considerable difference in trading costs.
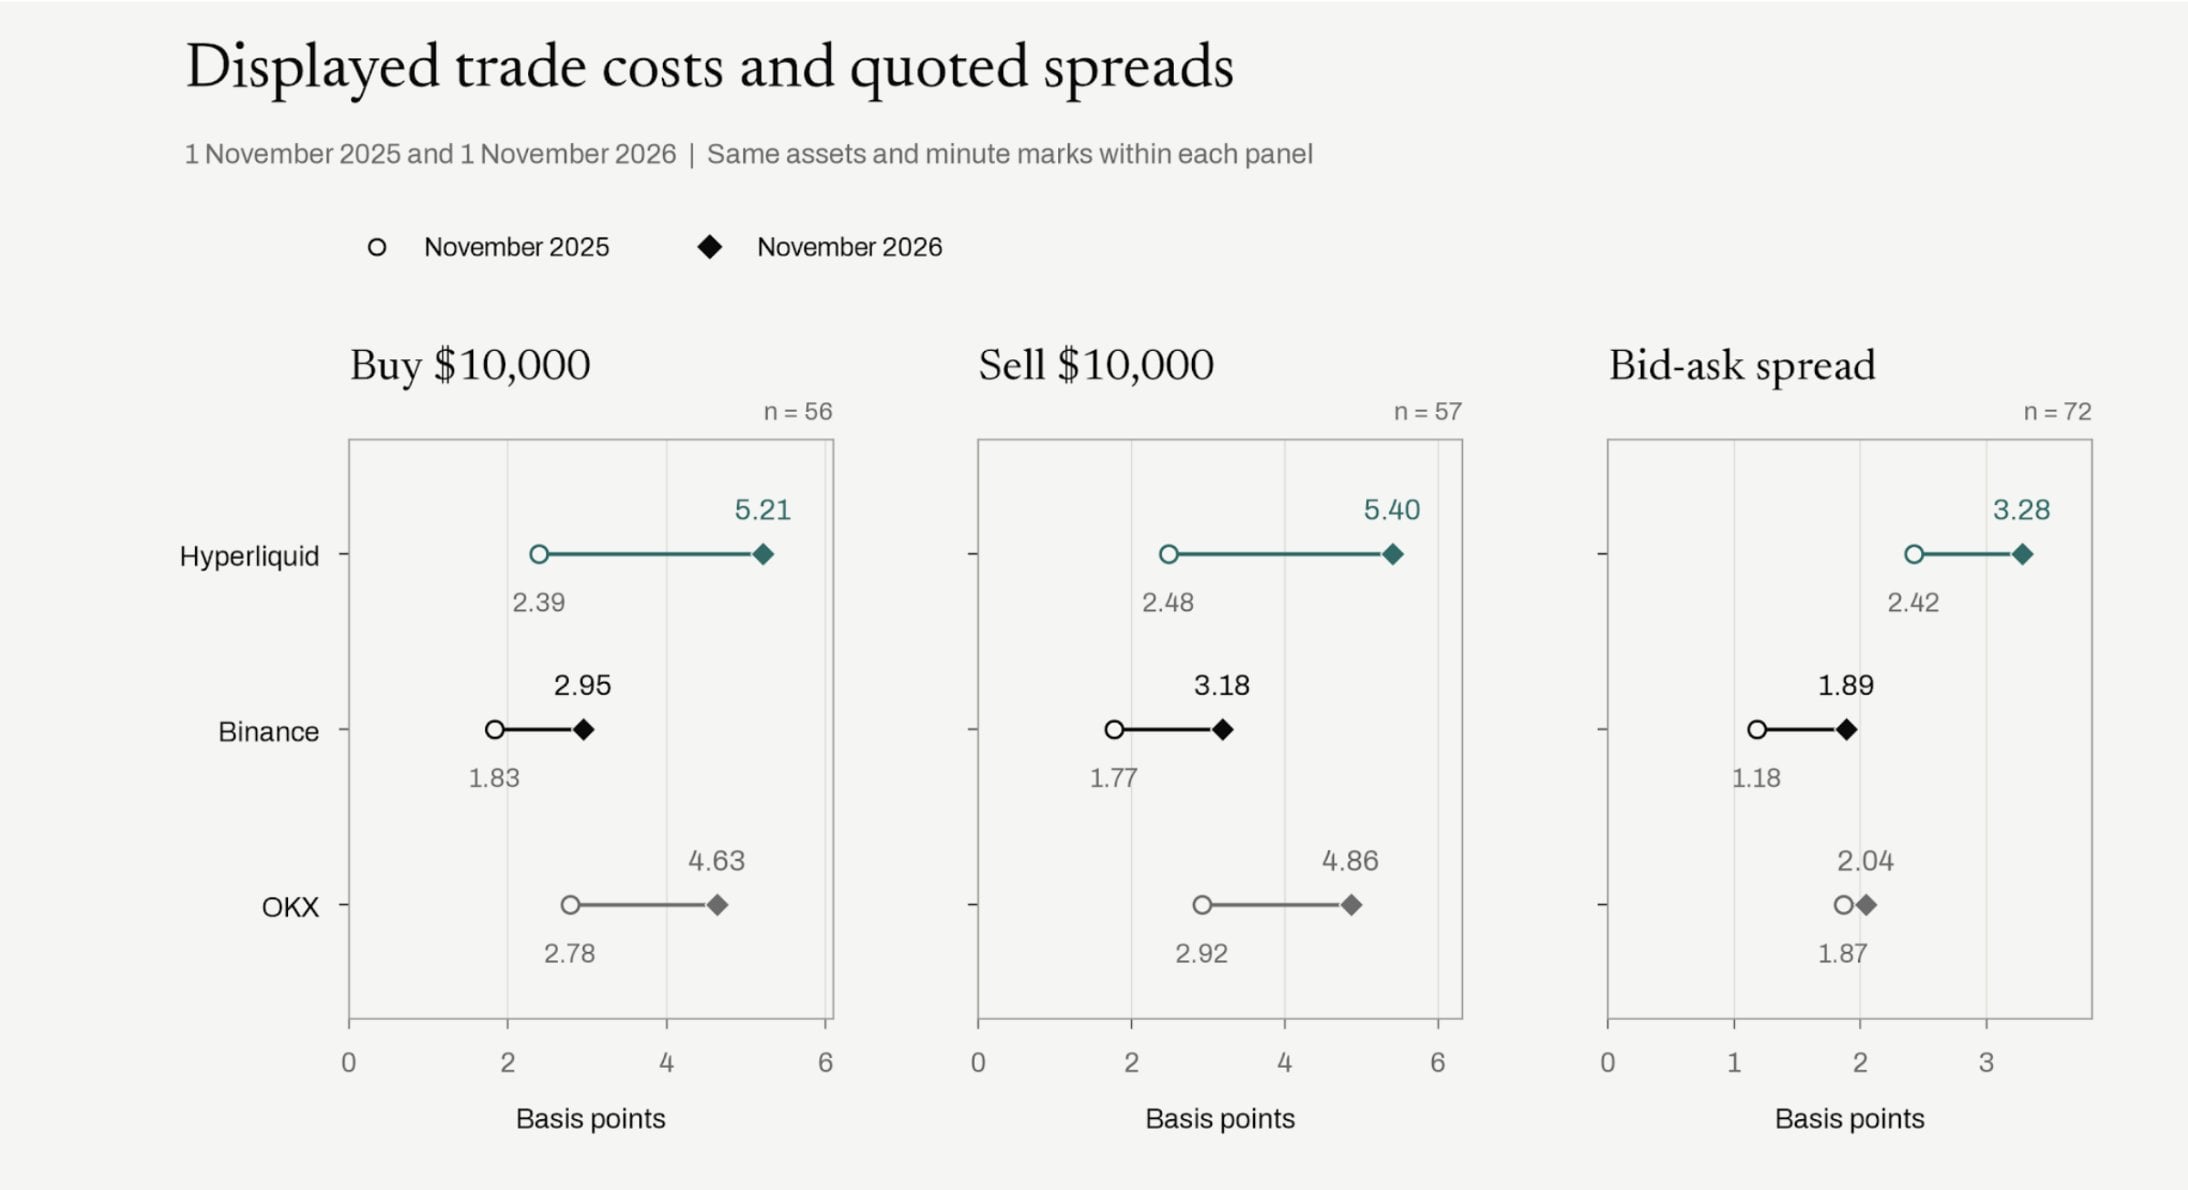
From November 2025 to November 2026, the trading slippage and spread of long-tail tokens on all three platforms have risen, with Hyperliquid’s slippage and market spread for $10,000 orders both higher than those of Binance and OKX.
The spread indicator, however, shows different results: the year-on-year increase in Binance’s spread is greater. But since Binance's initial spread base is lower, even after a round of expansion, its final spread performance still exceeds that of Hyperliquid.
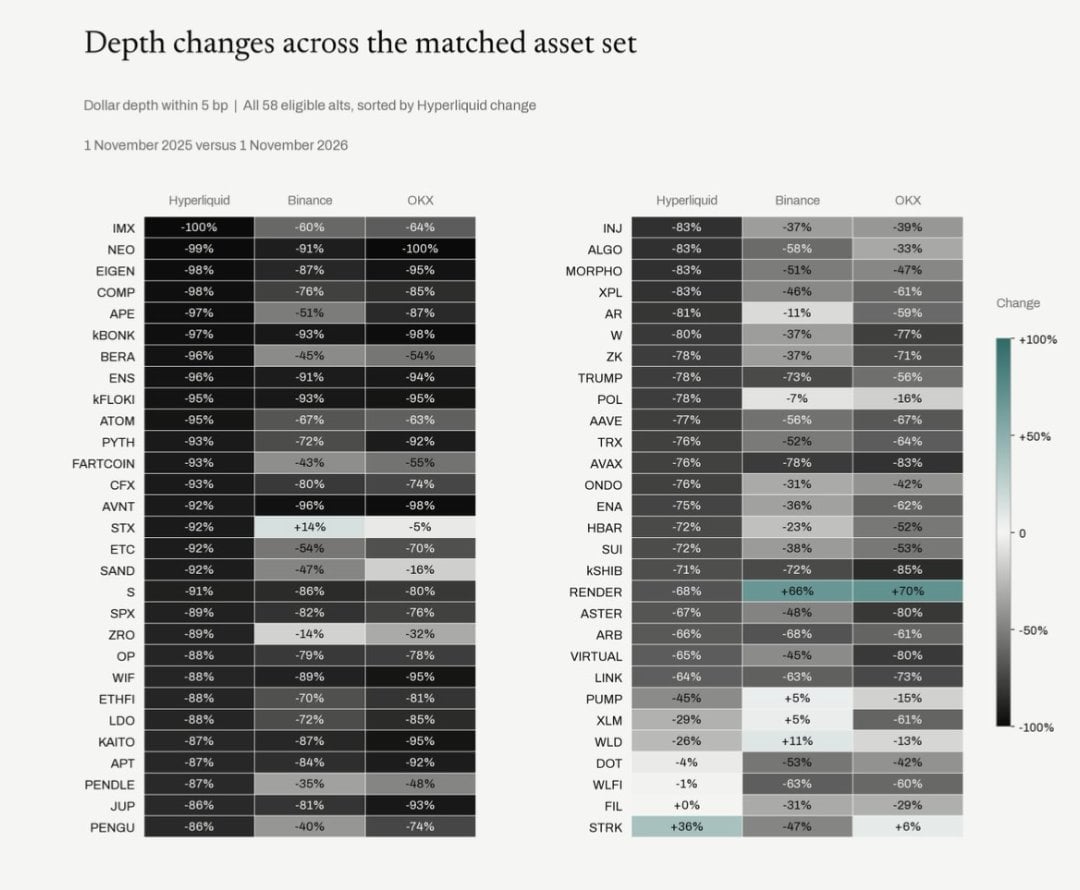
This heatmap compares the year-on-year changes in dollar market depth within a 5 basis points range for 58 long-tail tokens, with most tokens on Hyperliquid experiencing significantly larger liquidity declines than those on Binance and OKX, with only a few tokens seeing positive liquidity growth.
The Contradiction Near Mid Price is Most Prominent
There is a common criticism of this analytical framework: when token prices plummet, even if the number of tokens in the orders remains unchanged, their dollar value will still shrink passively. To eliminate this interference, we tracked two indicators: the dollar value of the corresponding orders and the number of tokens in those orders.
This set of charts fixes tokens and observation points, collecting a total of 13 groups of samples. The 5 basis point group covers 63 trading markets, while the broader top 20 depth groups cover 80 trading markets. It should be noted that this sample selection standard is stricter than the previous round and the centralized exchange comparisons, so the data obtained cannot be directly equated to the earlier CEX comparison conclusions.
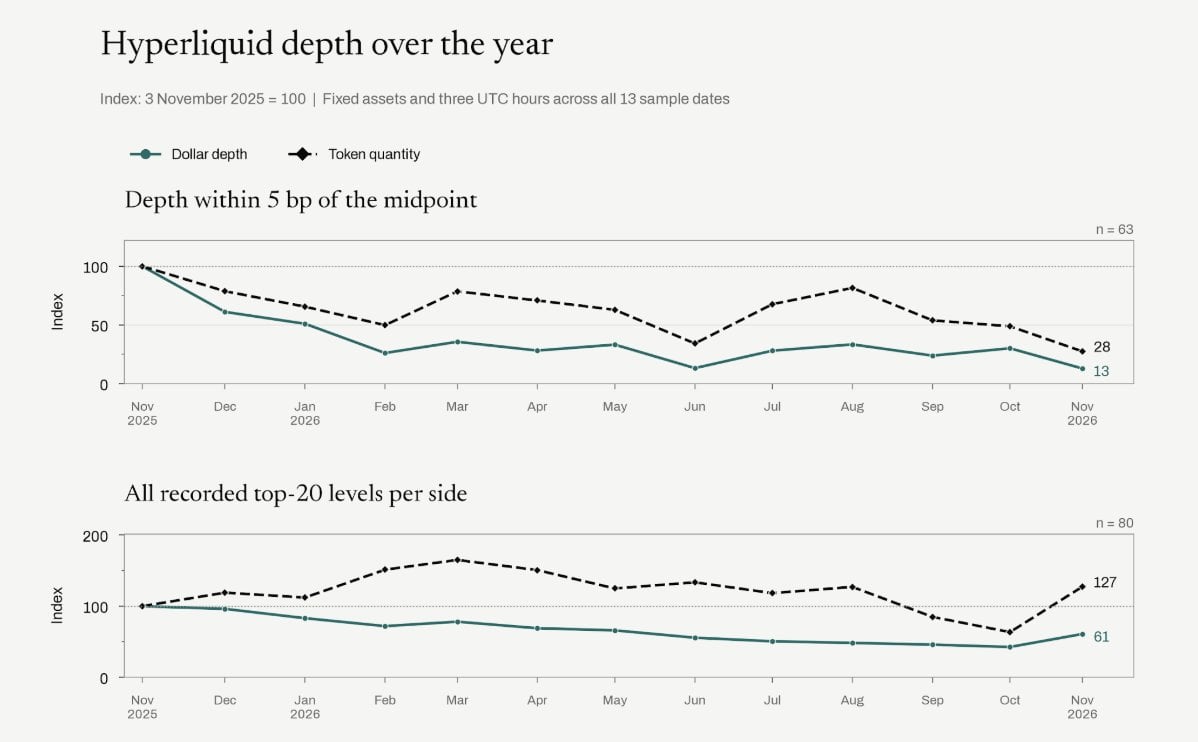
Hyperliquid’s liquidity structure has clearly differentiated over the past year: depth within 5 basis points of the mid price has significantly decreased, while the number of token orders at the far end of the order book's top 20 levels has actually increased.
We set the data from each market in November 2025 as the baseline value of 100 for easy horizontal comparison. A year later, at the 5 basis point level, the median dollar depth is only 13, while the median number of token orders is only 28. In other words, even excluding the impact of token price declines, the scale of the market orders close to the transaction price has still significantly shrunk.
If we broaden the statistical scope to include all 20 levels of order depth, the indicators show a completely different scenario: the median dollar depth is 61, and the median number of token orders reaches 127. It is clear that the number of token orders at the far end of the order book is indeed higher than in previous years. There are not no orders on the market; rather, it is the depth at near the most frequently traded and most important positions for transactions that is severely lacking.
Finer Dimension Observations
Over a six-month period, the far end market depth actually saw some recovery, but the liquidity close to the transaction price did not improve.
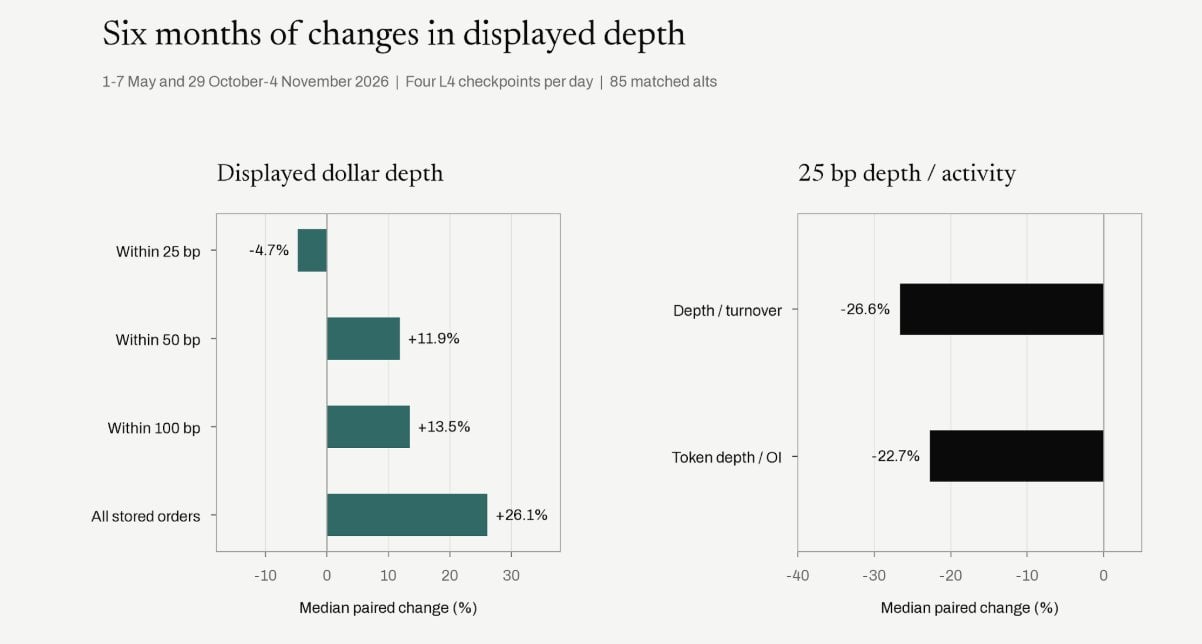
Comparing data from May and the end of October to early November, Hyperliquid’s near-market dollar depth within 25bp has declined, while further levels and the total number of orders have actually increased; the ratios of 25bp depth relative to trading volume and position have both clearly decreased.
Further observing the spread trends over the year, an intriguing change is this: until recently, Hyperliquid's spread level had been converging towards industry peers. Of course, we also need more time to verify whether this is a long-term trend or a short-term disturbance. However, the data presented by the order book exactly corroborates the phenomenon mentioned earlier regarding the market structure tending to concentrate.
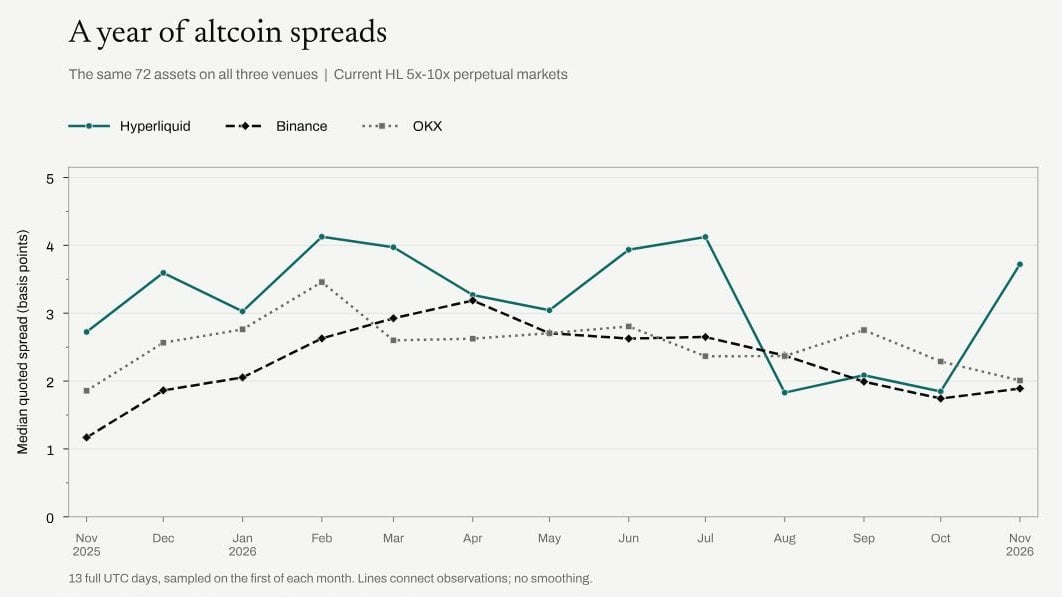
In the past year, the spreads of 72 long-tail tokens have risen across all three platforms, with Hyperliquid's spread showing more volatility, significantly increasing towards the year's end, consistently staying above those of Binance and OKX.
Are Participants on the Liquidity Supply Side Decreasing?
I reviewed the underlying account structure, merging master accounts and their associated sub-accounts into the same account group for statistics, avoiding double counting of the same trading entity. Using this method, we can identify each trading account group, even if we cannot determine the institutions behind the accounts.
I initially thought that a small number of top market makers accounted for the vast majority of trading volume, but the annual transaction data does not support this hypothesis. Comparing a week from a year ago to a recent week across the same 80 trading markets: the median proportion of transaction volume for the largest account group dropped from 25.2% to 14.6%. Hence, the decline in liquidity throughout the year cannot simply be attributed to a single large institution withdrawing orders. We are also more concerned with the short-term changes in market order behavior within the past month.
Focusing on the last month, we used the same sample of 72 tokens as in the spread analysis. The change point is very clear: since around October 30, the spread has continuously widened, with liquidity close to the mid price further concentrating. Comparing the periods of October 8–14 and October 31–November 6: the median proportion of orders within 25 basis points for the largest account group increased from 34.5% to 38.6%; the median quoted spread rose from 2.13 basis points to 3.55 basis points. This change aligns closely with the pain points reported by market makers.
However, this observation period coincided with Binance's security event on October 29, so we cannot fully attribute the changes solely to priority fees or network congestion based on this data alone.
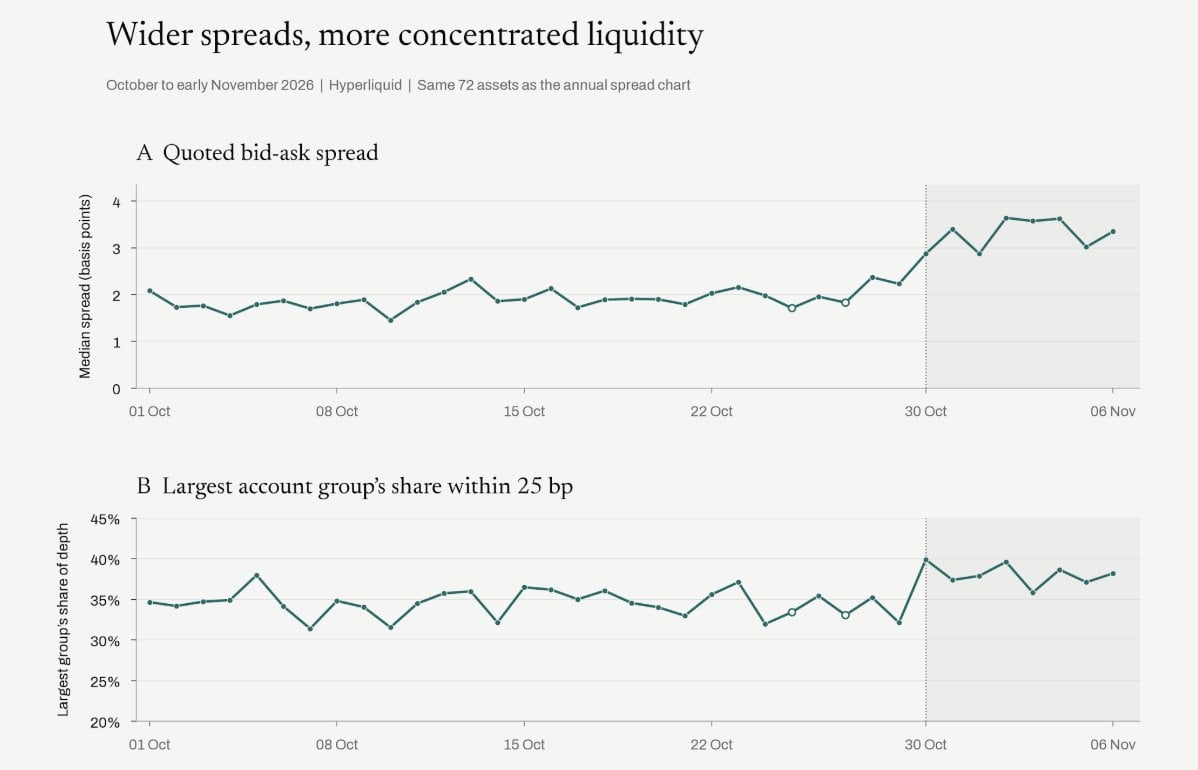
From late October to early November 2026, the spreads of long-tail tokens on Hyperliquid widened, while liquidity within the 25 basis point range concentrated on the top accounts.
Breaking down account actions, it can be seen that around November 3, a major liquidity provider significantly removed their quotes, and other account groups consequently increased their market share. This could also be a trigger for the deterioration of liquidity this time, and we need to continue tracking it moving forward.
Fee Structure Has Inherent Flaws
The fee mechanism itself has structural issues. We统计 historical fees from **54 account groups** while weighting according to transaction volume: the lowest four groups have an average fee rate of **0.961 basis points**, while the highest four groups can receive a rebate of **0.236 basis points**.
For small to medium-sized market makers with low trading volume, they must first earn about **1.2 basis points** to cover the fee costs, while hedging losses and slippage are additional costs. The market spreads themselves often only range in a few basis points, making it difficult to bear this cost pressure; hence, small to medium-sized market makers are naturally at a disadvantage.
The trend of reducing the number of entities participating in quoting is also clear. Again using the 72 trading markets as samples and comparing the data from October 8–14 and October 31–November 6: within the 25 basis points range, the median number of account groups that posted effective quotes of at least **$1000** on both buy and sell sides dropped from **7.64** to **6.39**. Even excluding the factors of token price declines, among the 72 markets, **58** saw a decrease in the number of quoting account groups. The parties willing to provide effective quotes near the transaction price are becoming fewer.
HIP‑4 Also Relies on Small and Medium-Sized Market Makers
Network congestion is another major challenge.
The current congestion quota rules of Hyperliquid use the weighted market share of addresses from the previous UTC calendar day as the basis. During peak network congestion times, a single address can occupy up to double its share of block space. To obtain a quota, one must first generate trading volume; to successfully execute trades and accumulate trading volume, one also needs quota guarantees for orders. Many traders participating in HIP-4 have reported the same dilemma: during network congestion, it is impossible to submit quotes.
In fact, these low-volume small and medium-sized market makers are already bearing a considerable portion of the liquidity supply work. In the 256 HIP-4 contracts sampled on November 10, four professional wallets contributed **47%** of the displayed depth within a 25 basis point range of the mid price. The size of the market is currently still small, with many binary prediction markets belonging to this pattern. If Hyperliquid hopes for the long-tail prediction markets to possess ample liquidity, it must ensure that this supply model can continue to operate.
The core point of this article: the solid liquidity of long-tail assets is the primary reason traders initially chose Hyperliquid. However, in this matched observation of the trading market, the comparative advantage of Hyperliquid relative to Binance has clearly diminished. To maintain the competitiveness of the order book, the platform must retain enough market-making teams capable of quoting. Constantly squeezing the survival space of small to medium-sized market makers outside the top players easily risks losing its most core advantage. For HIP-4 to succeed, it should ensure from the outset that small and medium-sized market makers can reliably place orders, and Hyperliquid needs to optimize its mechanisms around this goal.
免责声明:本文章仅代表作者个人观点,不代表本平台的立场和观点。本文章仅供信息分享,不构成对任何人的任何投资建议。用户与作者之间的任何争议,与本平台无关。如网页中刊载的文章或图片涉及侵权,请提供相关的权利证明和身份证明发送邮件到[email protected],本平台相关工作人员将会进行核查。


