
Authors: Liu Gang, Yang Xuanting, CICC Insight
Recently, U.S. stocks have experienced significant volatility, with the "noise" from policies after the midterm elections triggering market turmoil. Key challenges also include AI's current issues of demand being inconsistent as well as high investment levels, which have been exposed prematurely.
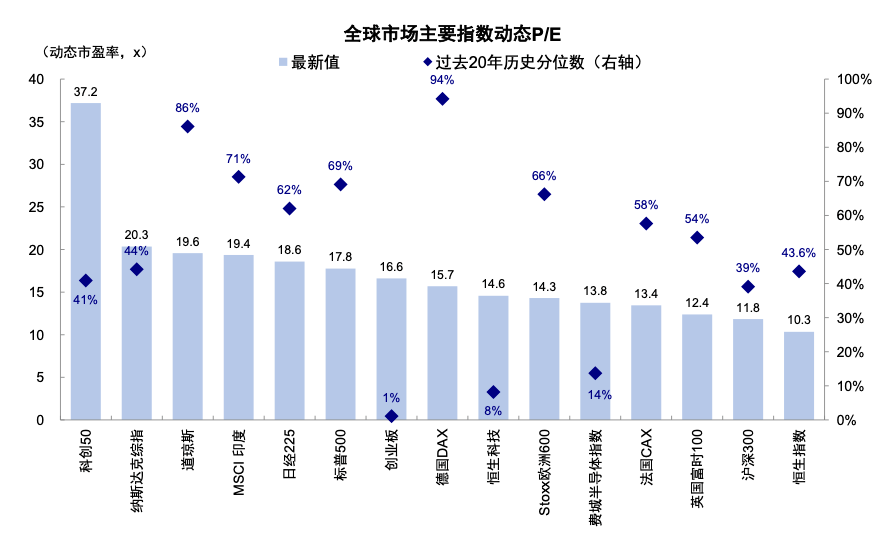
Of course, this rapid clearance may not be a bad thing for long-term trends, as it helps to digest overly high expectations and positions, which could actually be beneficial for future upward momentum when new catalysts emerge, although it will require waiting for new catalysts to appear. It is worth noting that the gains in U.S. stocks this year are primarily driven by earnings contributions rather than valuation expansion, and after a recent pullback, valuations have quickly decreased. Apart from the Dow Jones at a valuation of 19.6 times, still at the 86th percentile historical ranking over the past 20 years, the S&P 500 and Nasdaq have seen their valuations drop to 17.8 times and 20.3 times respectively, corresponding to the 70th and 44th percentiles over the past 20 years, with the semiconductor sector even dropping to 13.8 times, marking only the 14th percentile of the past 20 years.
Chart 1: Valuations of the S&P 500, Nasdaq, etc., have clearly declined, with the semiconductor sector even falling to the 14th historical percentile


Source: FactSet, CICC Research Department
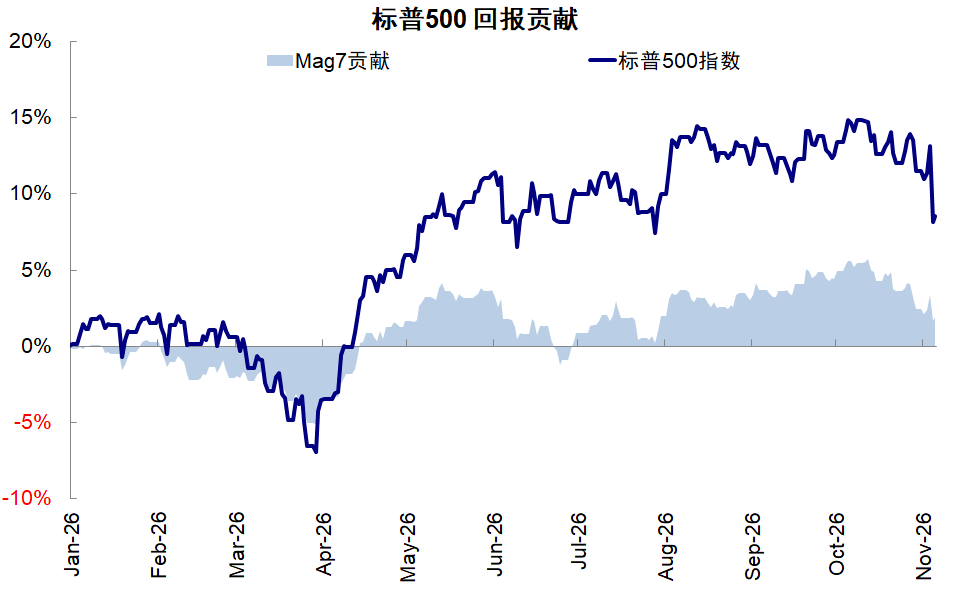
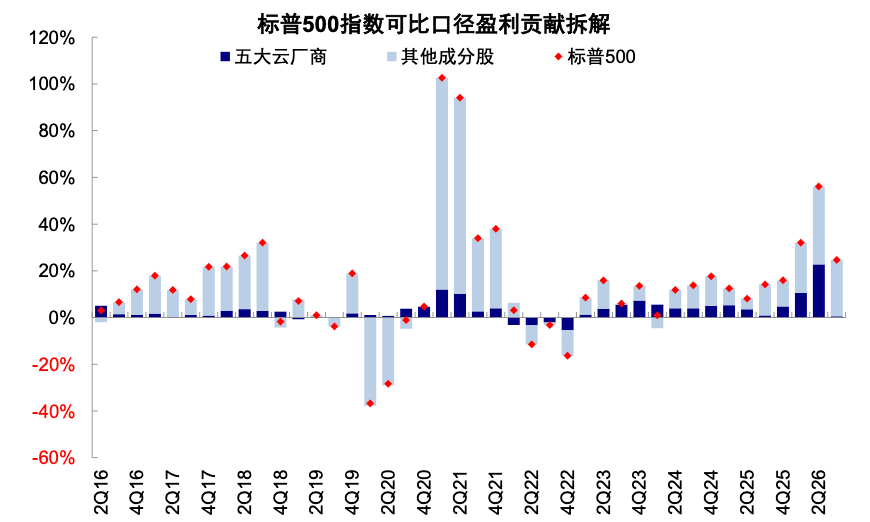
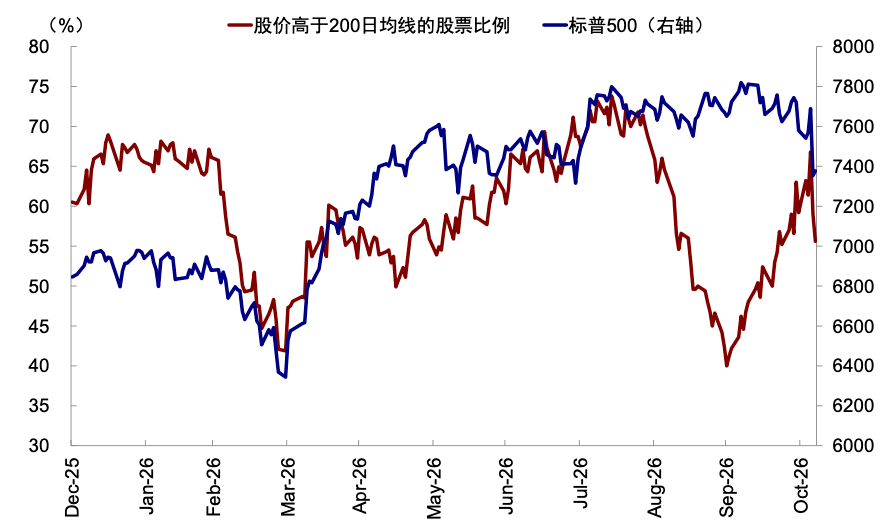
This year's "K-shaped divergence" in the U.S. fundamentals has led the market to concentrate on and rely on a few directions: 1) The U.S. Magnificent 7 (Mag7) has contributed 22% to the S&P 500's increase since 2026, having at one point contributed 40% before dropping in mid-October; 2) The five major cloud providers accounted for 20% of S&P 500 earnings in the first three quarters of 2026, contributing 25% to S&P 500 earnings growth; 3) The concentration effect remains, as the S&P 500 has risen 8% since the beginning of the year, but the share of stocks above the 200-day moving average has decreased from 60% at the beginning of the year to 55%, with the divergence particularly noticeable in August and September. However, AI currently lacks catalysts at the modeling and application levels and is also facing policy uncertainties, while traditional demand is suppressed by high interest rates. In other words, the main directions face challenges, and traditional directions are yet to take the baton, explaining the overall turmoil.
Chart 2: The U.S. Magnificent 7 has contributed 22% to the S&P 500 gains and losses since 2026


Source: Bloomberg, CICC Research Department
Chart 3: The five major cloud providers contributed an average of 37% to the S&P 500 earnings growth in the first half of the year


Source: FactSet, CICC Research Department
Chart 4: Market breadth also narrowed significantly in August, with the index maintaining a high level but the proportion of components above the 200-day moving average clearly declining


Source: FactSet, CICC Research Department
Therefore, the market needs two catalysts: either a significant breakthrough in AI or the Federal Reserve ending tightening or even shifting to easing. Before that, we recommend a cautious wait-and-see approach: 1) Focus on whether there will be negative liquidity feedback in the short term or further policy disturbances (the new Congress arriving in early next year); 2) Control positions to retain space for subsequent allocation; 3) Adjust structures. Even within technology, focus can be prioritized on cloud providers and computing chips that have low AI exposure or are undervalued and have more bargaining power.
The first quarter of next year is a crucial point: 1) A clear turning point for the Federal Reserve is expected to arrive early next year. Strong non-farm payrolls in October have strengthened the prospect of a rate hike in December, and inflation is more likely to decline early next year due to the high baseline; 2) The quarterly reports to be released in January. The ROIC of tech companies may continue to be pressured, by then AI will need to deliver new progress; 3) The new Congress in the U.S. will be inaugurated on January 3rd next year. The policies from Trump before the new Congress takes office and the continuous statements from newly elected members may lead to persistent disturbances that the market needs to digest, and it may gradually desensitize after the new Congress is in office. So, by that time, either AI must make progress, or the Federal Reserve's tightening expectations must decline, perhaps providing support or an opportunity.
We have outlined the fluidity disturbances in the context of midterm election policies and market turmoil in our articles titled The Asset Implications of the Democratic Party's "Sweep" and How to View the Sharp Decline in U.S. Stocks?. In this article, we further combine the quarterly earnings of U.S. stocks that have basically been disclosed to answer the question of the outlook for U.S. stocks from a fundamental perspective.
Market Drivers: Earnings are the market's leading factor, AI contributes 60% of growth; growth rate shows a turning point
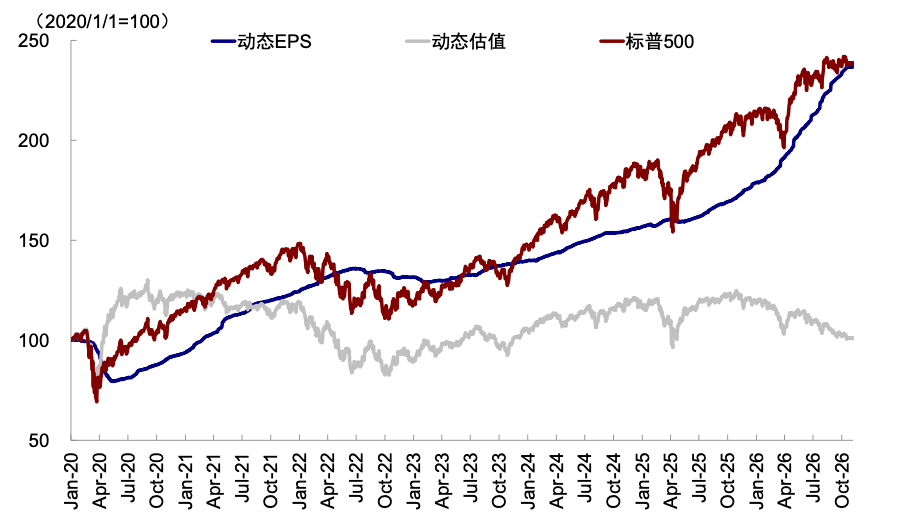
First, strong earnings growth is the main driver of U.S. stocks. From the beginning of the year to now, the gains in the major U.S. stock indices have been contributed by earnings. The S&P 500, Dow Jones, and Nasdaq have increased by 8%, 7%, and 6% respectively, during which dynamic earnings have grown by 29%, 17%, and 40%, offsetting the contraction in valuations. In the third quarter, S&P 500 earnings grew by 25%, a decline from 32% and 56% in the first and second quarters, but still above the average quarterly earnings growth rate of 12% during 2023-2025.
Chart 5: The gains in U.S. stocks this year are fundamentally driven by earnings contributions and not reliant on valuation expansion


Source: FactSet, CICC Research Department
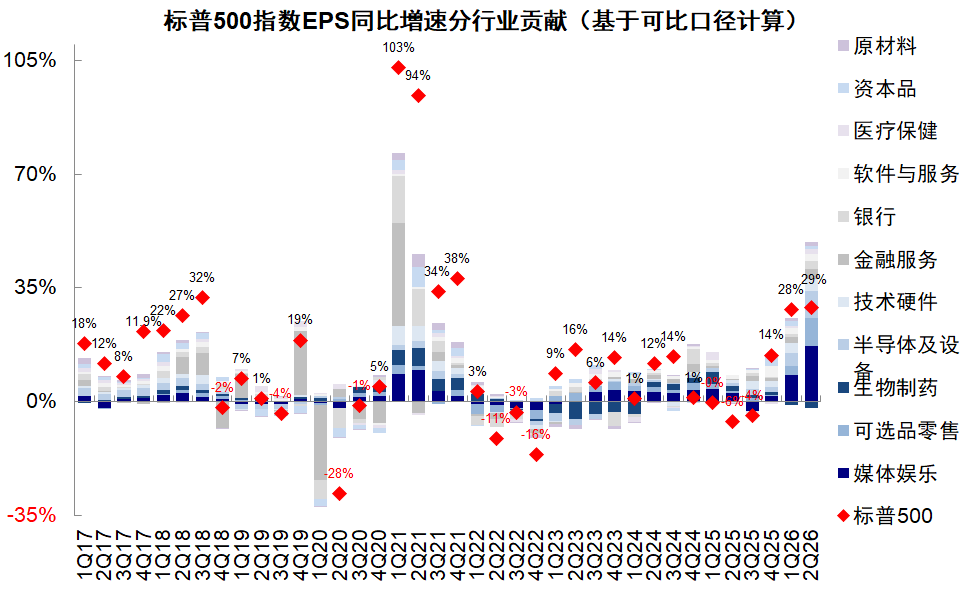
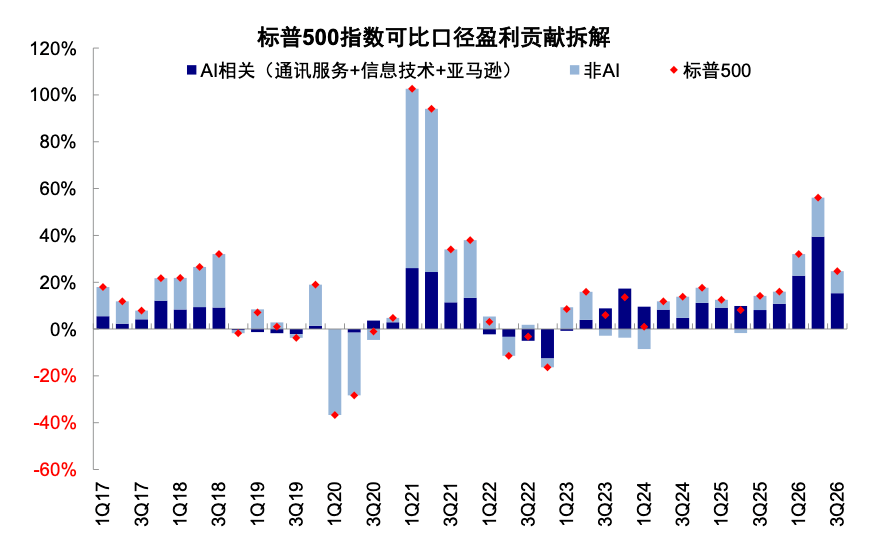
Second, AI-related sectors contributed 60% of earnings growth. Estimating the earnings situation of the AI sector through communications services, information technology, and Amazon, it contributed 62% to overall earnings growth in the third quarter, down from 70% in the second quarter. Among these, information technology contributed 58%, supporting most of the growth in the AI sector, while communications services saw a significant slowdown in growth, especially in the media and entertainment sub-industry, which weakened its contribution. This means that overall earnings growth is heavily reliant on AI; if AI is excluded, the earnings growth in the third quarter may fall to 15%.
Chart 6: Information technology contributed 58% to this quarter's earnings growth, while the contribution from communications services decreased from 24% in the second quarter to 4%


Source: FactSet, CICC Research Department
Chart 7: AI-related sectors contribute 60% of the overall earnings of the S&P 500


Source: FactSet, CICC Research Department
Traditional demand's earnings in the third quarter were not poor, but still dragged down by high interest rates. In terms of growth rates, sectors like energy (150%), semiconductor equipment (110%), real estate management and development (49%), and capital goods (48%) led, while transport (-37%), telecommunications services (-34%), financial services (-14%), and insurance (-11%) lagged. In terms of contributions, sectors like industrials, materials, utilities, and consumer staples collectively contributed 10% to profits, while financial and real estate contributions turned negative, dragging down overall growth by 7.5%.
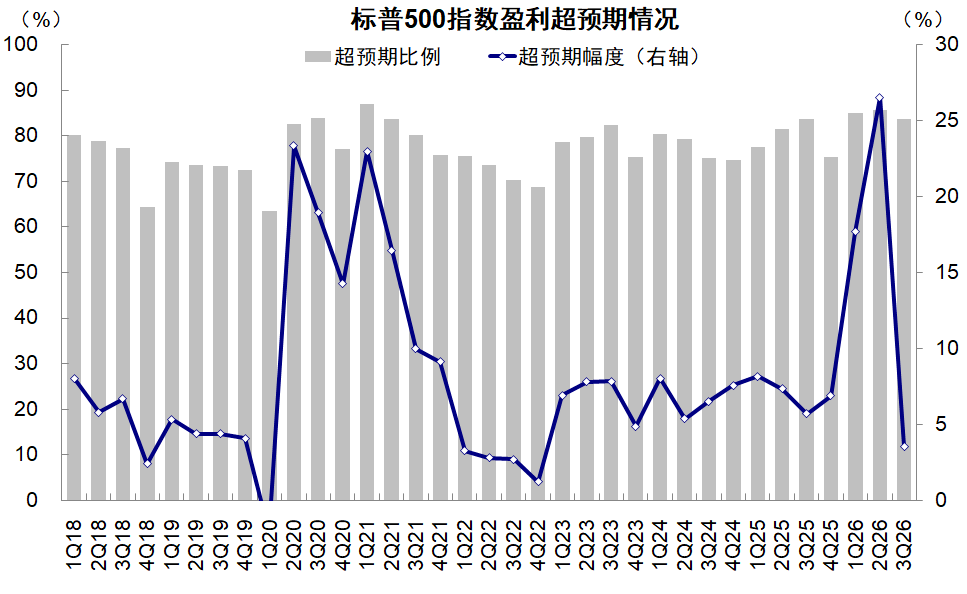
Third, a turning point in growth has emerged, marking the first slowdown since Q2 2025. The S&P 500 earnings growth in the third quarter was 25%, a slowdown compared to the first two quarters this year. The market has become more "picky" about earnings, requiring not only high growth but also continuous beating of expectations, which has increased the difficulty of exceeding expectations in the third quarter. The proportion and magnitude of surpassing expectations among S&P 500 constituents have both declined, with the proportion falling slightly from 86% in the second quarter to 84%, while the magnitude of surpassing expectations significantly fell from 27% in the second quarter to 3.5%, the lowest level since Q4 2022. Among these, the communications services sector, including Google and Meta, has seen the largest decline, with earnings falling from exceeding expectations by 99% in the second quarter to being below expectations by 19% in the third quarter.
Chart 8: The proportion of S&P 500 exceeding expectations has slightly declined from 86% in the second quarter to 84%, with the magnitude of exceeding expectations significantly falling to 3.5%


Source: FactSet, CICC Research Department
AI Direction: Revenue lags behind investment; returns decline, but still exceed costs; can withstand interest rates dropping to 6-6.5%
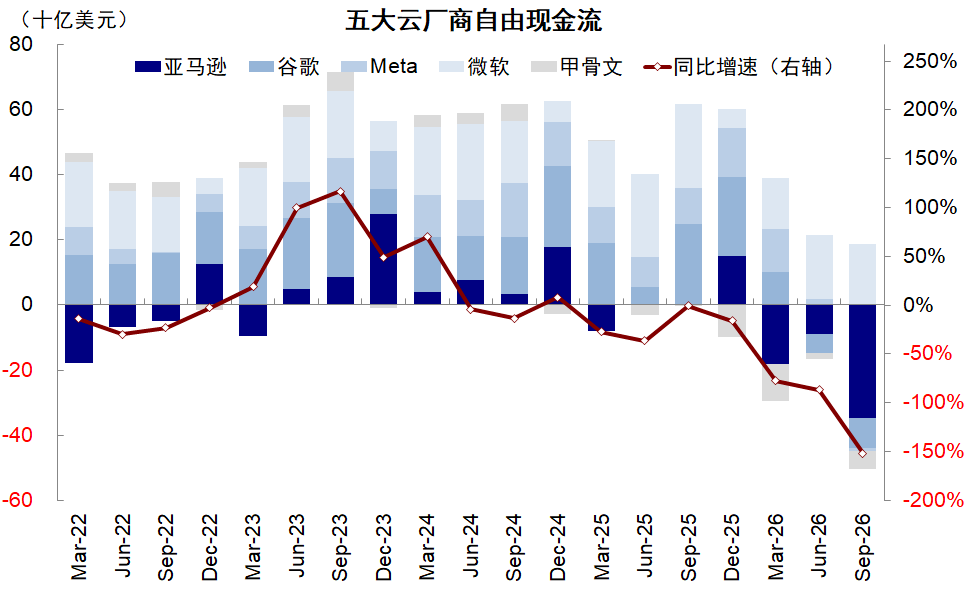
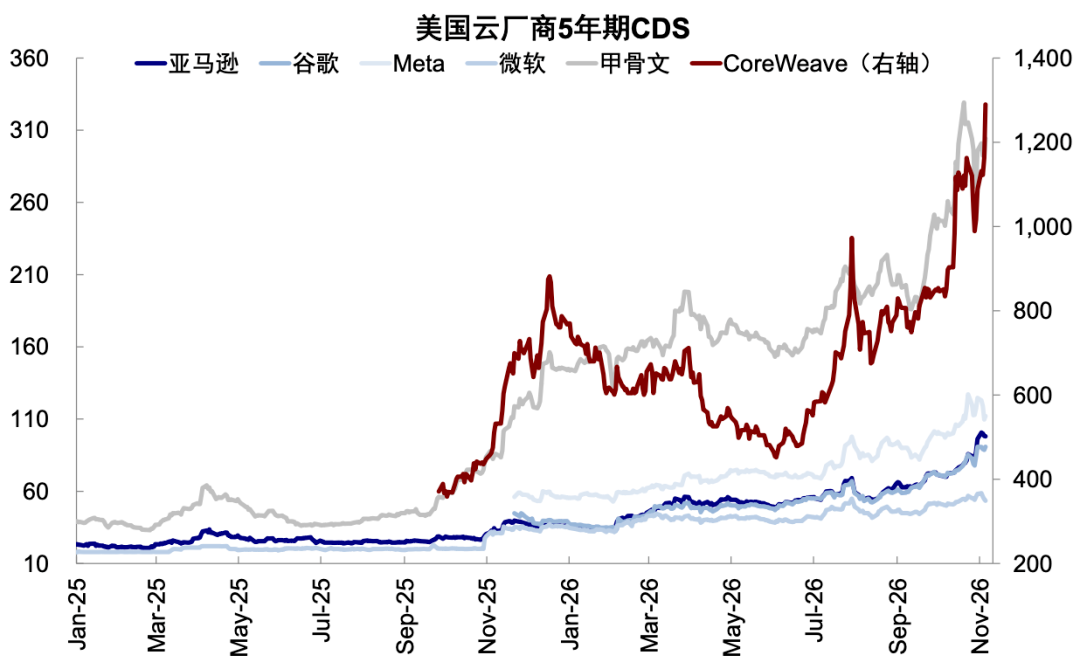
1) Revenue lags behind investment. Capital expenditures are accelerating, free cash flow has turned negative, and external financing pressures are rising. The capital expenditure of the five major cloud providers in the third quarter totaled $230 billion, rising from $181.5 billion, with a year-on-year growth rate accelerating from 87% in the second quarter to 118%. However, the growth rate of operating cash flow has significantly declined, from 38% in the second quarter to 19% in the third quarter, with total cash flow at $198 billion insufficient to cover the capital expenditure during the same period. This has led to the free cash flow of the five major cloud providers turning from positive $4.8 billion in the second quarter to negative $31.8 billion in the third quarter, with Amazon, Meta, Google, and Oracle all moving to negative free cash flow, further increasing the need for external financing. Amid a backdrop where AI demand has yet to break through existing application ceilings and the investment return outlook remains unclear, the market's focus on financing costs and sources has clearly increased, with concerns about credit risk intensifying, as seen with CDS for the five major cloud providers reaching historical highs.
Chart 9: The free cash flow of the five major cloud providers turned from $4.8 billion in the second quarter to -$31.8 billion in the third quarter


Source: FactSet, CICC Research Department
Chart 10: CDS for the five major cloud providers have also reached historical highs


Source: FactSet, CICC Research Department
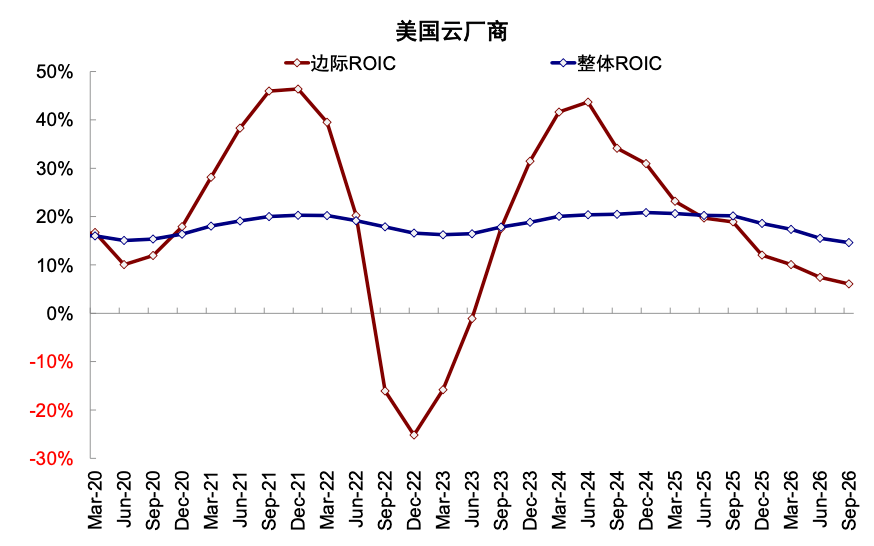
2) Returns exceed costs. Marginal ROIC has further declined, but overall returns can still cover financing costs. As capital investment continues to expand, new operating returns have not kept pace; the five major cloud providers' marginal ROIC has declined from a peak of 44% in Q2 2024 to 6.1%, driving the overall ROIC further down to 15%. Nevertheless, the overall ROIC remains above the current weighted average cost of capital (WACC) of about 10% for the five major cloud providers, indicating that cloud providers can still achieve excess returns.
Chart 11: The overall ROIC of the five major cloud providers further declined from 16% in the second quarter to 15%, and the marginal return rate also fell to 6.1%


Source: FactSet, CICC Research Department
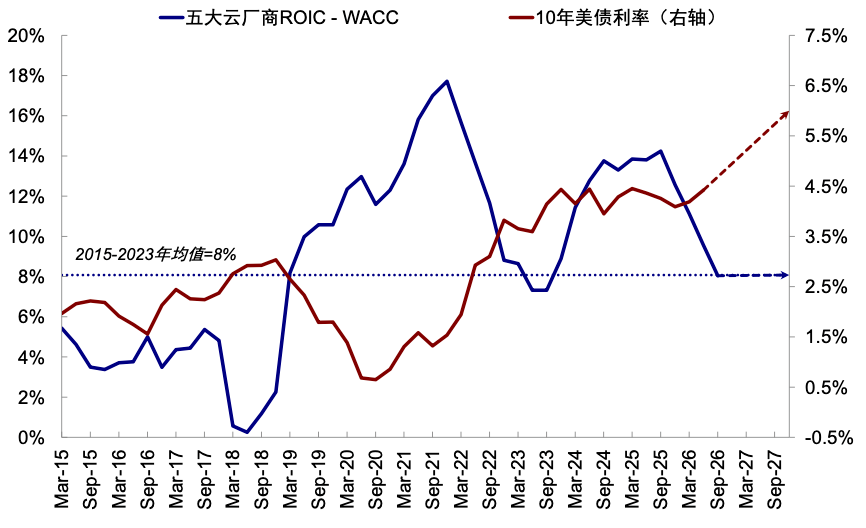
The decline in marginal returns means that AI can only withstand interest rates dropping to 6-6.5%. Previously, we calculated that if the five major cloud providers maintained their ROIC, assuming the difference between ROIC and WACC narrows to the historical average level of 8 percentage points before the rise of AI trends in 2015-2023, the corresponding risk-free rate they could withstand would be around 7-7.5% (as discussed in AI transitioning from being a "friend" to a "foe" for traditional demand?). However, as the marginal investment returns further weaken in Q3, the difference between ROIC and WACC has converged to historical averages, coupled with expected returns for 2027, the level of risk-free interest rates that AI can withstand has dropped to 6-6.5%.
Chart 12: Based on expected returns for 2027, AI can withstand risk-free interest rates dropping to 6-6.5%


Source: FactSet, CICC Research Department
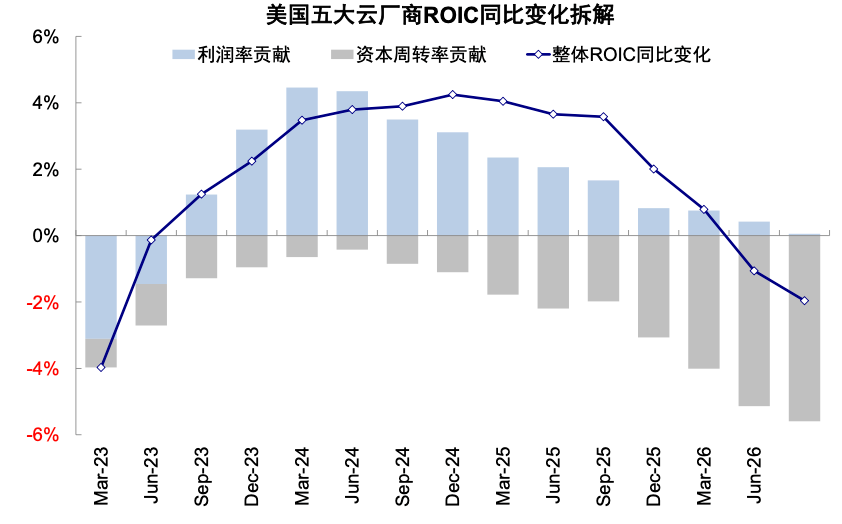
3) The "asset-heavy" nature of cloud providers puts pressure on capital turnover rates. Further breaking down ROIC into after-tax operating profit margin (NOPAT/Revenue) and capital turnover rate (Revenue/IC), the after-tax operating profit margin of the five major cloud providers has continuously increased since 2023, rising from 14.8% to 22.1% in the third quarter; however, capital turnover rates have been declining, dropping from a high of 109% in Q1 2023 to 66% in the third quarter, creating a new low since 2015. Meanwhile, since Q2 2025, the slowing improvement in profit margins has failed to offset the drag from capital turnover rates, leading to a continuous decline in ROIC for the five major cloud providers.
Chart 13: Since Q2 2025, the improvement in profit margins has failed to offset the negative drag from capital turnover rates


Source: FactSet, CICC Research Department
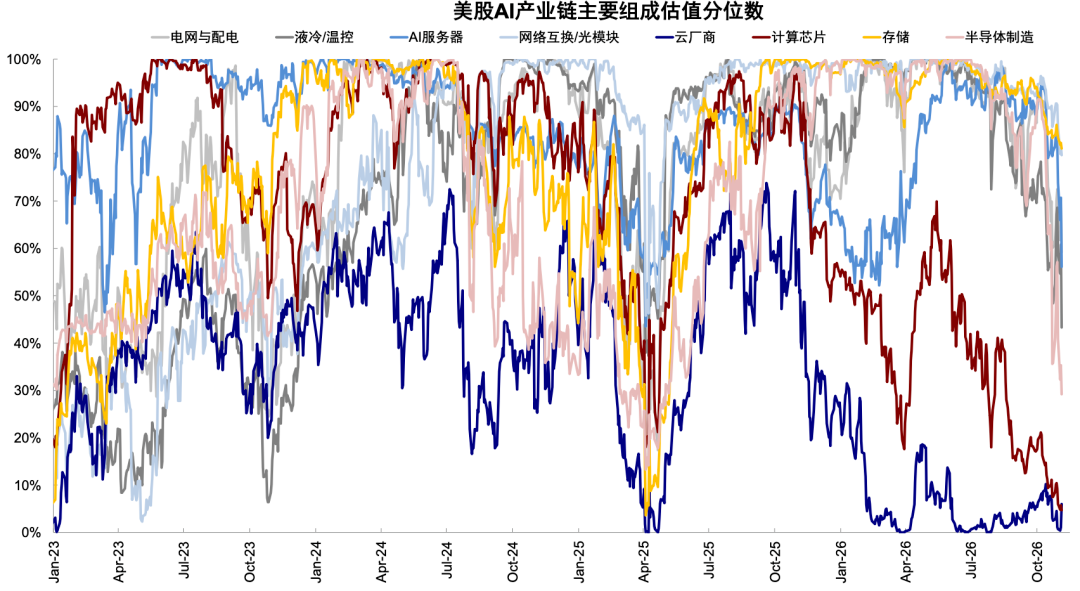
Further differentiation within technology; certain hardware sectors still need to digest growth expectations; cloud provider pricing remains relatively reasonable. Some hardware infrastructure that includes high growth expectations, such as network interconnection/light modules, semiconductor manufacturing, and liquid cooling/temperature control, have recently seen significant valuation pullbacks; for example, the valuation of the semiconductor manufacturing sector has quickly dropped from the 90th percentile ranking at the beginning of October to around 20%. In contrast, cloud providers have not assigned a significant valuation premium to new earnings, and there is relatively limited room for valuation adjustment.
Traditional Sectors: Interest-sensitive segments suppressed by high interest rates, AI’s effects gradually manifest
Traditional demand has yet to show comprehensive improvement. In terms of consumption, service consumption is stronger than goods consumption. Profit growth in consumer services, food and beverage and tobacco, and automobile and components grew by 12%, 8.7%, and 7.3% respectively, while durable goods and apparel, as well as household and personal items fell by 5.4% and 10.3%. The divergence in the industrial sector is more pronounced, with capital goods reporting profit growth of 48.3%, and commercial and professional services growing by 16.2%, but transportation, impacted severely by high oil costs, fell by 37.1%. In the financial sector, banks showed a slight profit growth of 4.8% supported by net interest income, while insurance and financial services faced declines of 10.7% and 13.6% respectively due to fluctuations in investment gains and losses.
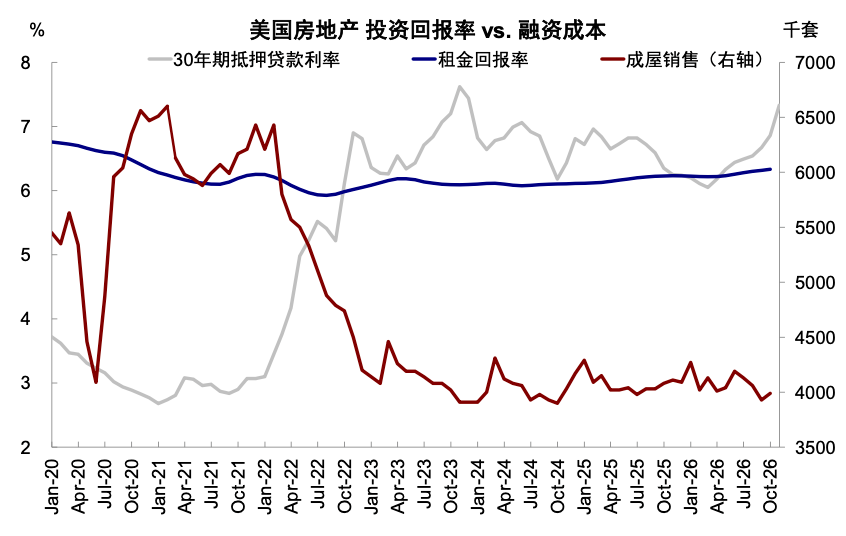
Growth remains resilient, but interest-sensitive growth segments continue to struggle. Recent macro data reflects that current U.S. growth remains resilient, with Q3 real GDP growing at an annualized rate of 3.4%, exceeding the expected 3.2% and the 2.2% from the second quarter. Excluding AI-related investments, private consumption also remains strong, particularly in service consumption related to healthcare, dining, and accommodation. The ISM manufacturing and non-farm payrolls in October also surpassed expectations, with unemployment dropping from 4.2% to 4.1%. However, high interest rates continue to suppress residential mortgage and credit demand, with the 30-year mortgage rate rising consistently since the beginning of the year, at one point reaching 7.4% in October. Real estate sales remain stuck at low levels, with existing home sales slightly rebounding in September on a month-to-month basis but an annualized sales volume of only 3.99 million units, while new home sales fell to 676,000 units. On the other hand, declining returns from AI may also start to "crowd out" traditional demand's physical and financial resources. As emphasized in our article AI transitioning from being a "friend" to a "foe" for traditional demand, the positive externalities brought by AI demand once supported U.S. economic growth, but as AI requires more external funding to support investment, the crowding-out effect on traditional demand is also unavoidable, as illustrated by AI’s substantial bond issuance and the ongoing need for the Federal Reserve to raise interest rates.
Chart 14: Interest-sensitive segments such as home sales have been bottoming since 2023


Source: FactSet, CICC Research Department
Greater improvements still require declines in interest rates to cooperate. Previously, we estimated for real estate and non-AI companies that traditional demand can withstand a 10-year U.S. Treasury yield of around 4%. While there is resilience now, high interest rates still continuously pressure residents' home purchasing and SME credit demand further release, reflected in insufficient credit expansion dynamics in the household sector. In the short term, resilient growth and employment data make it lack immediate motivation for the Federal Reserve to shift, but the weakness in traditional demand does not support large rate hikes from the Federal Reserve. If AI expectations remain weak in Q1 next year, then the market's expectations for the Federal Reserve's tightening may decline, creating conditions for interest rate drops and a recovery in traditional demand.
Outlook Judgment: The market needs catalysts from either an end to tightening or progress in AI, with early next year as a key node
The market currently finds itself in a "transitional" stage regarding AI expectations, with the key issue being the lack of new narratives and catalysts without demand and models, which also amplifies the risks of credit and regulatory pressures. High-intensity capital expenditures continue to squeeze cloud providers' free cash flow, leading to increased concerns over the speed at which AI revenue is being realized and the investment return rate, which is akin to last year's logic when market worries about private equity and credit risk arose due to insufficient AI progress.
In this context, the market needs two catalysts: either significant breakthroughs in AI or the Federal Reserve ending tightening or even transitioning to easing. If neither occurs, it may affect investors' willingness to re-enter for bottom fishing and will also amplify volatility. In the short term, it is necessary to pay attention to whether negative liquidity feedback will arise or whether further policy disturbances will occur (the new Congress taking office early next year, and whether Trump will leverage this window for policy maneuvering). Q1 next year is a critical validation point where the new Congress takes office, AI earnings fulfilling expectations, and changes in inflation will all occur.
Before that, we continue to recommend a cautious wait-and-see approach.
Cautiously observe, as before the aforementioned catalysts appear, closely monitor whether negative liquidity feedback will occur and whether there will be further policy disturbances. Currently, the S&P 500 index has returned to near its annual line, and prior adjustments have released some emotion, but the market still lacks new upward catalysts, and segmented liquidity and the December rate hike from the Federal Reserve may also lead to further disturbances. Therefore, we recommend waiting for the appearance of these catalysts and for investment return outlooks to become clearer before making allocations. In an extreme scenario, if the additional earnings growth brought by AI expectations is completely "erased," then the dynamic earnings growth may drop to 10%, and assuming valuations fall synchronously to 16-17 times, this would correspond to the S&P 500 index having about a 10% downside potential.
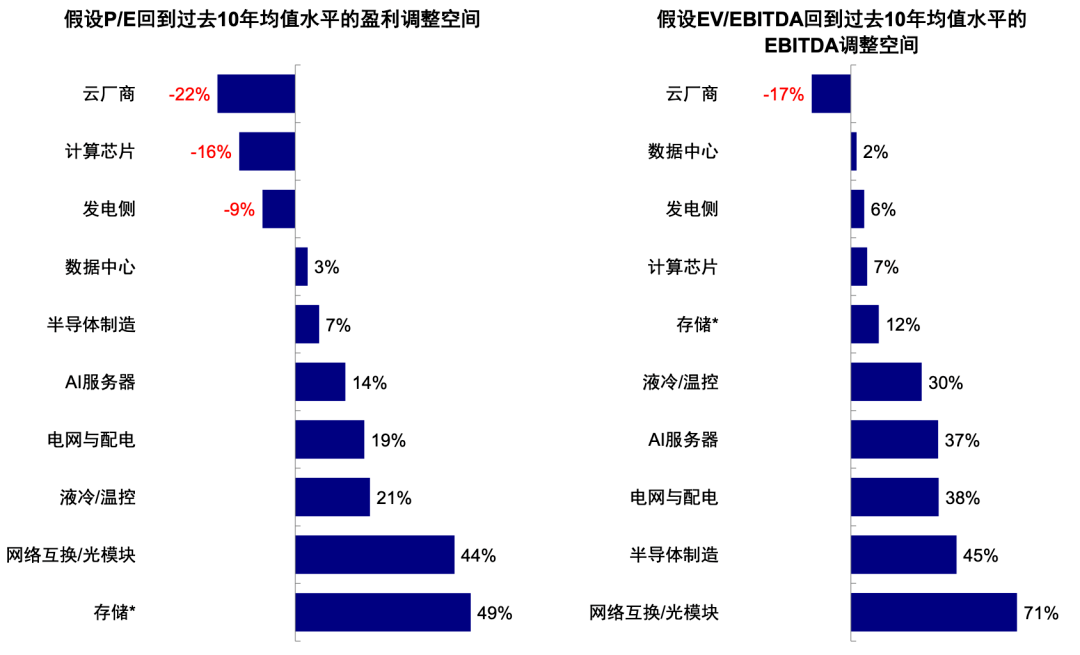
Besides controlling positions well, one can also adjust the portfolio structure; even within technology, priority can be given to cloud providers and computing chips that have low AI exposure or are undervalued and have more bargaining power. Recent market performance has reflected this difference: sectors that had accounted for substantial growth expectations have seen more notable pullbacks, while cloud providers have remained relatively resilient. Using the average valuation from the past 10 years as a reference, segments such as optical modules, semiconductor manufacturing, and grid and distribution need to adjust their earnings upwards by 40-70% to match current pricing, whereas cloud providers retain nearly 20% room for earnings reductions.
Chart 15: Overall U.S. stock valuations are currently not at extreme highs, but there are evident divergences within the AI industry chain


Source: FactSet, CICC Research Department
Chart 16: High-growth expectation segments such as optical modules, semiconductor manufacturing, and grid and distribution need to adjust earnings upwards by 40-70%, while cloud providers retain nearly 20% space for subsequent earnings growth


Source: FactSet, CICC Research Department
免责声明:本文章仅代表作者个人观点,不代表本平台的立场和观点。本文章仅供信息分享,不构成对任何人的任何投资建议。用户与作者之间的任何争议,与本平台无关。如网页中刊载的文章或图片涉及侵权,请提供相关的权利证明和身份证明发送邮件到[email protected],本平台相关工作人员将会进行核查。


