The resilience of ETF holdings and the central bank's gold reserves reaching a 30-year high provide support, but once the $12 trillion paper profit triggers rebalancing sell-offs, gold prices may experience "bitcoin-style" extreme volatility.
Written by: Xu Chao, Wall Street Journal
The gold price trend is at a critical junction. Citigroup's latest report indicates that gold's outlook highly depends on the situation in the Middle East—if the situation eases, gold prices are expected to rise to $4,500 per ounce within the next three months, with a 12-month target price of $5,000; if the conflict continues, gold prices face the risk of falling back to $3,500.
Maximilian Layton, global head of commodities at Citigroup, and precious metals strategist Kenny Hu, set the baseline scenario probability at 60%, with the core logic being: the reopening of the Strait of Hormuz combined with de-escalation in the Yemen/Saudi conflict will lead to a drop in oil prices and a shift from Fed rate hikes to cuts, thereby reigniting gold investment demand. In this scenario, Citigroup lowers its gold target price for 0 to 3 months from $4,800 to $4,500, while maintaining the 6 to 12 months target price at $5,000.
Currently, the gold market shows two completely opposing signals: physical demand is weakening, but ETF holdings remain resilient and central bank purchases continue strongly. Citigroup analysts point out that short positions in paper gold (futures) have been largely cleared; if positive developments occur in the Middle East, there is sufficient "dry powder" in the market to drive gold prices higher.
The situation in the Middle East dominates gold price direction with varying scenario probabilities
Citigroup clearly defines the outlook for gold prices as a "binary structure," highly reliant on the evolution of Middle Eastern geopolitics.
In the baseline scenario (60% probability), Citigroup anticipates that the Strait of Hormuz will eventually return to normal traffic by the fourth quarter of 2026, with Brent crude oil falling to $65 to $70 per barrel. A drop in oil prices will prompt the Fed to shift from a rate hike cycle to cuts, and lower real interest rates will benefit the rebound in gold investment demand, boosting purchasing power in emerging markets.
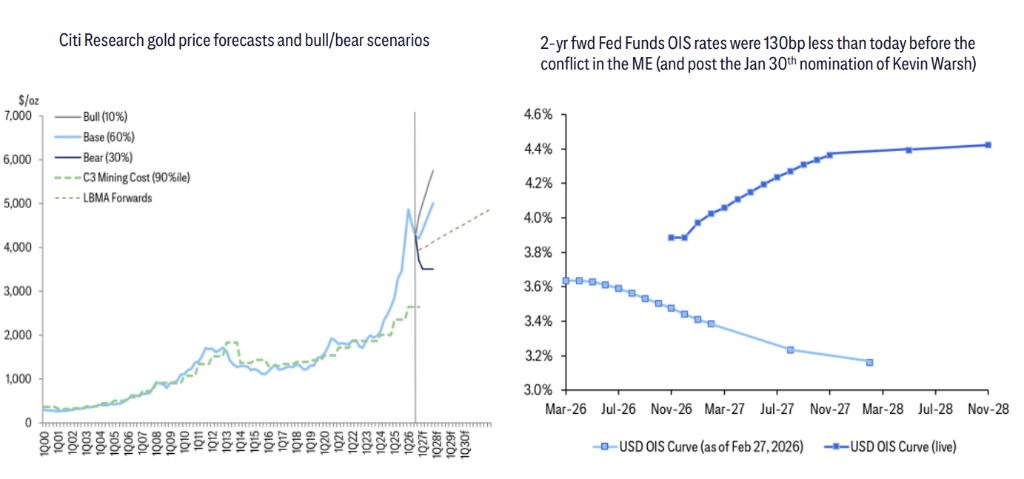
In the bull market scenario (10% probability), if the US and Iran quickly reach an agreement leading to a significant drop in oil prices, and the Fed swiftly adopts a dovish stance with a noticeable weakening of the dollar, a strong momentum market covering both paper and physical gold could form, pushing gold prices beyond the baseline target.
In the bear market scenario (30% probability), if the situation in the Strait of Hormuz remains deadlocked, and the Saudi/Yemen conflict continues to disturb energy supplies, with inflation remaining high, the Fed is forced to maintain rate hikes, putting pressure on global and emerging market investment demand, with a downward target for gold prices set at $3,500 per ounce.
The report also highlights that if the situation in the Middle East significantly escalates and impacts energy infrastructure, it may trigger cross-asset deleveraging, dragging down gold prices in the short term; however, this worst-case scenario will ultimately evolve into a beneficial "stagflation trade" for gold, directing funds towards gold in search of safe asset protection.
Physical demand weakens, ETFs and central bank purchases support the market
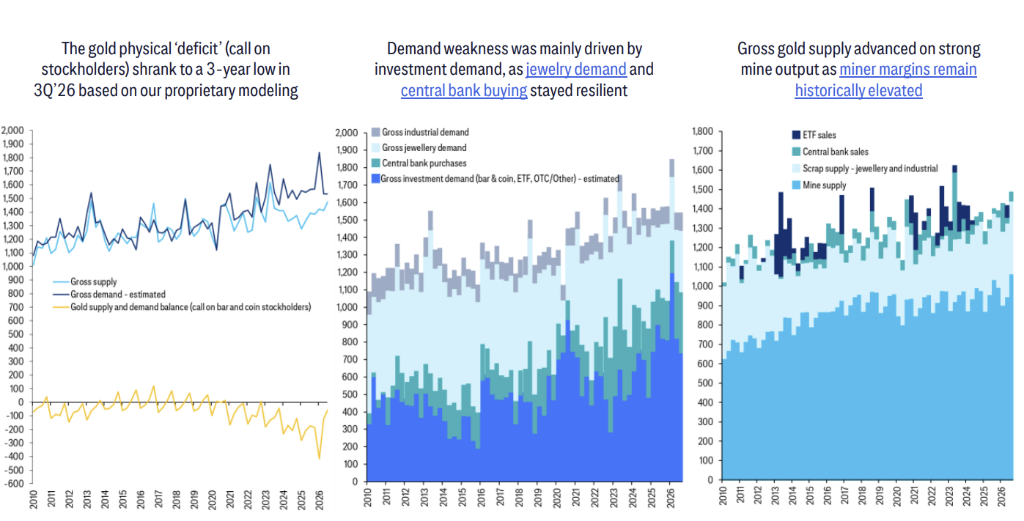
According to third-quarter data from the World Gold Council (WGC) cited by Citigroup, global gold annualized total expenditure has fallen from approximately $1.15 trillion in the first quarter of 2026 to about $82 billion in the third quarter, with a significant decline.
There is a clear divergence in physical demand. Investment demand for gold bars and coins continues to decline, while jewelry demand remains resilient without a recession environment. Meanwhile, gold ETFs have seen a large net inflow since August, following Scott Bessent's announcement of related policies, reigniting the market's hedge demand against currency depreciation. In terms of regional distribution, the UK, the US, and China are the main markets driving ETF inflows, with net inflow amounts over the past 12 months approximately 27%, 17%, and 30% respectively (according to their respective shares).
Central bank purchases of gold remain strong. Citigroup's report shows that in the third quarter of 2026, central bank gold purchases continued to strengthen after a significant rebound in the second quarter, with China and Poland being the main buyers. Gold currently makes up about 33% of global central bank reserves, the highest level in nearly 30 years.
In the Chinese market, the Shanghai Gold Exchange premium strengthened briefly before and after the National Day golden week but has recently declined significantly, falling back after reaching historical highs in the second quarter.
In India, high import tariffs continue to suppress import demand. Gold imports in September amounted to only about 410,000 ounces, a month-on-month decrease of 19% and a year-on-year decrease of 84%. Citigroup estimates that India's imports for the fourth quarter will be around 3.4 million ounces, still far below the historical quarterly average of 6.8 million ounces.
Structural bullish logic is complete, but the ceiling in the physical market limits price increases
Citigroup's report enumerates multiple structural factors supporting a long-term bull market for gold: currency depreciation concerns arising from high US debt; de-dollarization and trends toward diversifying sovereign reserves; and uncertainty in employment due to AI pushing households to increase hedge demand.
Citigroup also mentioned that if Fed Chair Kevin Warsh and the new committee adjust the 2% inflation target to a range similar to Australia’s 2% to 3%, this will become a strong catalyst for gold in the first quarter of 2027.
However, the limitation of the physical gold market constitutes a price ceiling. Citigroup estimates that annual mine supply is only about 0.1% of global household wealth, meaning that if gold’s proportion in household asset allocation increases by 0.1 percentage points, it would require doubling the annual mine supply. Currently, the proportion of gold held by global households is approximately 3.2% of net wealth, which is already the highest level in nearly 50 years, and this historically high allocation will constrain new demand.
The report also warns that over the past approximately 3.5 years, gold holders have cumulatively obtained about $12 trillion in paper gains; if even a relatively small-scale "rebalancing" sell-off occurs, it would be sufficient to significantly impact the physical market—this characteristic puts gold at risk of experiencing bitcoin-style extreme volatility when funds reverse direction.
Mine supply cannot respond to high prices in the short term; investment demand remains the core drive
Despite current gold prices being at historic highs, the response of mine supply remains very limited. Citigroup data shows that the profit margins of high-cost gold mining companies are currently at historical highs for the past half-century, but historical experience indicates that mine supply typically lags behind price increases by 3 to 10 years. There are currently no signs indicating that the supply side is about to expand significantly.
This pattern implies that the core variable affecting gold price fluctuations remains the volatility of investment demand. Citigroup points out that the current gold price trend is much more correlated with the Fed's interest rate path, the strength of the dollar, and cross-asset risk preferences than with the fundamental supply and demand of physical gold, which investors should be keenly aware of.
免责声明:本文章仅代表作者个人观点,不代表本平台的立场和观点。本文章仅供信息分享,不构成对任何人的任何投资建议。用户与作者之间的任何争议,与本平台无关。如网页中刊载的文章或图片涉及侵权,请提供相关的权利证明和身份证明发送邮件到[email protected],本平台相关工作人员将会进行核查。


