After hours liquidity shrinks, and premiums continue to differentiate; 10 charts empirically illustrate the arbitrage illusion behind tokenized US stocks.
Written by: Cooper Duschang
Translated by: Saoirse, Foresight News
From October 27 to November 2, the cumulative trading volume of tokenized stocks on major exchanges exceeded 2 billion USD. As market demand for on-chain stock exposure continues to rise, custodial institutions continuously take on underlying assets and issue tokenized stocks, driving the total market value of tokenized stocks to over 3 billion USD.
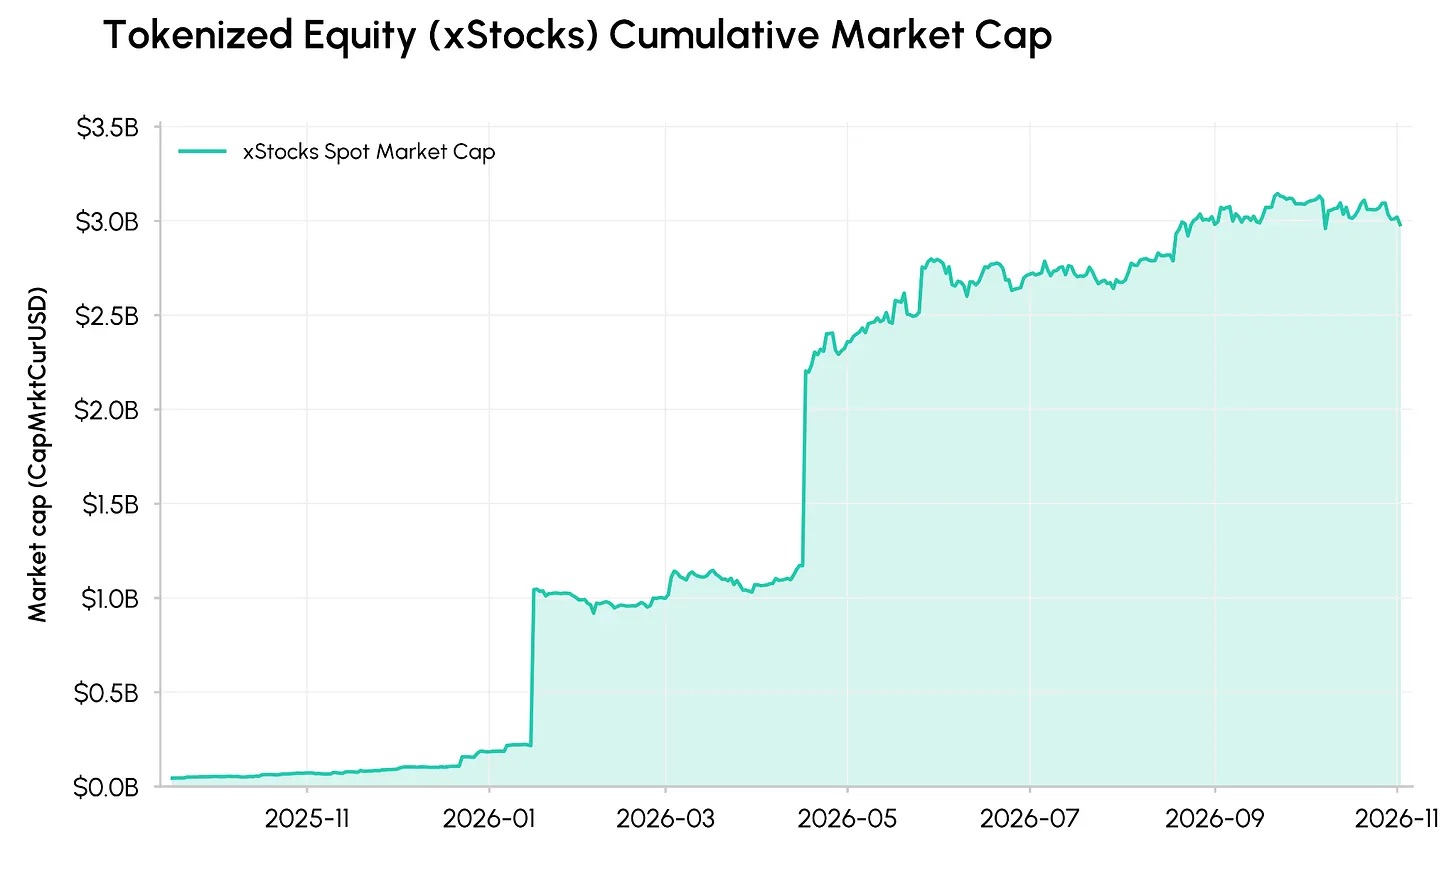
The total market value of tokenized stocks issued by xStocks has steadily grown since the second half of 2025, experiencing two notable surges in 2026, peaking above 3 billion USD in September-October 2026, followed by a slight recent decline.
Despite the total market value of tokenized stocks steadily rising to about 3 billion USD, the spot trading volume is far less than that of corresponding stock perpetual contracts. In the past week, the trading volume of stock perpetual contracts on the Hyperliquid platform was about 12.3 billion USD, six times that of the tokenized stock spot market's 2 billion USD trading volume.
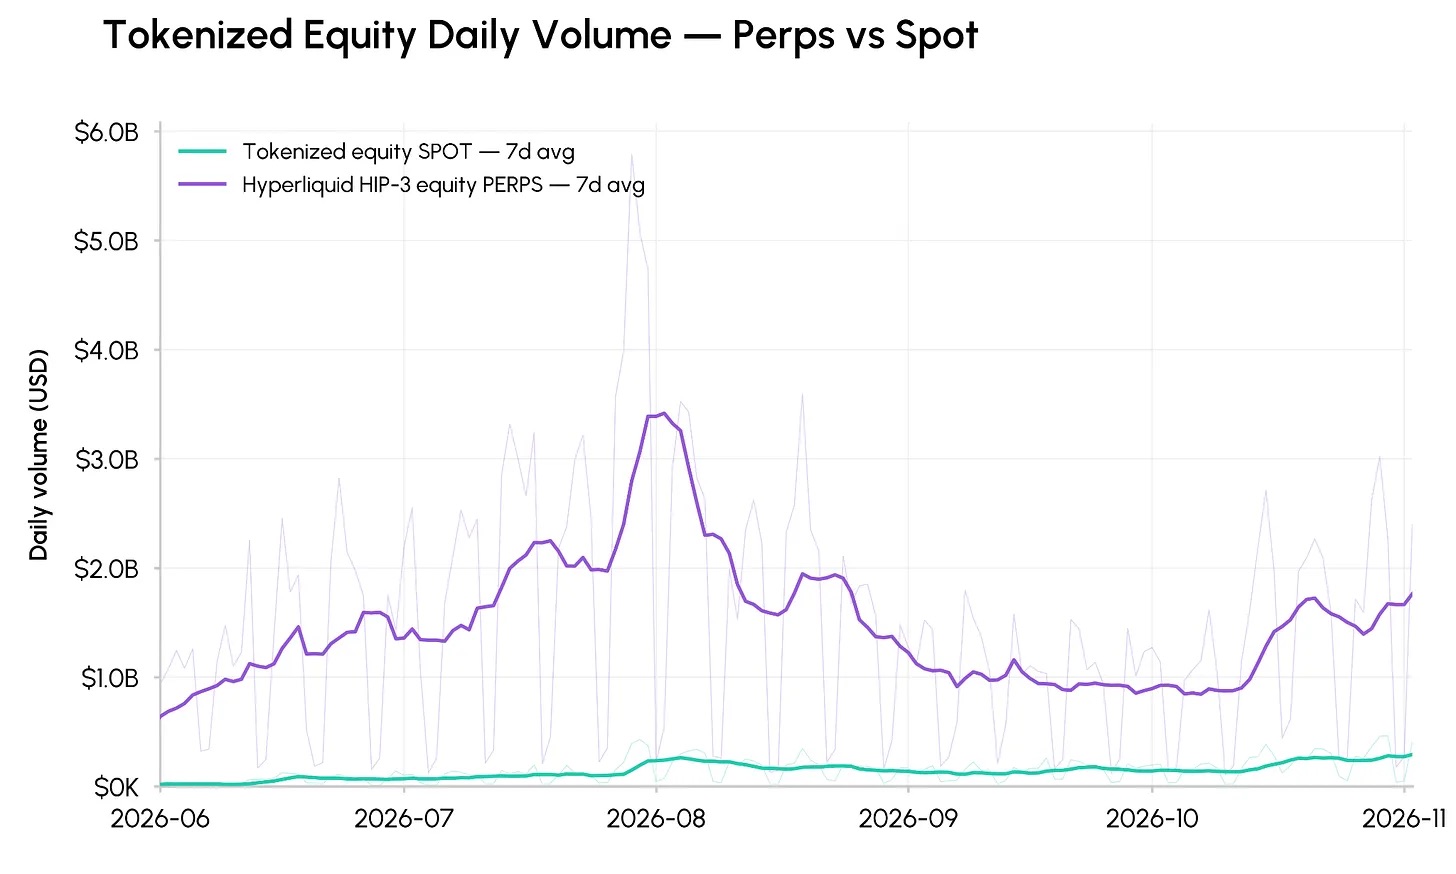
Compared the 7-day average daily trading volumes of tokenized stock spot and Hyperliquid platform stock perpetual contracts, the trading volume of perpetual contracts has long been significantly higher than spot, with greater volatility.
This article will analyze the pricing patterns of tokenized stocks relative to their underlying stocks, the price characteristics during pre-market and after-hours periods, and the market fragmentation these assets face.
Tokenized Stocks vs. Underlying Stocks
Tokenized stocks are mainly aimed at non-US investors, allowing users to obtain exposure to US stock prices on-chain, even during non-regular trading hours. Tokenized stocks are issued by institutions holding shares of the underlying stocks, which are generally kept by professional custodians. This type of token is continuously matched in a 24/7 market, with ongoing quotes even during traditional US stock market closures.
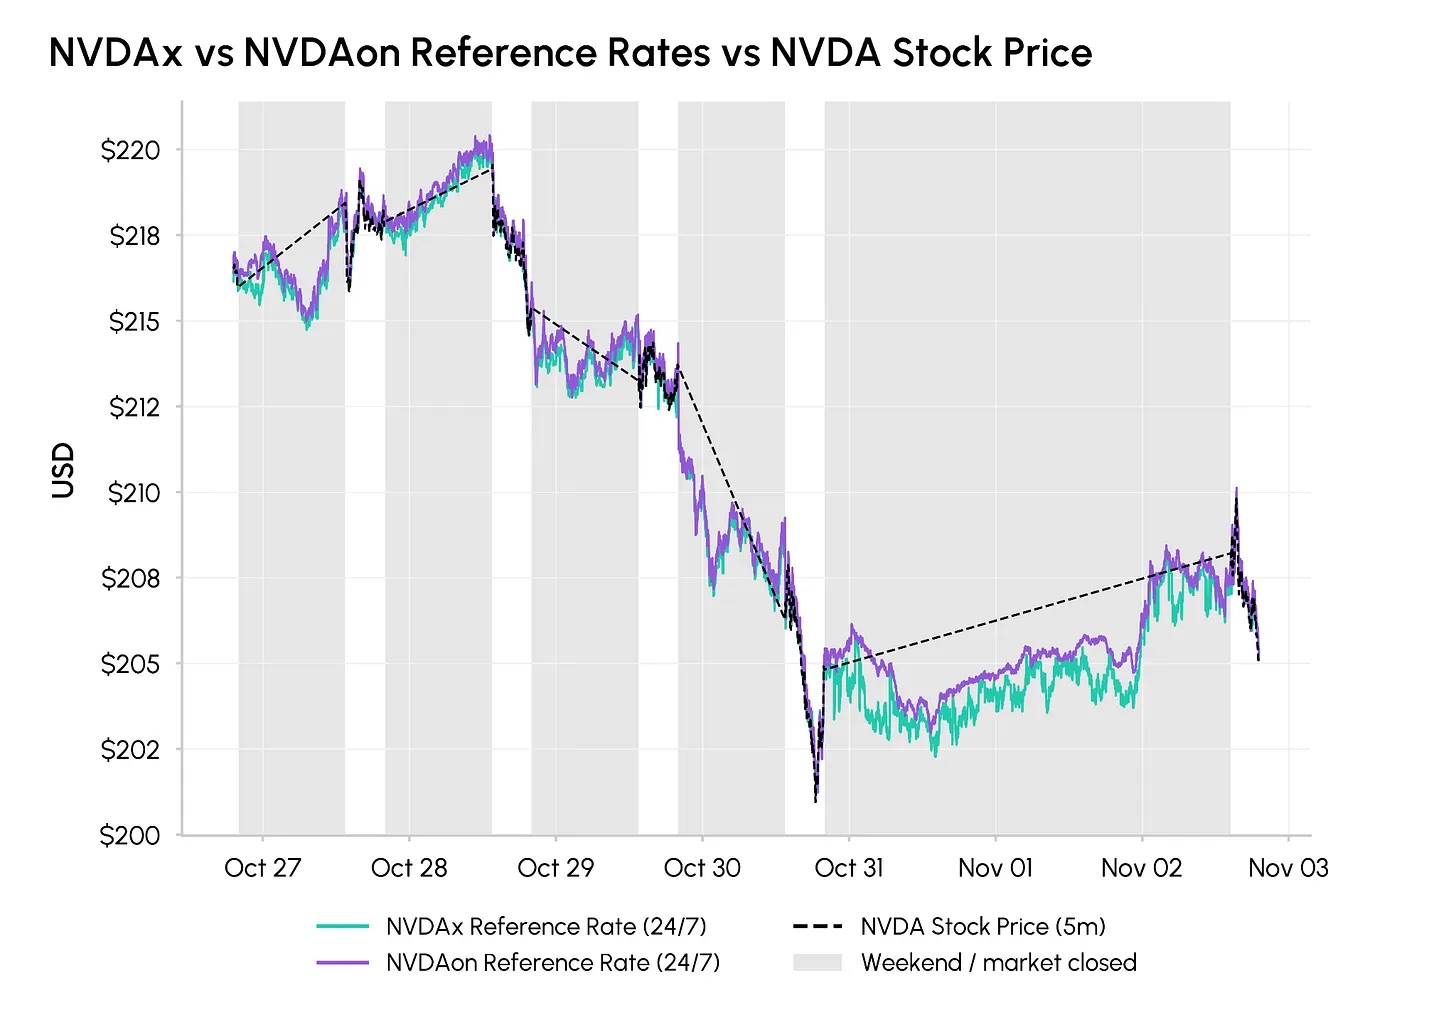
Two token offerings by Nvidia (NVDAx, NVDAon) reference prices in real-time against Nvidia's underlying stock price, with price discrepancies existing during the market closure period.
Only specific users on the whitelist have the authority to mint new tokens and redeem them for underlying stocks; regular holders cannot redeem, thus carrying redemption risks. During the statistical period (October 27—November 2), xStocks-issued NVDAx experienced premiums in 58.6% of the US stock trading periods, with an average premium of 3.1 basis points; Ondo-issued NVDAon generated premiums in 88.9% of trading intervals, with an average premium of 14.1 basis points. Amid a broad-based sell-off, Nvidia's token prices temporarily fell below last Friday's closing price of the underlying stock.
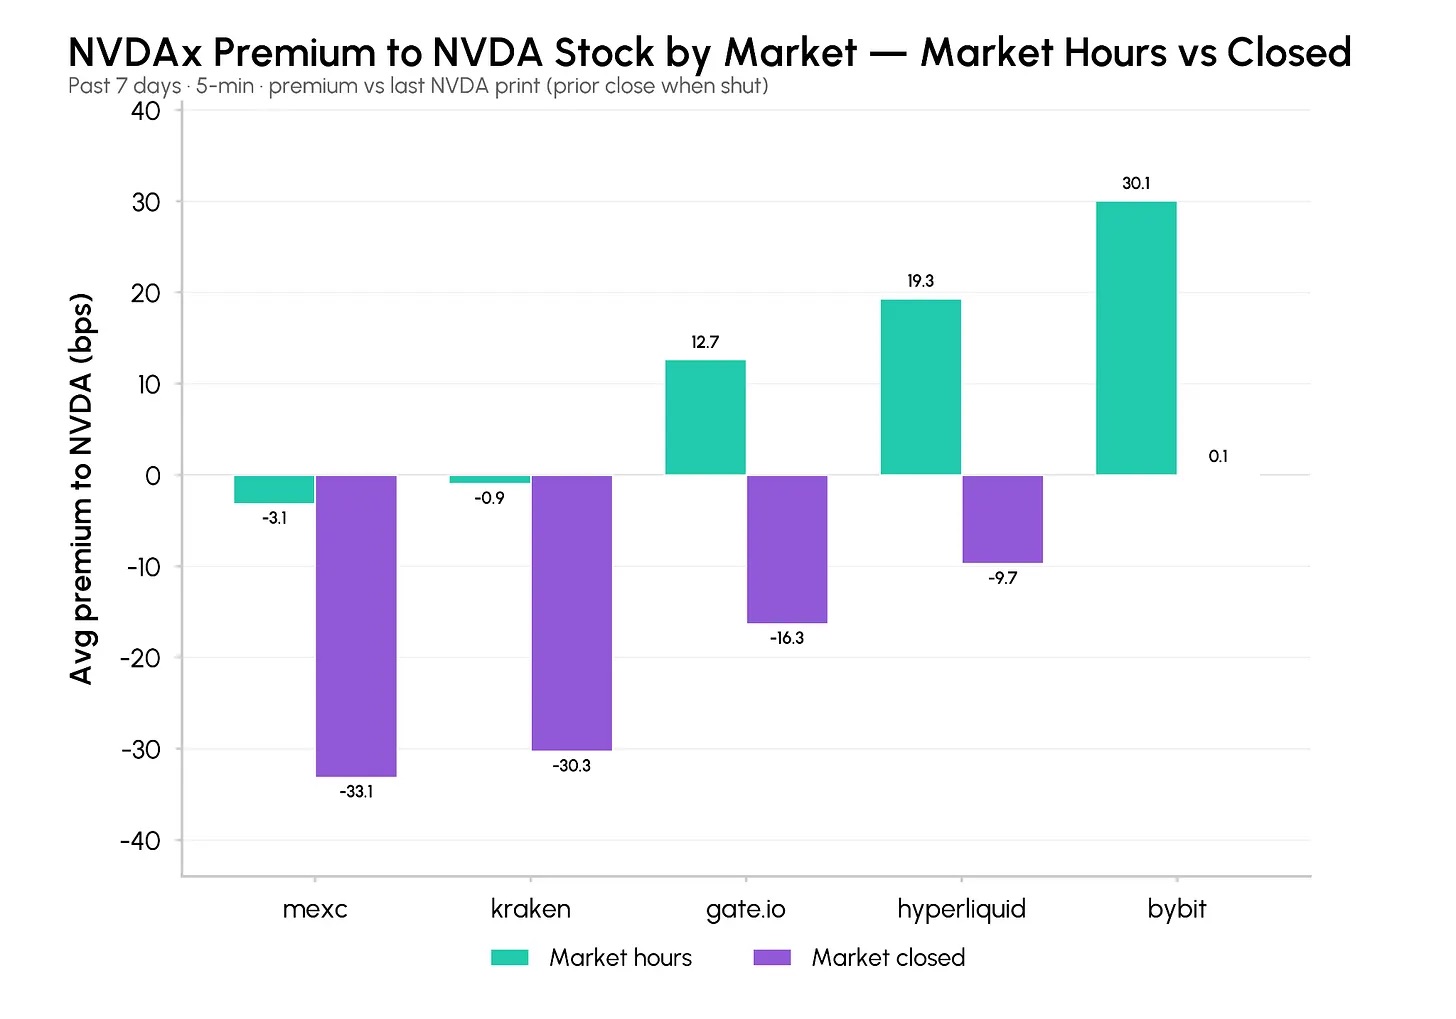
Average premiums of NVDAx across different platforms relative to Nvidia's underlying stock show that during US stock trading hours, they mostly hold positive premiums but shift to discounts during market closure, with significant differences across platforms.
The market fragmentation between exchanges results in discrepancies in quotes for the same tokenized stock, whether during trading hours or in closure periods. Taking Kraken’s NVDAx as an example, during the US stock opening trading hours, its average price difference relative to Nvidia's underlying stock is -0.9 basis points.
Using lead-lag correlation analysis over 210 trading days from January 2026 to the present, we compare the price fluctuations of NVDAx during US stock market closures and the actual market changes at Nvidia's underlying stock opening the following day, dividing into three time windows:
- After-hours period (Eastern Time 16:00–20:00): After-hours token prices show weak correlation with Nvidia's opening price the following day, with a correlation coefficient of only 0.24. The reference value of token prices for the next day's market direction during this time is very low.
- Overnight period (Eastern Time 20:00–next day 04:00): The overnight market exhibits weak correlation with the opening price the next day, with a correlation coefficient of 0.3, higher than the after-hours period, and progressively strengthens as it approaches the pre-market trading window for US stocks.
- Pre-market period (Eastern Time 04:00–09:29): Prices of NVDAx consistently converge towards Nvidia’s final opening price of the day, reaching a determination coefficient R² of 0.42.
- Complete overnight cycle (Eastern 16:00–next day 09:30): Throughout the entire market closure period, the token prices align closely with the underlying stock's trends, achieving an R² of 0.98; by the time US stocks officially open, the NVDAx price will revert to align with the underlying stocks, consistent with theoretical expectations.
The token price and the underlying stock are highly aligned at the opening moments, but this convergence occurs gradually during the pre-market period; relying solely on after-hours market data, it is difficult to predict the following day’s trends.
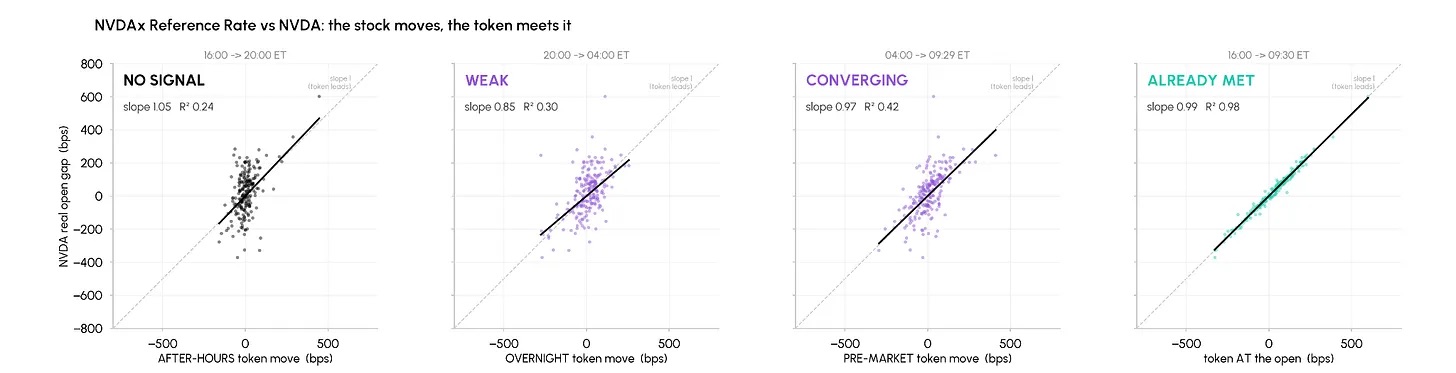
The predictive effectiveness of NVDAx for Nvidia’s opening price on the following day gradually increases across different time periods of US stock market closure, with almost no guidance after hours, and the price converges closely with the underlying stock as the market approaches opening.
Tokenized stocks are very sensitive to price fluctuations during market closure. After the closure of US stocks, the liquidity of NVDAx on Bybit and MEXC platforms within the midpoint ±1% range averaged a decline of 19%; the same range on Hyperliquid saw a liquidity shrinkage of about 33%. When liquidity rapidly contracts, buy and sell orders can easily cause price deviations, leading to price discrepancies for the same NVDAx token across different exchanges, which will only correct once US stocks reopen.
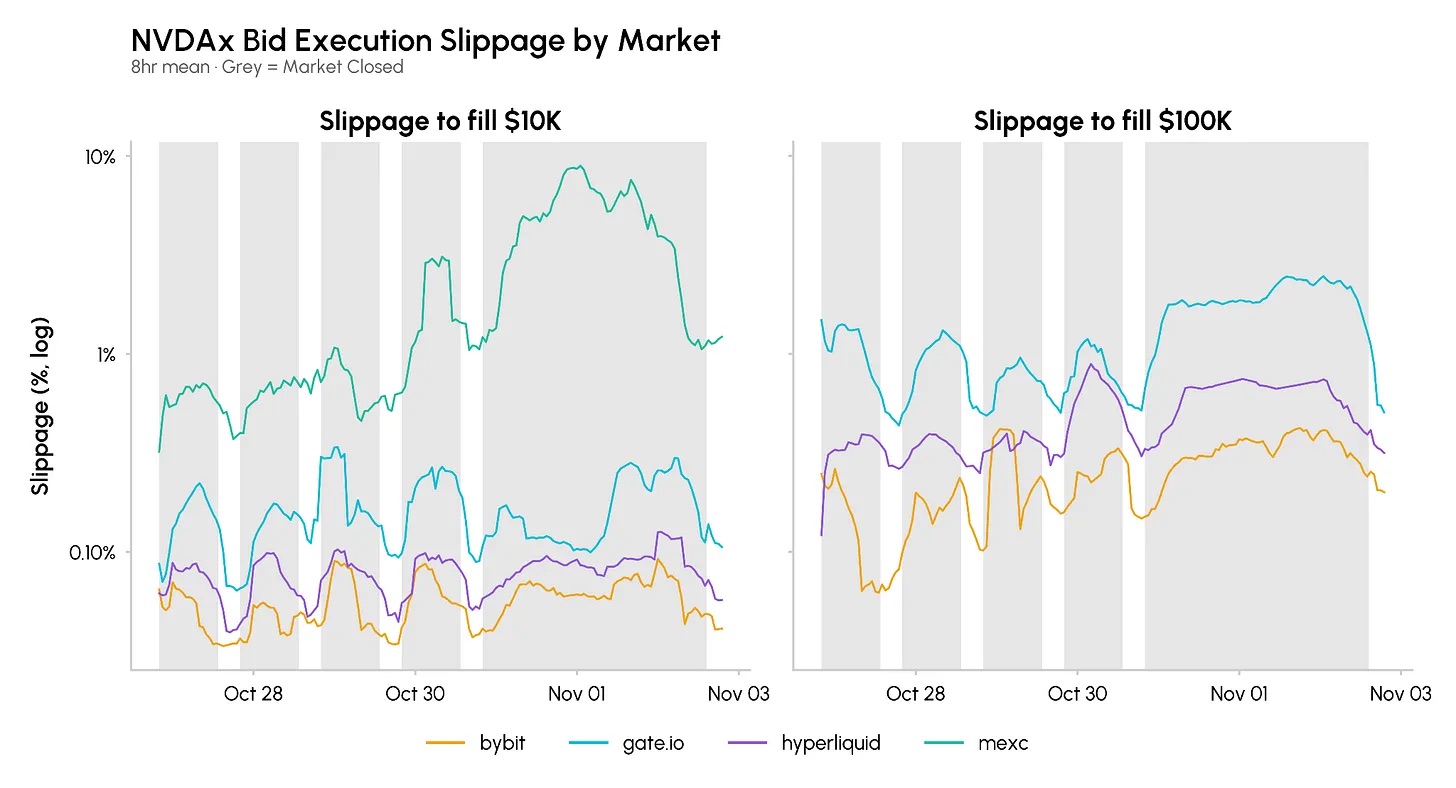
The buying slippage of NVDAx on different platforms increases as order sizes grow, with slippage generally rising during the US stock market closure, and MEXC having significantly higher slippage levels than other platforms.
Trading Period Characteristics of Tokenized Stocks
Tokenized stocks provide non-US investors with a channel to participate in US stock trends. Observing their trading periods reveals that even during illiquid closure windows, there are still investors actively trading.
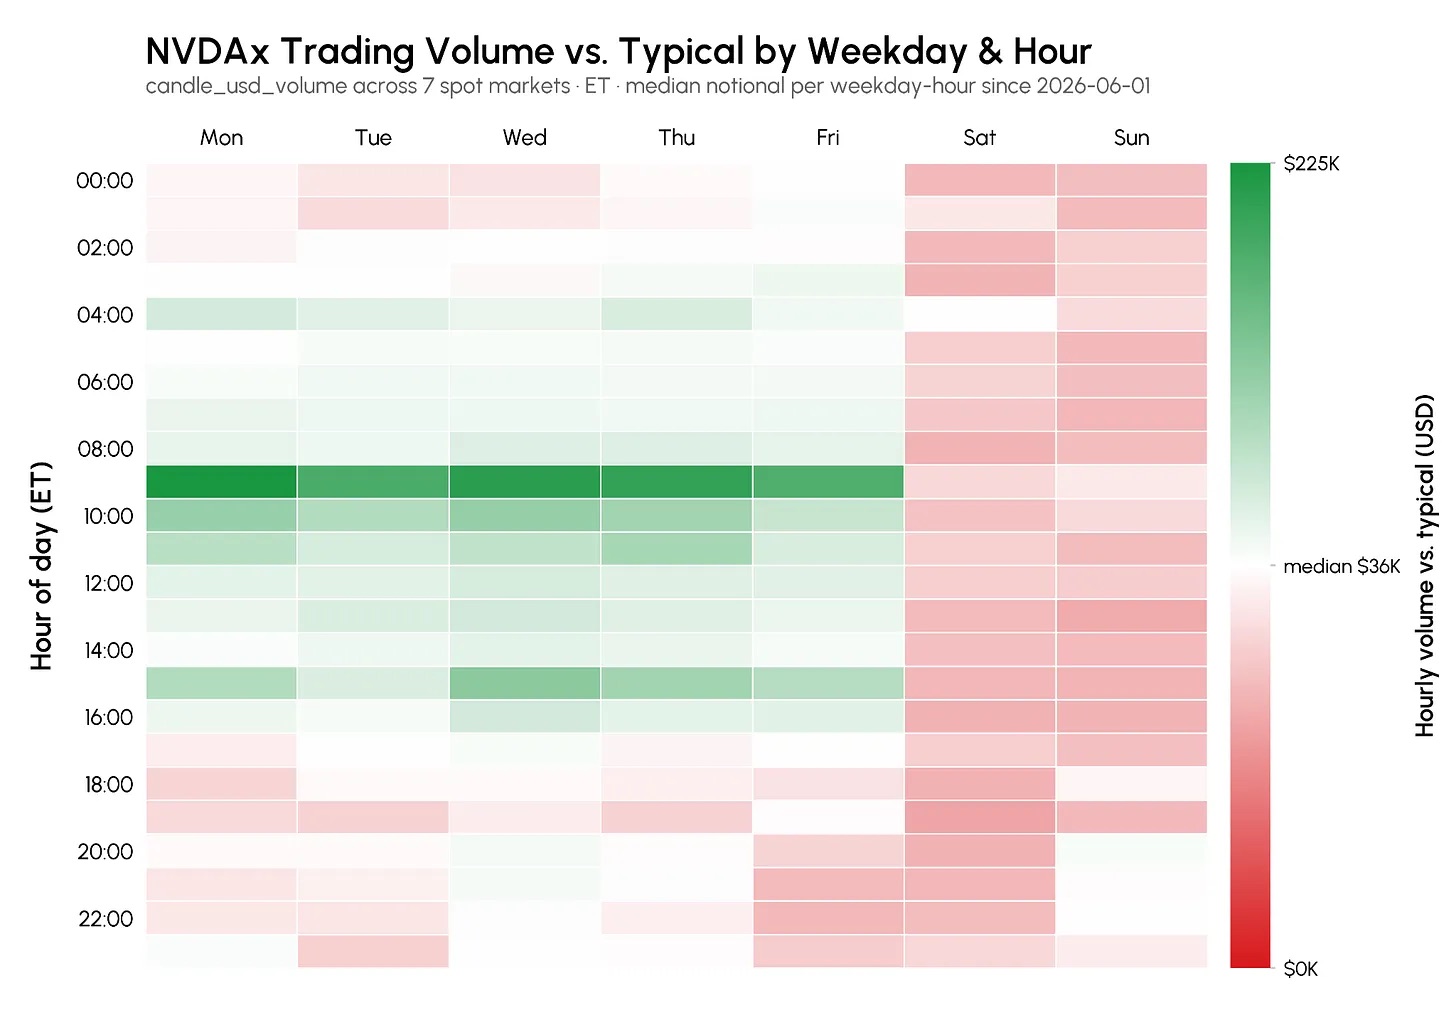
The spot trading volume of NVDAx is concentrated during US stock trading hours, with overall trading significantly sluggish over the weekend.
The trading volume of xStocks version NVDA is concentrated around the opening and closing of US stocks. On weekdays from 9 AM to 10 AM Eastern Time, the average trading volume of NVDAx reaches 225,000 USD. There is also trading activity in pre-market and after-hours, with some traders using it to predict opening trends and others to digest various news released after hours. Existing data cannot directly pinpoint the regions of the traders. Offshore exchanges support trading of such assets, indicating broad participation from international investors, but trading peaks remain concentrated during the regular trading hours of US stocks.
Cross-Platform Trading Effect Comparison
The same tokenized stock has different quotes across platforms, hence the actual cost of opening a position depends on which exchange the order is executed on.
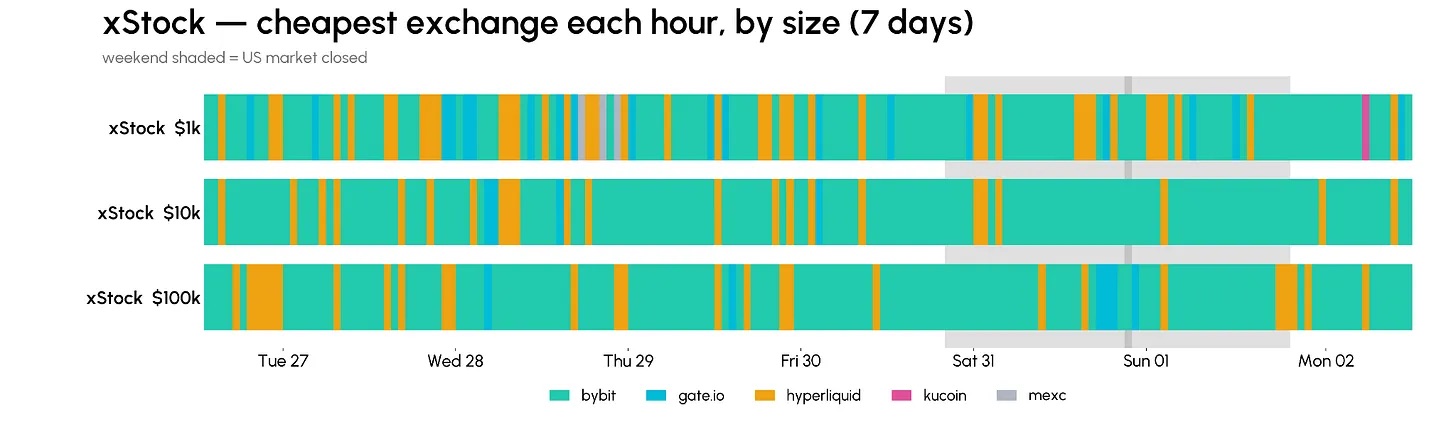
Under different order sizes and points in time, Bybit is mostly the most cost-efficient platform, while the optimal exchange will switch based on order size and timing.
There are more platform options for small orders. During the statistical period from October 27 to November 2, for 1,000 USD orders: Bybit and Hyperliquid have probabilities of 58% and 23%, respectively, for being the trading channels with the lowest slippage; if the order size changes to 100,000 USD, Bybit and Hyperliquid are the optimal trading platforms in 98.2% of scenarios.
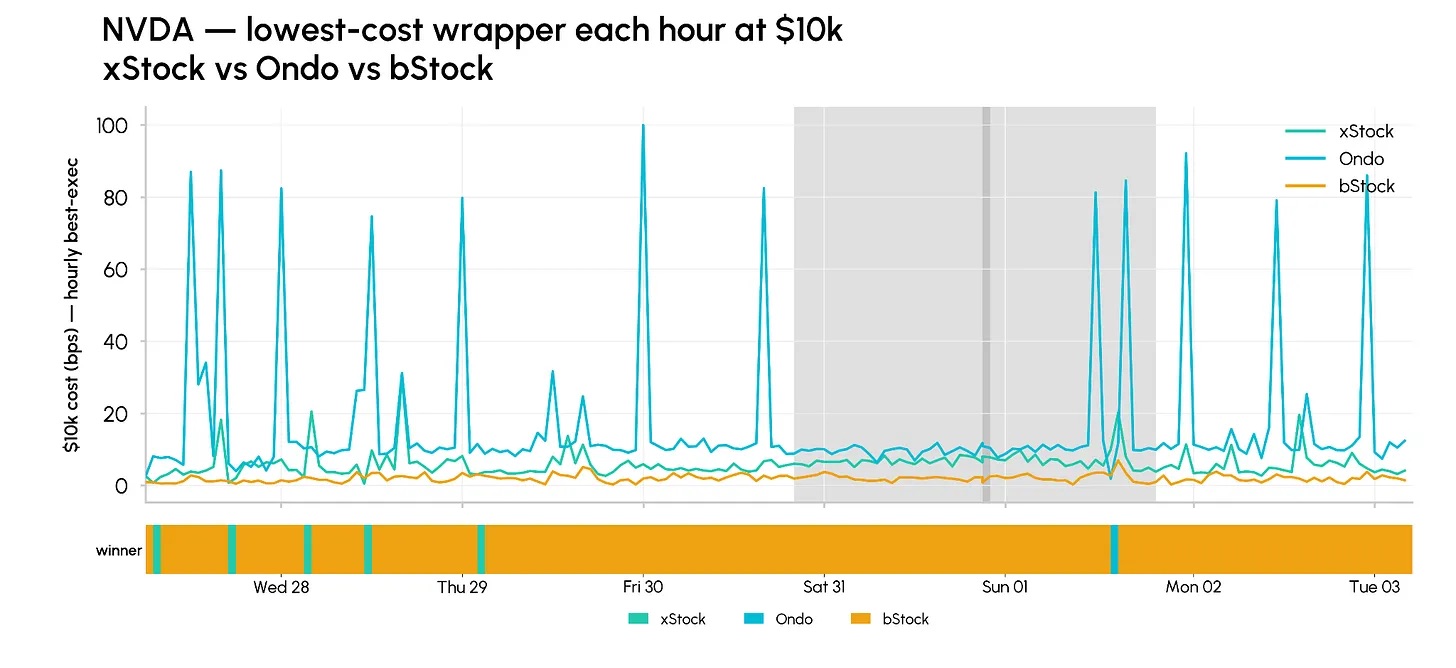
At a 10,000 USD order size, bStock often emerges as the product with the lowest cost, while Ondo's execution costs fluctuate significantly higher.
Different issuers of NVDA tokens also have noticeable differences in transaction costs. During the statistical period, for a 10,000 USD order size, Binance's NVDAb presents the lowest slippage in 96% of observed samples among all Nvidia token products.
After Deducting Transaction Costs, is there Still Room for Arbitrage?
Price discrepancies between different platforms and different issuance versions of tokens seem to provide arbitrage opportunities. However, liquidity constraints and transaction costs must be taken into account. Data from June to November 2, 2026, shows that even for small orders of 1,000 USD, the average buy-sell spread and slippage costs have already consumed the observed price discrepancies, without factoring in trading fees.
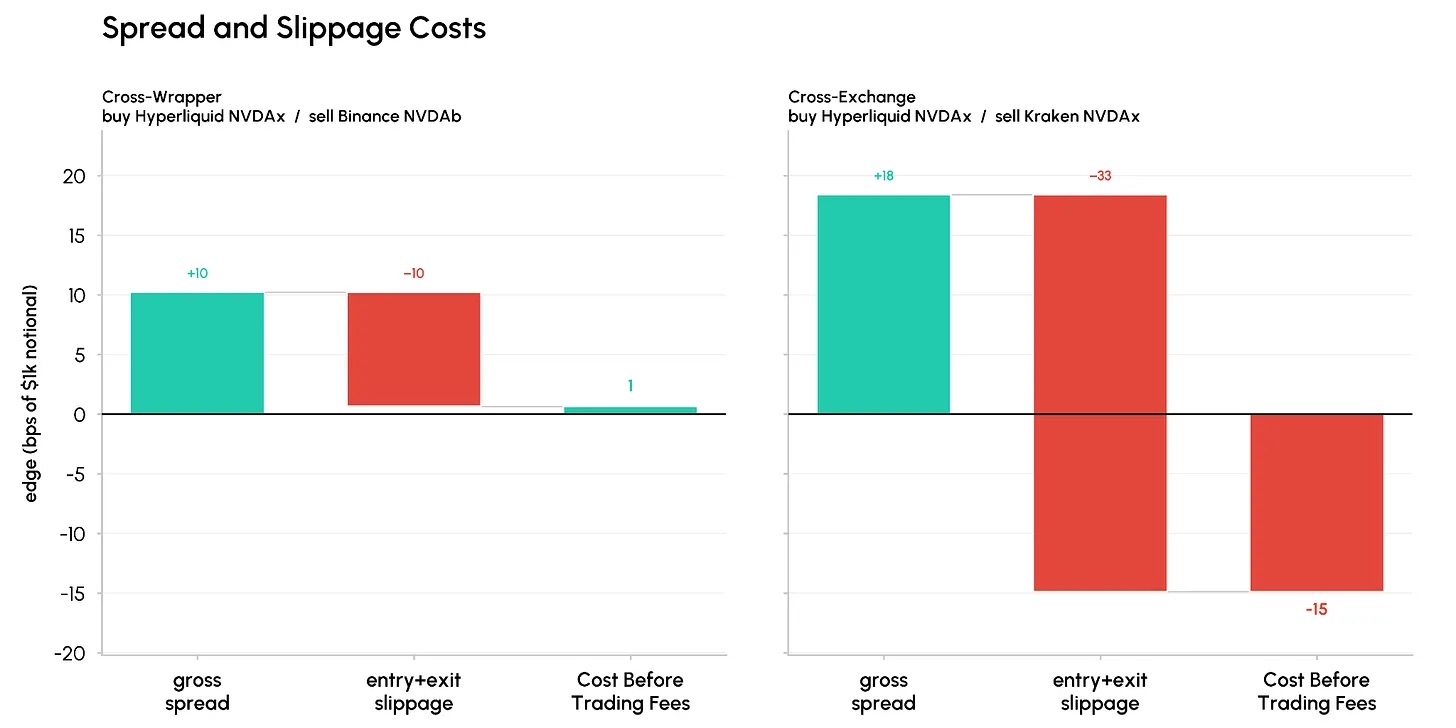
The arbitrage yield from cross-packaging and cross-exchange pairs of NVDA will be heavily eroded by bilateral slippage, significantly narrowing or even turning negative the net yield after accounting for slippage.
Conclusion
Tokenized stocks cater to non-US investors, providing continuous quoting 7×24 hours for US stocks that traditionally trade only during specific hours. However, the peaks of trading for such tokens are still concentrated during the opening hours of US stocks, with liquidity easily shrinking during closure periods. Continuous collection of market depth, slippage, and benchmark pricing data for tokenized assets is necessary to horizontally compare transaction cost differences among different tokenized stocks and exchanges.
免责声明:本文章仅代表作者个人观点,不代表本平台的立场和观点。本文章仅供信息分享,不构成对任何人的任何投资建议。用户与作者之间的任何争议,与本平台无关。如网页中刊载的文章或图片涉及侵权,请提供相关的权利证明和身份证明发送邮件到[email protected],本平台相关工作人员将会进行核查。


