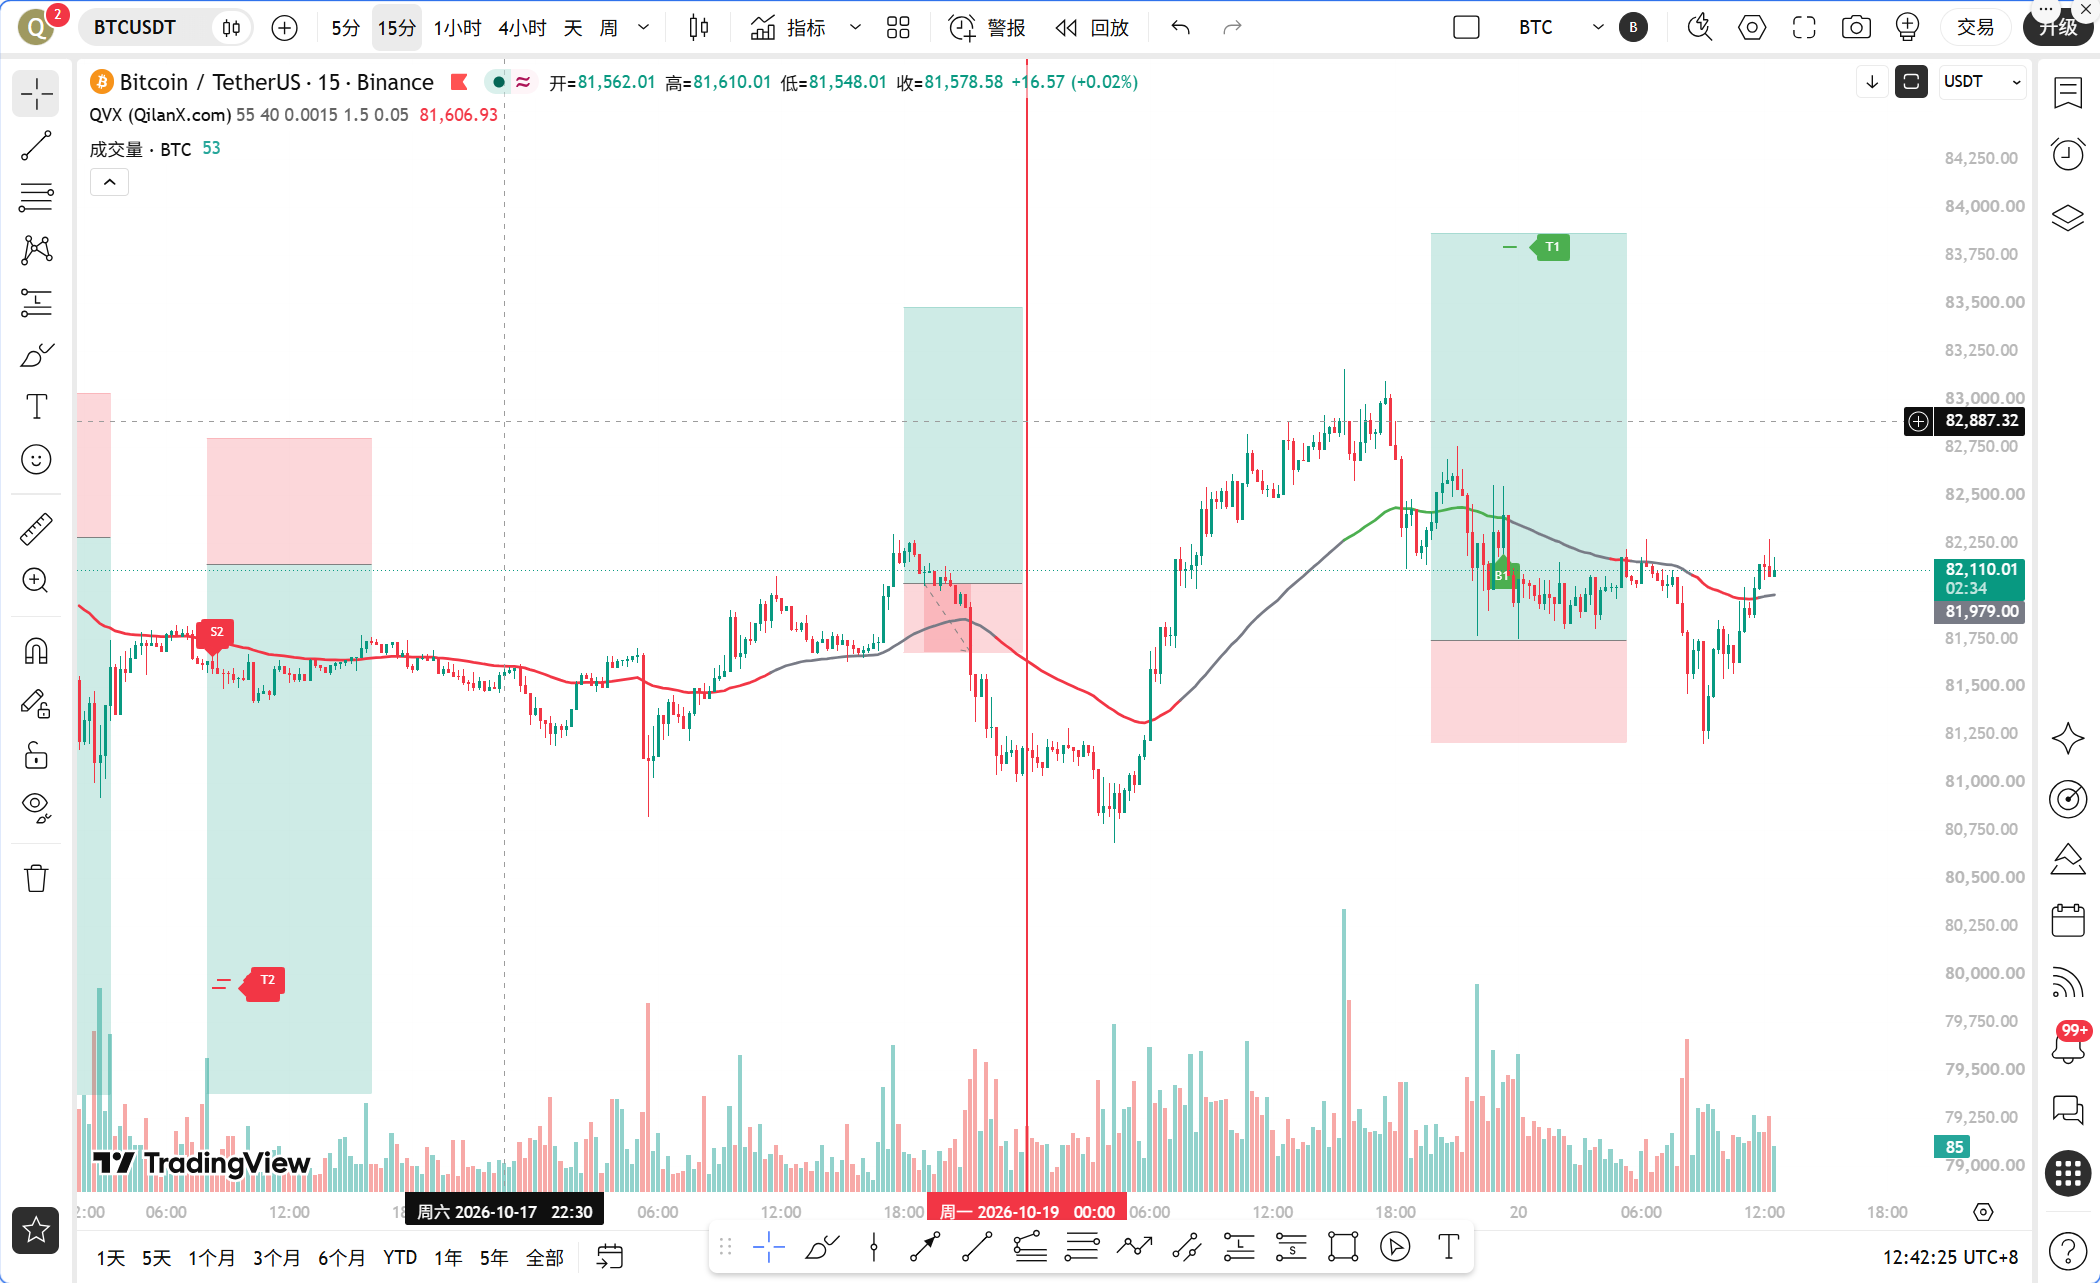
The news today is quite torn. On one side, Charles Schwab officially opens Bitcoin and Ethereum trading for retail investors across the U.S., and the German Savings Bank also launches crypto services with a ridiculously low fee of 0.99 euros, creating an increasingly larger increment of entry into traditional finance; on the other hand, there has been a net outflow of $320 million from Ethereum spot ETFs in a single week, with redemption intensity reaching nearly ten times that of Bitcoin. BlackRock's ETF associated address transferred $143 million of BTC and ETH into Coinbase. Long-term bullishness and short-term selling pressure are colliding head-on, with BTC stuck at this indecisive position of 82110 USDT, and neither the bulls nor bears are willing to make the first move.
Current Price and Time
It is now October 20th, 12:42 PM, with BTC priced at 82110 USDT, a 24-hour decline of 0.57%, and a market share of 59.59%. The fear and greed index is at 55, which is neutral. This position is interesting, as it is only 0.17% away from the 1-hour EMA55 at 81969.41 USDT, nearly moving along the line. What does hugging the line mean? It means that a directional choice could happen at any moment, but it also means that entering the market now is like betting on direction rather than waiting for confirmation.
Multi-Period Status Overview
First, let's look at the daily chart; this is the period that sets the tone. MA5 is at 81854.22, MA10 is at 82199.11, MA30 is at 83670.62, with moving averages in a bearish arrangement, and the price is pressed between MA10 and MA30. The MACD's DIF is -12.80, DEA is 328.14, with a bar value of -340.94; the death cross state hasn't changed, and the RSI is only at 36.60, which is weak but hasn't reached the oversold extreme. The daily chart tells us that the larger direction remains in an adjustment pattern, with any rebound serving as a repair, not a reversal.
The 4-hour level is slightly more favorable. MA5 is at 82002.02, MA10 is at 82061.05, and MA30 is at 81882.62; the three lines are closely knit between the narrow range of 81880 to 82060, with the price standing above MA30. The MACD's DIF is -2.24, DEA is -65.93, with a bar value of +63.70; after the golden cross, the red bars are continuing, and the RSI has rebounded to 55.86, leaning towards neutral and bullish. The 4-hour chart shows a typical oscillation and consolidation structure, with an unclear direction but support below.
The 1-hour level is the core reference period of the Qinglan TPV system. MA5 is at 81915.23, MA10 is at 81951.48, MA30 is at 82265.02, with the short moving averages supporting the price from below and MA30 pressing down from above. The MACD's DIF is -37.84, DEA is -20.17, with a bar value of -17.67; the green bars are shortening but haven't turned positive yet. The RSI is at 43.50, leaning towards neutral and weak. The key focus is EMA55, which is valued at 81969.41; the current price of 82110 USDT stands above it, by 0.17%.
The 15-minute level is the hottest. MA5 is at 82094.03, MA10 is at 81939.87, and MA30 is at 81891.43, showing a bullish arrangement. The MACD's DIF is 41.15, DEA is -18.58, with a bar value of +59.73; the red bars are expanding, and the RSI has surged to 78.94, entering the overbought zone. The overbought condition in the 15-minute period indicates that the cost-effectiveness of pursuing longs in the short term is low, and a pullback may happen at any time.
TPV Signal Validation
According to the three iron laws of the Qinglan TPV system, let's check step by step. In terms of trend positioning, the current price of 82110 USDT is above the 1-hour EMA55 of 81969.41 USDT, falling into the bullish trend area. This is the first level of filtering, with direction leaning bullish.
The first condition for going long is that the price needs to stabilize above the 1-hour EMA55, requiring two consecutive 1-hour candlesticks with closing prices above EMA55. From the oscillation auxiliary data, in the last 8 one-hour candlesticks, there have been 4 instances where the closing price was above EMA55, and it crossed twice, indicating that the price has indeed spent time above EMA55 but lacks stabilizing strength, falling into a state of repeated crossing. The second condition for support stabilization is that there hasn't been a clear long lower shadow or bottom formation at the 1-hour level; the strength observed in the 15-minute chart is more of a short-term pulse. The third condition is the exhaustion of downward momentum; the 1-hour MACD green bars are indeed shortening, which is the only decent signal, but the RSI at 43.50 has neither rebounded from below 30 nor confirmed a bullish engulfing.
More critically is the oscillation judgment. In the past 8 one-hour candlesticks, the closing prices above EMA55 were 4 times, falling within the range of 3 to 5 times, with 2 crossings reaching the threshold, and presently the distance from the current price to EMA55 is only 0.17%, less than the 0.3% hugging the line standard. When all three conditions are triggered simultaneously, the TPV system clearly determines that the current market is in an oscillation state. In an oscillation market, one should neither actively go long nor short, only providing intervals; this is discipline, not hesitation.
On-chain/Funding Situation
The funding situation is the part that needs to be most vigilant about today. The net outflow from the ETH spot ETF in one week is $320 million, with a redemption intensity nearly ten times that of BTC, which is no small amount, indicating a loosening of short-term confidence in ETH at the institutional level. The BlackRock ETF associated address transferred $143 million of BTC and ETH to Coinbase; transferring large assets into exchanges is typically interpreted as a prelude to potential sell-offs. A whale bought ETH at $1647, making a profit of $8.99 million before turning to go long on crude oil; the path for realizing profits is very clear.
Of course, there are hedging aspects as well. A whale withdrew 774.77 BTC, worth $63.36 million, from Robinhood to a cold wallet, signaling asset accumulation; listed companies made a net purchase of $360 million in Bitcoin over the week, with Strive contributing over 90%, providing solid downside support from enterprise treasury buying. On a macro level, Citigroup says oil prices not dropping means U.S. bond yields are unlikely to peak, and the high-interest-rate environment continues to tighten liquidity. Hassett also pointed out that CPI rebounds mean inflation isn’t retreating, both of which are suppressive to risk assets. The South Korean KOSPI plunged 4.52%, while SK Hynix tanked 7%, and weakness in Asian risk assets could drag down crypto sentiment. The White House crypto committee has completely lost its members, and the future of the CLARITY bill is uncertain, raising regulatory uncertainty.
Overall, the pattern of short-term weakness and long-term strength in funding hasn't changed, but the speed of short-term bloodletting deserves respect.
Key Attack and Defense Levels
The first resistance above is the 1-hour MA30 at 82265.02 USDT, which is the position the short-term bulls must conquer in order to test the space above the daily MA10 at 82199.11 USDT; further up is the daily MA30 at 83670.62 USDT, which serves as a medium-term dividing line of strength. The first support below is the 1-hour EMA55 at 81969.41 USDT, which is the bullish and bearish line of the TPV system; if it breaks and two consecutive 1-hour candlesticks close below it, the oscillation pattern will tilt towards bearish. Further down are the 4-hour MA30 at 81882.62 USDT and the daily MA5 at 81854.22 USDT; these two lines nearly overlap within the range of 81850 to 81880, representing an important defense line for short-term trading. Below that is the 79775 USDT frequently mentioned in news, which is a key low on a weekly level.
Trading Strategy
Direction: Treat it as oscillation, do not chase positions, wait for the edges of the interval.
Entry Conditions: For a long, the price needs to pull back to the range of 81880 to 81970 USDT, with a 1-hour long lower shadow or bottom formation appearing, while the 1-hour MACD green bars continue to shorten; only if these three resonate might one consider a light position entry. For a short, the price needs to rebound to the range of 82260 to 82300 USDT, with a 1-hour long upper shadow or top formation appearing, and the RSI falling from a high point; only then should one consider a short. Avoid trading around 82100 USDT, as chasing positions in a hugging line zone is the least profitable approach in an oscillation market.
Stop Loss: Set a long position stop loss below 81750 USDT; if it breaks below the daily MA5 and the 4-hour MA30 resonance area, it indicates that support has failed. For a short position, set the stop loss above 82450 USDT; if it stands above the 1-hour MA30 and stabilizes, it indicates that pressure has been broken.
Target Levels: For long positions, the first target is 82260 USDT, the second target is 82400 USDT; for short positions, the first target is 81970 USDT, the second target is 81880 USDT. Upon reaching the first target, reduce the position and see if the remaining can trend towards continuation.
Risk Warning
If the blood loss from the ETH ETF and the BlackRock-associated address transfer continues to ferment, if the 81880 USDT defense line is lost, the oscillation could quickly turn into a downward trend towards 79775 USDT; managing positions is always more important than directional judgment.
Follow the Qinglan Crypto Classroom for more trading opportunities! Welcome to visit the official website www.qinglan.org
📊 Qinglan TPV Trading Strategy Backtesting Reference
🕒 Last backtest time 10-20 07:00:02
Total analysis: 4527 Backtests: 4519 Accuracy rate: 77.5% (3500/4519)
免责声明:本文章仅代表作者个人观点,不代表本平台的立场和观点。本文章仅供信息分享,不构成对任何人的任何投资建议。用户与作者之间的任何争议,与本平台无关。如网页中刊载的文章或图片涉及侵权,请提供相关的权利证明和身份证明发送邮件到[email protected],本平台相关工作人员将会进行核查。