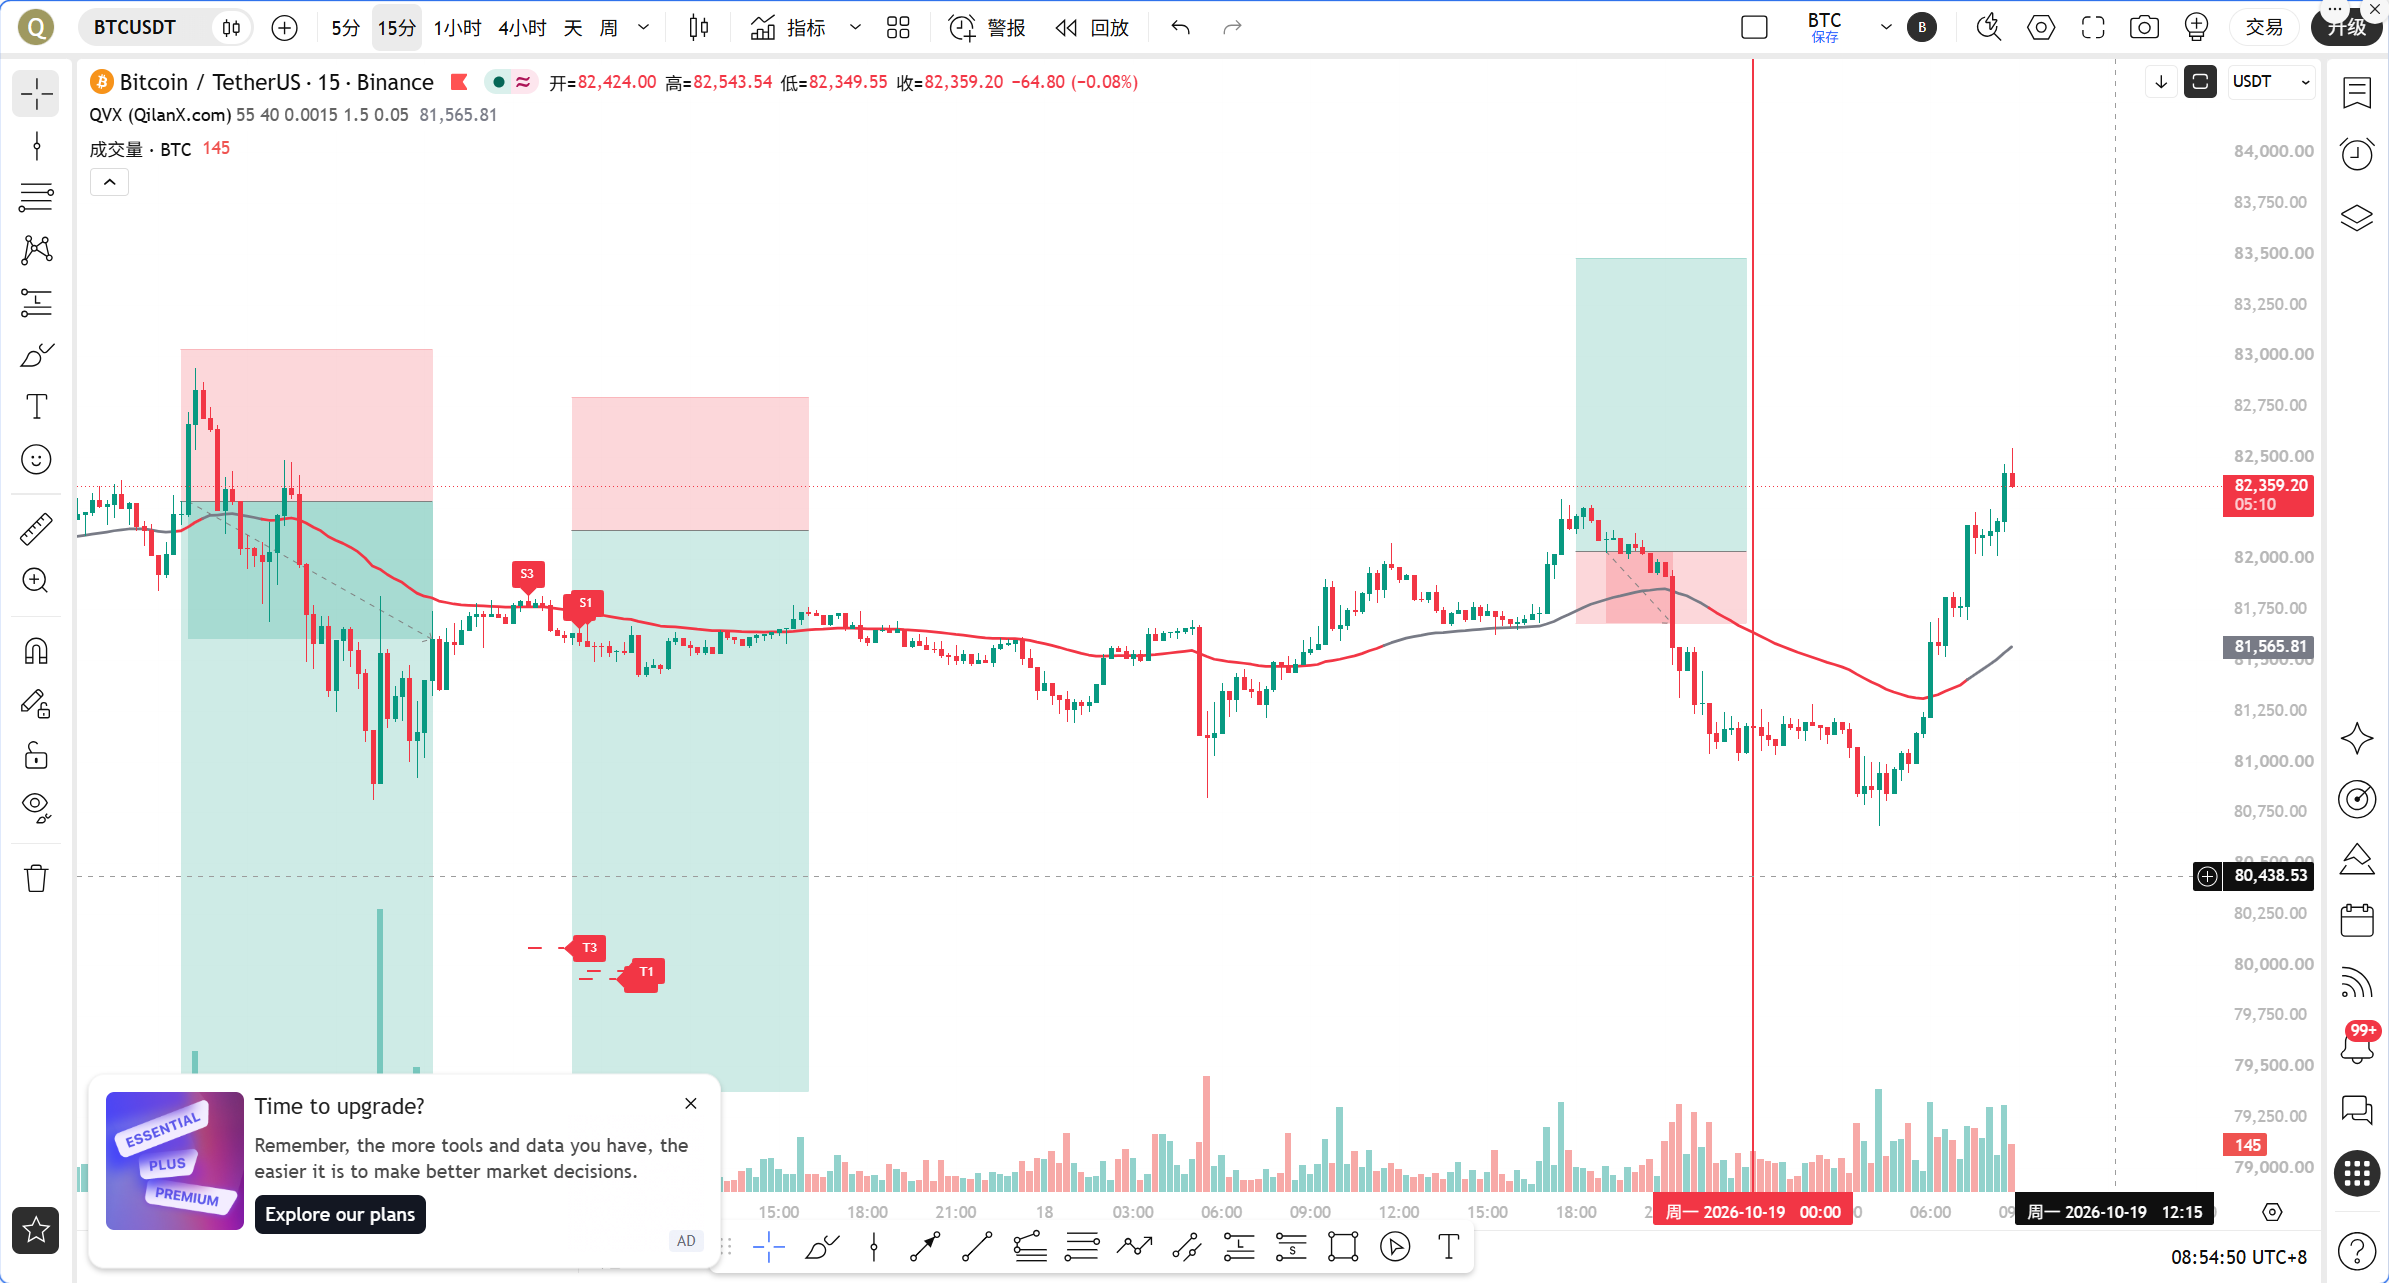
Today, there are two things worth watching for all BTC traders. The first is that Charles Schwab is gradually opening external wallet transfers for Bitcoin and Ethereum, which is a substantial step for mainstream brokers to expand crypto access, indicating that the channels for traditional funds to enter the crypto market have widened, representing a medium-term bullish factor. The second is that a $97.87 million Bitcoin long position with 40x leverage is approaching its liquidation price, which poses a short-term bearish risk. Once liquidation is triggered, BTC may experience a sharp, brief plunge. On one side, there is new capital entering the market, while on the other, the high-leverage long positions are hanging by a thread. Bulls and bears are battling near 82000; in such times, relying on intuition is the worst approach; data must take precedence.
Current Price and Time
The current time is October 19 at 09:00, with BTC's latest price at 82305 USDT, a 24-hour change of 1.08%, and a market share of 60.16%. The fear and greed index stands at 59, in the greed range. The price has just crossed the 82000 integer mark, indicating that market sentiment is warm but not overheated, making the divergence between bulls and bears at this position particularly significant.
Multi-Period Status Overview
First, let's look at the daily chart. Daily MA5=81954.80, MA10=82323.65, MA30=83651.78; the price of 82305 is trapped between MA5 and MA10, with more than 1300 points of space to MA30. The daily MACD shows DIF=43.28, DEA=421.73, and the histogram is at -378.45, still indicating a negative value, which means that the adjustment momentum at the daily level has not yet been fully digested. The daily RSI=36.58 is in a weak area but has exited the oversold territory. Overall, the daily trend is considered weak recovery, with price repeatedly competing in the dense area of moving averages, still without a clear direction.
Now looking at the 4-hour chart. The 4-hour MA5=81709.86, MA10=81663.67, MA30=81861.70; the three moving averages are tightly clustered in the narrow range of 81660 to 81860, while the price at 82305 is running above the averages. The 4-hour MACD has DIF=-164.80, DEA=-255.81, and histogram=91.01, with a positive histogram indicating a signal for a momentum shift towards bullish at the 4-hour level. The 4-hour RSI=57.58 is neutral to strong. The 4-hour trend is described as bullish with fluctuations; the convergence of moving averages indicates an upcoming direction decision.
The 1-hour chart is the core for today. The 1-hour MA5=81941.98, MA10=81502.12, MA30=81614.96; it shows an embryonic bullish arrangement of moving averages. The 1-hour MACD has DIF=80.47, DEA=-34.80, and histogram=115.27, with DIF crossing above the zero line, and the histogram continuously expanding, indicating strong momentum; the 1-hour RSI=53.94 is at a neutral position with no overbought pressure. The 1-hour EMA55=81679.68, with the current price at 82305 being about 0.77% above EMA55, firmly standing above the bull-bear dividing line.
The 15-minute level is the hottest. The 15-minute MA5=82270.45, MA10=82127.24, MA30=81470.04, showing a bullish divergence in moving averages. The 15-minute MACD has DIF=295.74, DEA=219.78, and histogram=75.96, with momentum still expanding; however, the 15-minute RSI=85.17 has entered severe overbought territory. The 15-minute trend is characterized as overly hot in the short term, increasing the risk of chasing higher prices.
TPV Signal Verification
Checking against the Qinglan TPV system rules one by one. For trend positioning, the current price of 82305 is greater than the 1-hour EMA55 of 81679.68, indicating a bullish trend area, which is a prerequisite for going long.
The first condition for going long is that the price must hold above the 1-hour EMA55 with two consecutive 1-hour candlesticks closing over EMA55. Looking at the current 1-hour moving average structure and price position, the price is running above EMA55, with the 1-hour MA5, MA10, and MA30 all near or above EMA55, essentially satisfying the condition for consecutive closing stability.
The second condition is that support must stabilize. After the price has been pulled up from a low, it must not break during the retest; the 4-hour moving average convergence zone from 81660 to 81860 constitutes an effective support band, with the price rebounding after touching it, thereby fulfilling the support stabilization signal.
The third condition is that the downward momentum must weaken. The 1-hour MACD histogram has continuously expanded positively, with DIF crossing above the zero line; the 4-hour MACD histogram has turned from negative to positive, indicating a transition from momentum exhaustion to momentum expansion, satisfying the condition.
When all three conditions are met, the TPV system gives a 1-hour buy signal. However, it is crucial to note the oscillation auxiliary data: of the past 8 1-hour candlesticks, the closing price has been above EMA55 4 times out of 8, and it has crossed only once; the current price is 0.77% away from EMA55, which does not meet the oscillation threshold, leading the system to determine that it may be in a one-sided trend. This indicates a higher probability of trend continuation, but it also means that once the direction reverses, adequate stop-loss space must be reserved.
On-chain/Fundamentals
The funding aspect shows a clear bull-bear fracture. On the bullish side, Charles Schwab’s opening of BTC and ETH external wallet transfers has opened channels for mainstream brokerage firms, raising expectations for incremental capital; Bitcoin ETFs have seen a net inflow of $355 million since the beginning of the year, turning positive in September, indicating that institutional demand for allocation has not disappeared; analysts have pointed out that a breakthrough above 82000 may accelerate upward toward 90000, and the logic of short covering is brewing.
The bearish side cannot be ignored either. This week, U.S. Bitcoin ETFs experienced a net outflow of $228.4 million, with IBIT leading, putting short-term buying pressure; Galaxy Research noted a weakening of institutional buying combined with ETF outflows, insufficient support from institutions, and long-term holders distributing more than what is being bought; BTC and ETH funding rates are low, indicating insufficient confidence in bulls and a neutral to bearish market sentiment; a whale with 13x leverage in a long position on ETH has an unrealized loss of $9.49 million while still holding a $97 million long position, posing liquidation risks on the ETH side that could transmit through to the entire market. The greed reading of 59 on the fear and greed index, coupled with low funding rates, indicates that the emotional aspect is just a flicker, requiring extra caution in chasing higher prices.
Key Attack and Defense Levels
The first resistance level above is the daily MA10 at 82323.65, and the current price of 82305 is just below this position, making this the most direct line of defense today. Getting above it would open the way to the space between 83000 and 83651 (the daily MA30), and further up is the target area of 90000 mentioned by analysts. The first support level below is at the 1-hour EMA55 of 81679.68, which is the dividing line of the TPV system between bulls and bears, and the upper edge of the 4-hour moving average convergence zone; the second support is at the range between 81500 and 81660, formed by the 4-hour MA10 at 81663.67 and the 1-hour MA10 at 81502.12; then below is the 15-minute MA30 at 81470.04, breaking below which would indicate a short-term weakness.
Trading Thoughts
Direction: Slightly bullish, but only entering on retracements, not chasing highs. With the 15-minute RSI reaching 85.17, the risk-reward ratio for directly chasing long positions is very poor; waiting for a confirmed retracement is the consistent strategy of the Qinglan TPV system.
Entry Conditions: Wait for the price to retrace to the 1-hour EMA55 near 81679.68, and look for setups such as long lower shadows, bottom formations, or bullish engulfing patterns that indicate stability, at the same time ensuring that the 1-hour MACD histogram does not show continuous shortening; enter long when all three conditions resonate. If the price does not retrace and directly stabilizes above 82323.65, one can follow in lightly after confirming that it doesn't break below 82300.
Stop Loss: After entering, set the stop loss below 81470, i.e., below the 15-minute MA30, corresponding to about 0.25% to 0.3% of stop-loss space; if it falls below, it signifies structural damage in the short term, warranting immediate exit.
Target Levels: The first target is at the round number of 83000, the second target is at 83651, which corresponds to the daily MA30; if a breakout occurs above 83651 with volume, hold on toward the 84500 to 85000 area. The risk-reward ratio based on the first target calculates to about 2.5 to 1, meeting the system's requirements.
Risk Warning: The $97.87 million liquidation price for the 40x long position is a bomb that could go off at any moment; if the price sharply declines below 81500, strictly stop-loss and do not hold the position.
Follow Qinglan's Crypto Classroom to seize more trading opportunities! Welcome to visit the official website www.qinglan.org
📊 Qinglan TPV Trading Strategy Backtest Reference
🕒 Last Backtest Time 10-19 07:00:02
Total Analysis: 4504 Backtests: 4498 Accuracy Rate: 77.5% (3486/4498)
免责声明:本文章仅代表作者个人观点,不代表本平台的立场和观点。本文章仅供信息分享,不构成对任何人的任何投资建议。用户与作者之间的任何争议,与本平台无关。如网页中刊载的文章或图片涉及侵权,请提供相关的权利证明和身份证明发送邮件到[email protected],本平台相关工作人员将会进行核查。