Author: Flow Brief by Alea Research
Translation: Shen Chao TechFlow
Shen Chao's Guide: Kalshi is applying to the CFTC to launch perpetual contracts for 58 stocks, including Apple and SpaceX, while raising the probability of an interest rate hike in October from 31% to 55%. The prediction market is transforming from “event betting” into a “macroeconomic pricing tool,” which brings new opportunities for traders and practitioners.
On September 18, Kalshi submitted an approval application to the CFTC for 58 types of U.S. stock perpetual futures, covering Apple, SpaceX, and the SPY fund, and has self-certified relevant sections of the rules. Within the same nine days, the exchange bet on the Federal Reserve, pushing the probability of an interest rate hike in October to 55%, with open contracts increasing by 16.0%, half of which are weekly football parlay bets that reset every Sunday.
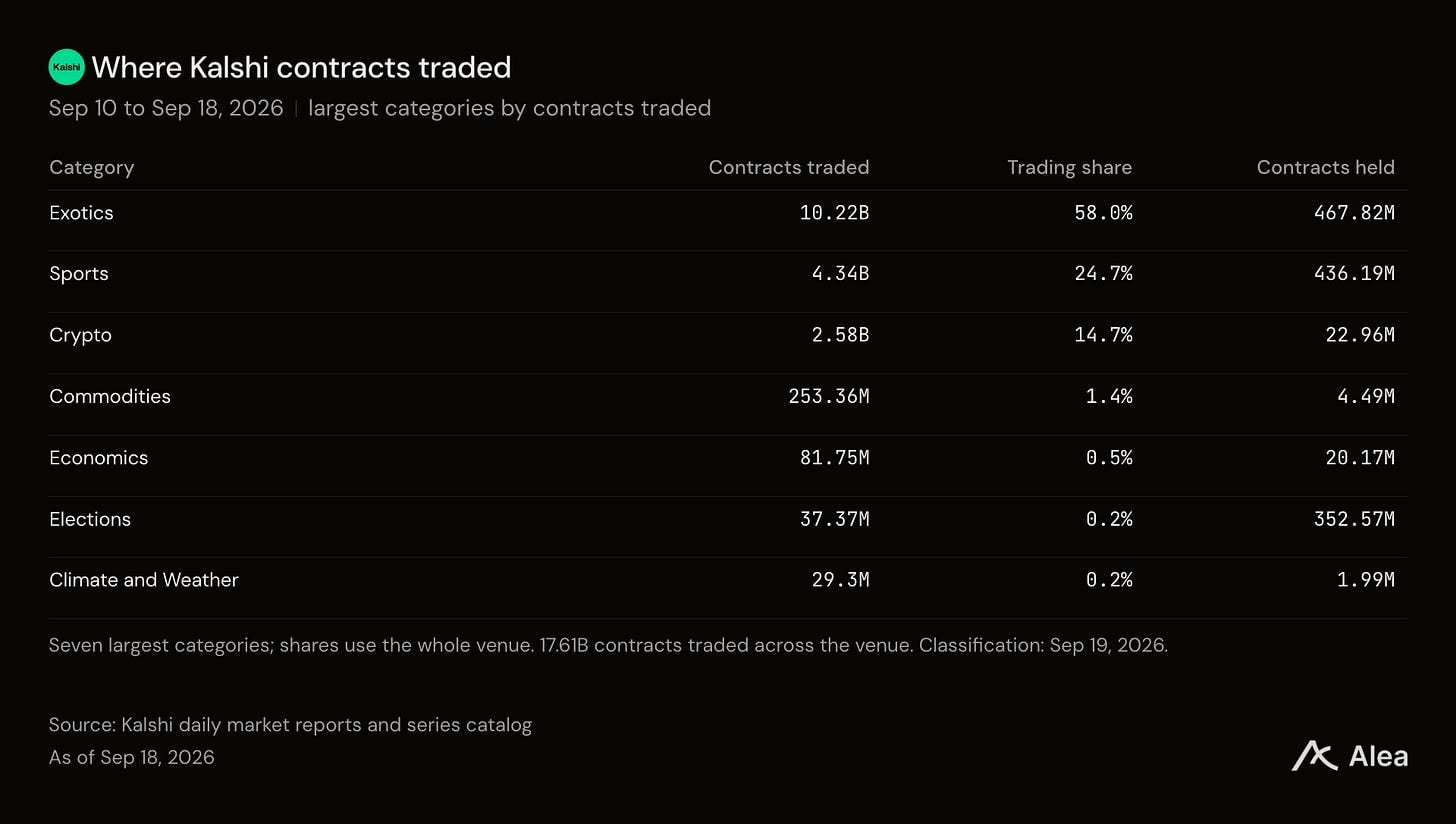
Figure: Trading volume of various categories of contracts in nine days (including changes from the beginning to the end of various categories).
Kalshi is applying to become a stock trading venue. On September 18, 58 types of U.S. stock perpetual futures were submitted to the CFTC, including Apple, SpaceX, SPY, and QQQ, without any announcement at the time and no trading yet.
The exchange understood the Federal Reserve and then bet that it has not finished. The interest rate hike contract for September closed at 88% the day before the unanimous approval of a 25 basis point hike, raising the probability of an October hike from 31% to 55%.
The market pricing is tighter than the committee's own expectations. Adding 55% for October and 67% for December results in 1.22 rate hikes of 25 basis points across the two meetings, while the committee's median expectation is only one.
Half of the record is from parlay cycles. Open contracts closed at 1.417 billion, an increase of 16.0%. Excluding the football parlay bets, the rest of the exchange grew by 8.0%, with no weekend retreat.
The deepest order book belongs to the market with no transactions. Electoral contracts account for 24.9% of open contracts but only 0.2% of trading volume. Of the ten markets that can absorb $5,000 with a price impact within 2%, six are nomination contracts.
What’s launched, and what the court said
Three days changed the positioning of this exchange and what it might sell.
On September 18, Kalshi submitted an application to the CFTC for approval of 58 types of U.S. stock perpetual futures: 55 common stocks, Alibaba ADR, plus SPY and QQQ funds, with the list ranging from Apple to ExxonMobil, and including SpaceX. Each contract covers 100 shares, with the minimum customer margin set at 15.50% of the current market value, determined by the exchange rather than chosen by the traders. These are categorized as securities futures products and are regulated under both SEC and CFTC; Kalshi has registered as a national securities exchange to trade these products. Currently, there is no trading, no set date, and no announcements have been made.
Two days ago, the Ninth Circuit Court stated in the case of Blue Lake Rancheria v. Kalshi that "the sports event contracts offered on the Kalshi contract market are essentially sports gambling, regardless of whether Kalshi calls them swaps," overturning the decision to deny the preliminary injunction and remanding the case. Nothing was ordered by the court to be halted, and no products were taken down. Sports and football parlays account for 63.8% of open contracts.
Funding and what it has purchased
During the eight days covered by both cash and contract records, traders paid $3.5 billion, compared to $3.34 billion in the previous eight days, an increase of 4.6%, while the exchange reported a 12.3% increase in contract trading volume.
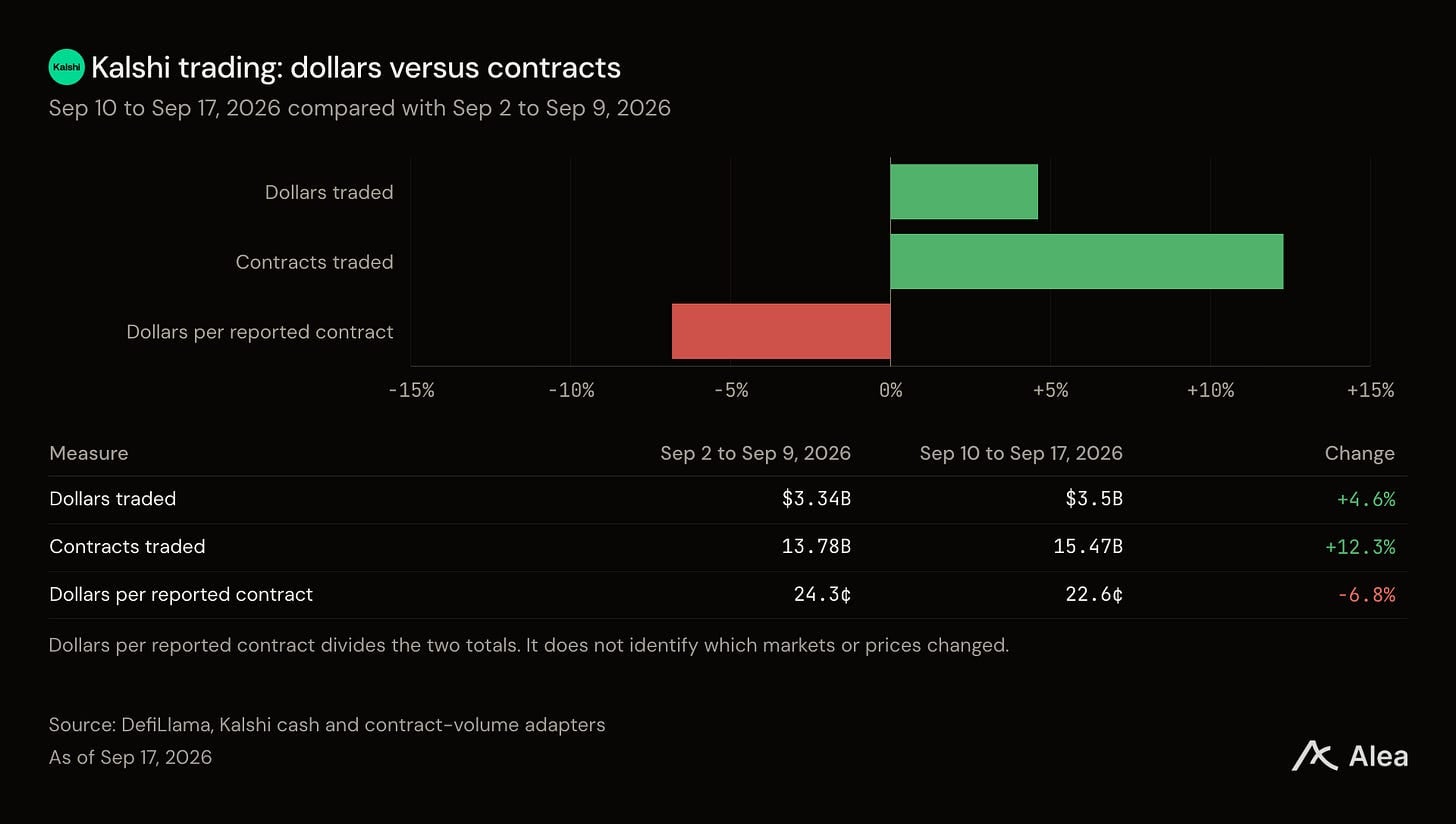
Figure: The relationship between funds, contracts, and their price differences over eight days.
The most active day for funds was Sunday, September 13, reaching $547.3 million, accounting for 15.6% of the total over eight days, coinciding with a full weekend of football.
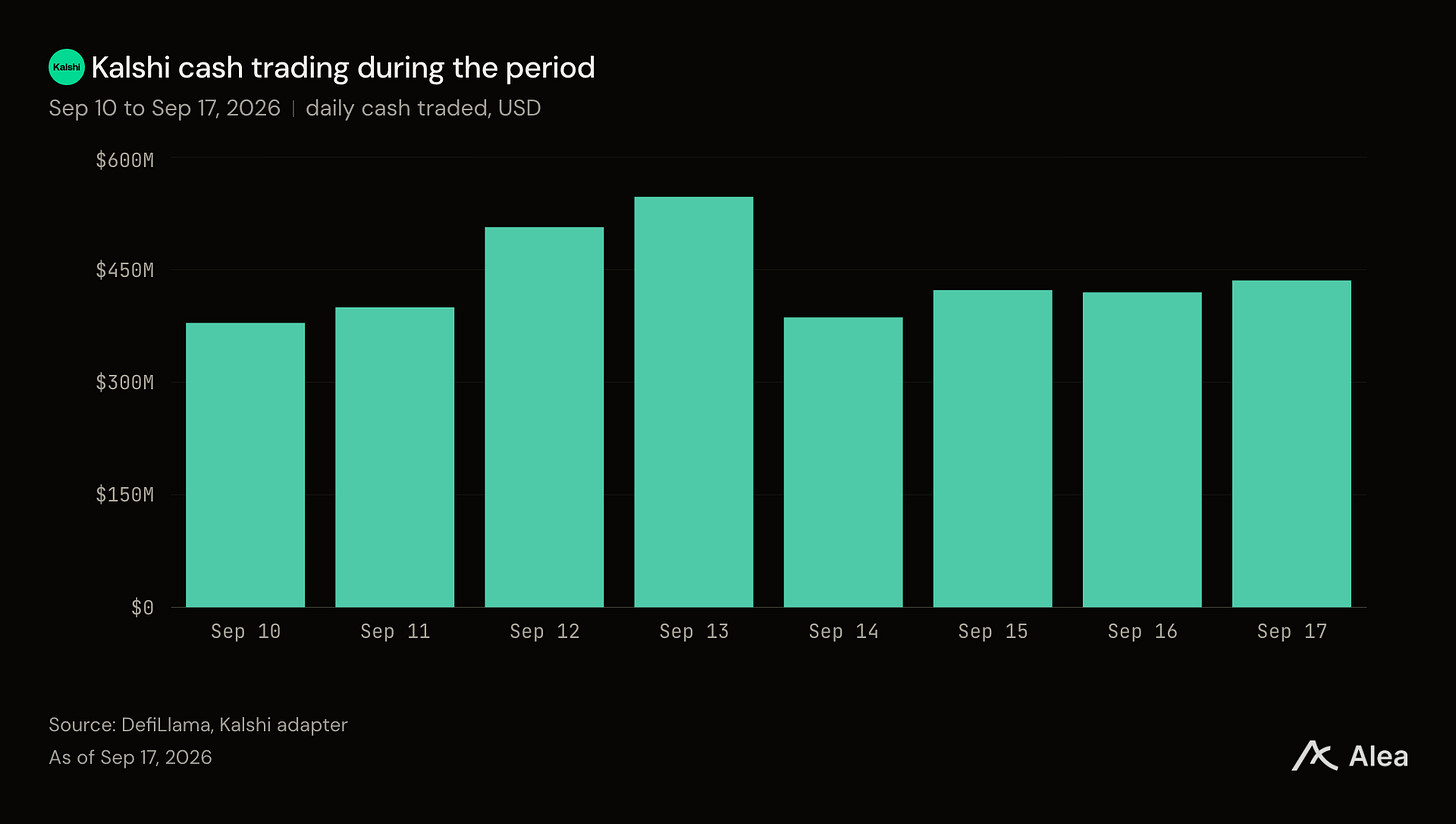
Figure: Daily fund trading scale, with the two highest days on the complete schedule Saturday and Sunday.
Two businesses, one exchange
Kalshi's trading volume and Kalshi’s beliefs reside in different places, with a noticeable gap. Football parlays account for 58.0% of contract trading volume, holding 33.0% of positions. Cryptocurrency accounts for 14.7% of trading volume, holding 1.6%. Electoral types reflect this: they account for 0.2% of weekly trading volume but hold 24.9% of each open contract. Nobody trades it. Everyone holds it.
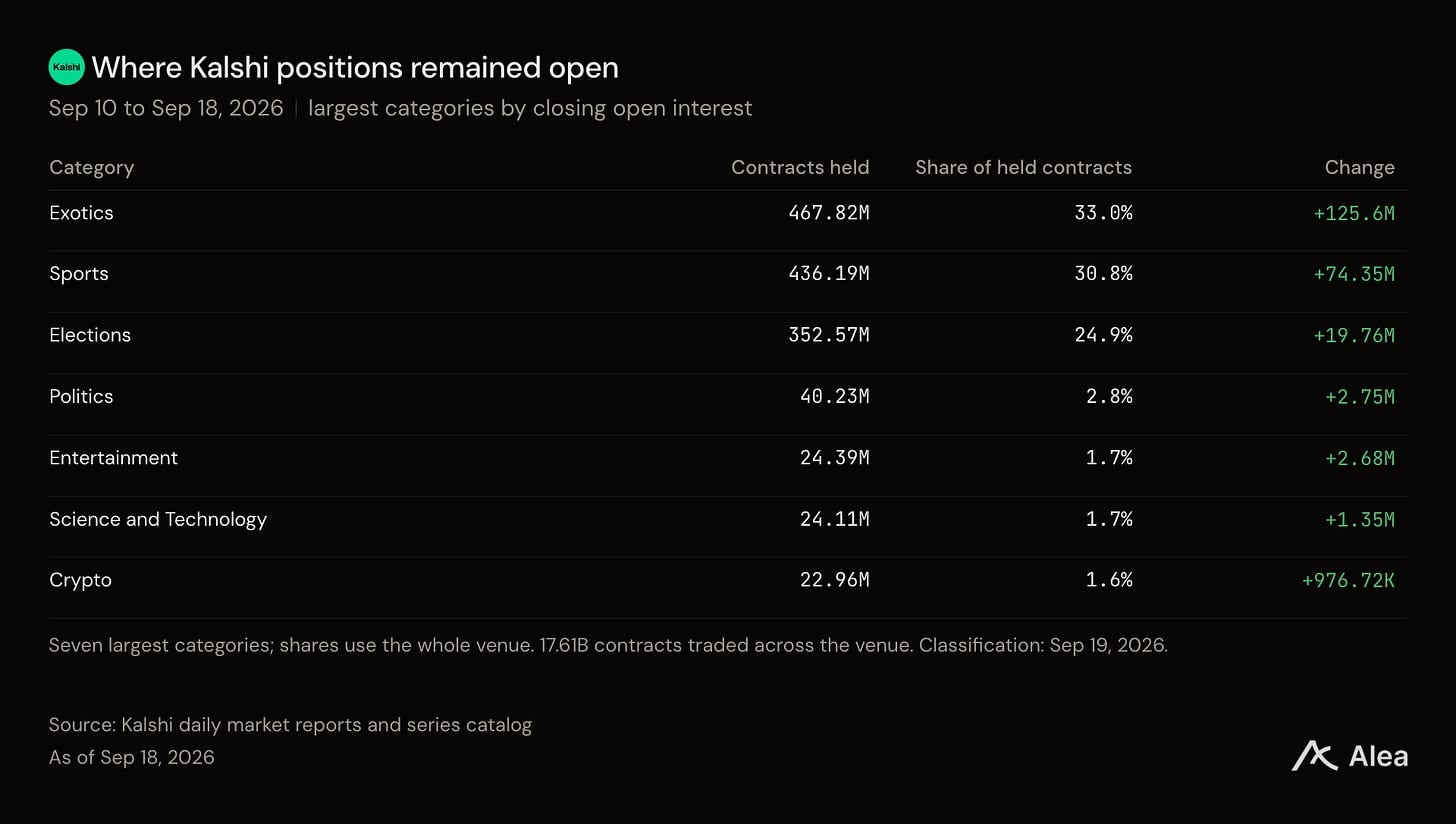
Figure: Ranked by holdings (rather than trading volume) within the same categories.
Turnover turns these into numbers. Cryptocurrency saw a turnover of 115.7 times the average holdings over nine days, averaging 22.33 million contracts held. Football parlays had a turnover of 34.7 times, holding 294.87 million. The turnover rate for electoral types is about one-tenth of its order book.
The quick half of the exchange bears the trading volume; the slow half bears the predictions.
The record that doesn’t count as a record
The open contracts at the end settled at 1.417 billion, growing from 1.221 billion nine days ago by 16.0%. Half of that comes from the turnover of a single product.
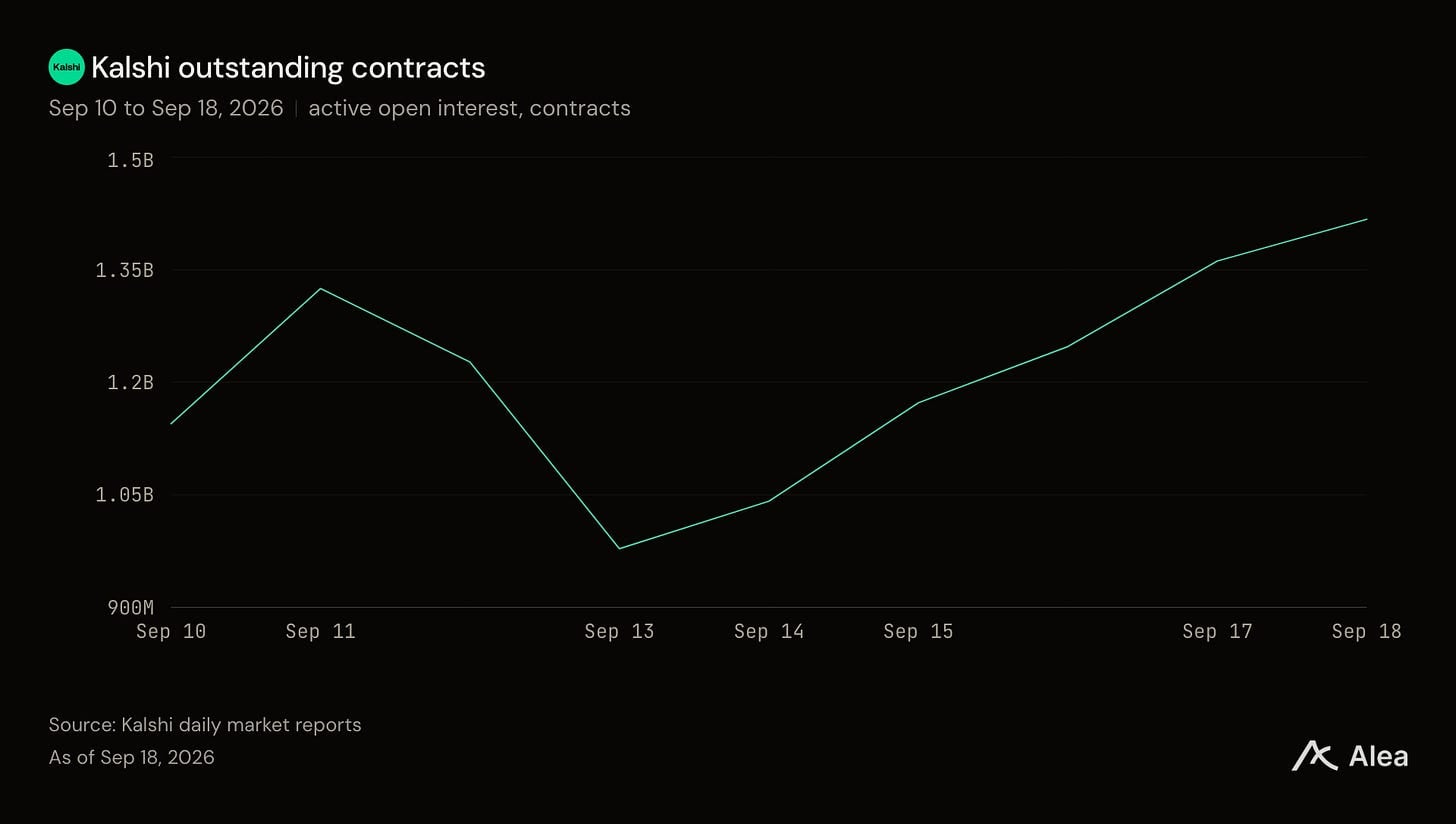
Figure: Daily open contracts, with Sunday lows and Friday peaks arising from parlay cycles.
The football parlay market is created and destroyed weekly. On Friday, September 11, it held 431 million contracts, dropped to 89 million on Sunday, September 13, and returned to 468 million on Friday, September 18.
Excluding parlays, the exchange’s holdings rose from 879 million contracts to 949 million, an increase of 8.0%, with no weekend retreat in the entire sequence. Friday's 1.417 billion is the highest daily close during this period, but when excluding parlays, Friday’s figure is lower than Thursday’s.
The profitable prediction
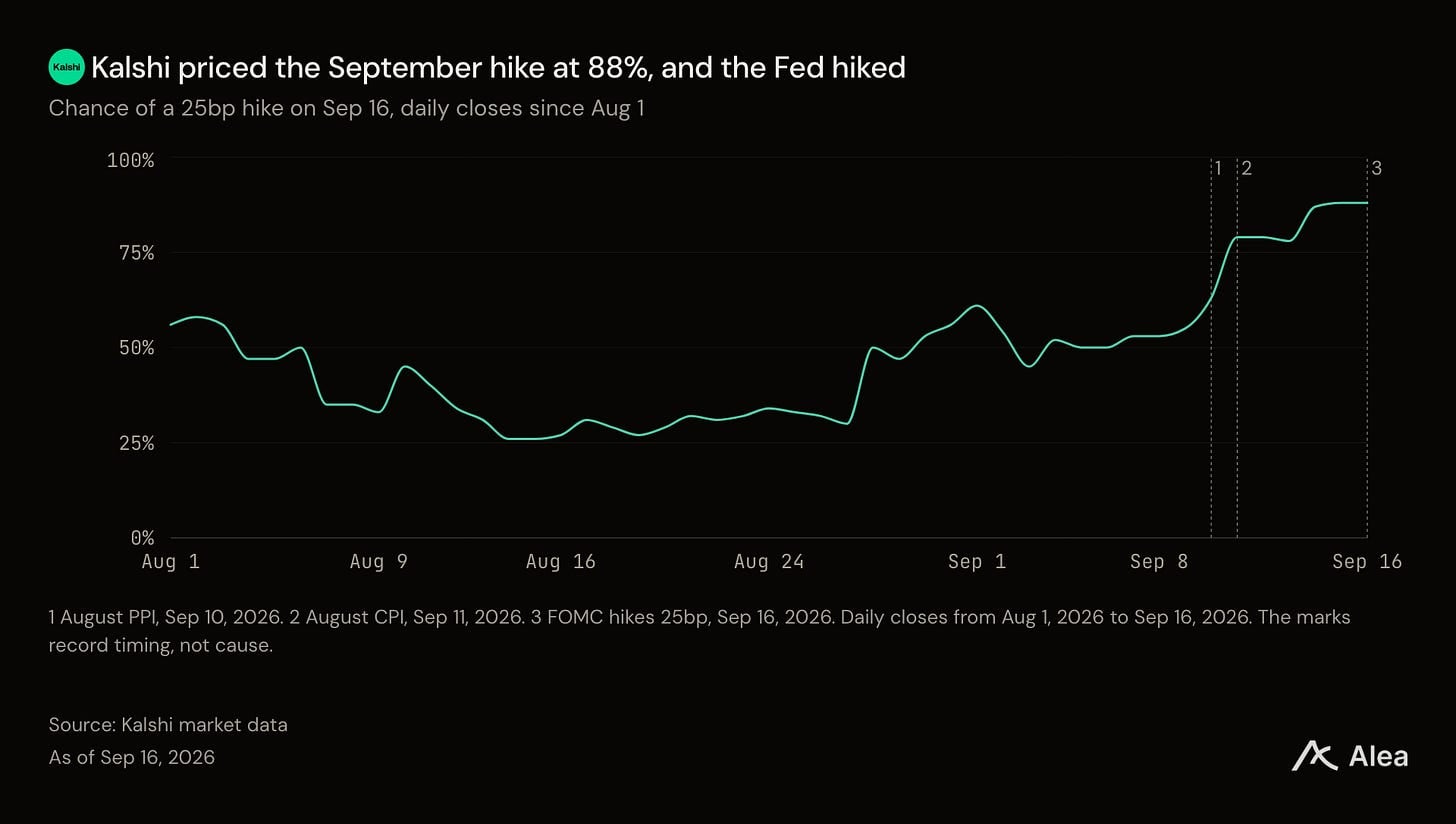
Figure: Kalshi September interest rate hike contract daily closing prices since August 1, layered with August PPI, CPI, and resolutions.
Kalshi’s September interest rate hike contract opened in August at 56%, dropped to 26% on August 14, and was still at 30% on August 27. The next day it jumped to 50%, just hours after Federal Reserve Chairman Kevin Warsh spoke in Jackson Hole. The climb from there was mechanical: August PPI was released on September 10, showing a year-on-year increase of +5.4%, with diesel up 24.1%, closing at 63%; August CPI was released on September 11, showing a year-on-year increase of +3.4%, with gasoline up 3.9%, closing at 79%. By September 15, it reached 88% and maintained that until the resolution.
The committee approved raising the target range by 25 basis points to 3.75-4.00% with a 12-to-0 vote. Warsh linked this decision to his August speech: “As I said at the Jackson Hole policy symposium, I find it difficult to describe broad financial conditions as tight. The committee broadly agrees with this perspective. So we removed a dose of accommodation.” Two months prior, the same committee split 9 to 3, with Hammack, Kashkari, and Logan dissenting in favor of a rate hike. Kalshi’s pricing tracked the resolution of that debate, moving from 26% to 88%.
Then the market moved to October
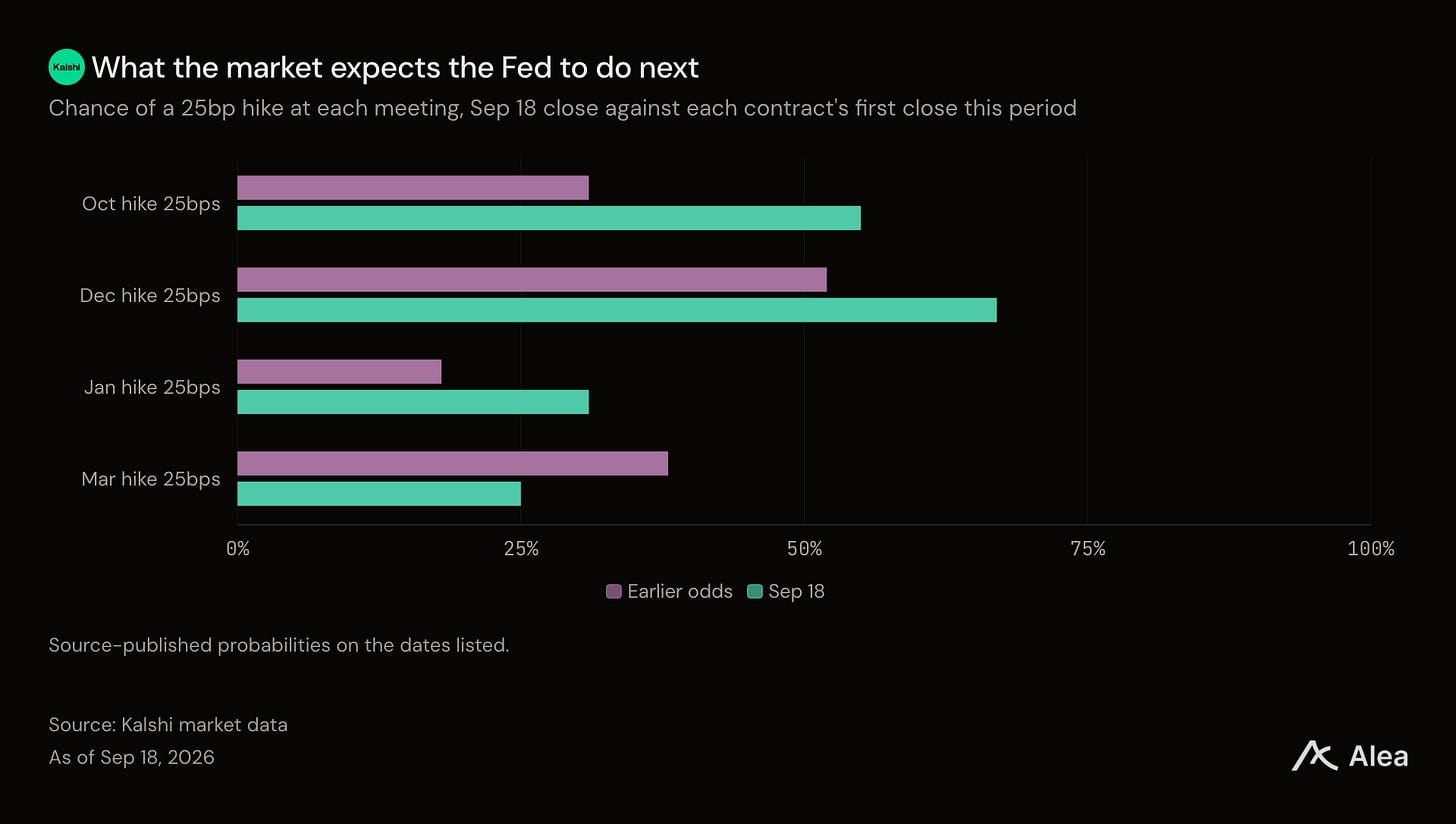
Figure: Kalshi quotes for four meetings (September 18 closing compared to the first closing period), with October and December up, and March down.
The Federal Reserve announced predictions alongside the resolution, and this set of data was hawkish in every direction: growth upward, inflation upward, interest rates upward, and unemployment rate downward by two percentage points. The median participant set the fund rate at 4.1% by the end of 2026, higher than 3.8% in June. Warsh did not agree with any of this. “I don't do forward guidance,” he said of those predictions, “Those are not my predictions. They are the predictions of my 18 colleagues.” He personally submitted no predictions.
The distribution below that median is what’s worth reading. Among the eighteen individual forecasts, the lowest is 3.9%, rounding to the new midpoint, with no participants predicting a rate cut this year. Twelve out of eighteen fell in the midpoint of the 4.00-4.25 range, which precisely indicates another rate hike in the remaining two meetings.
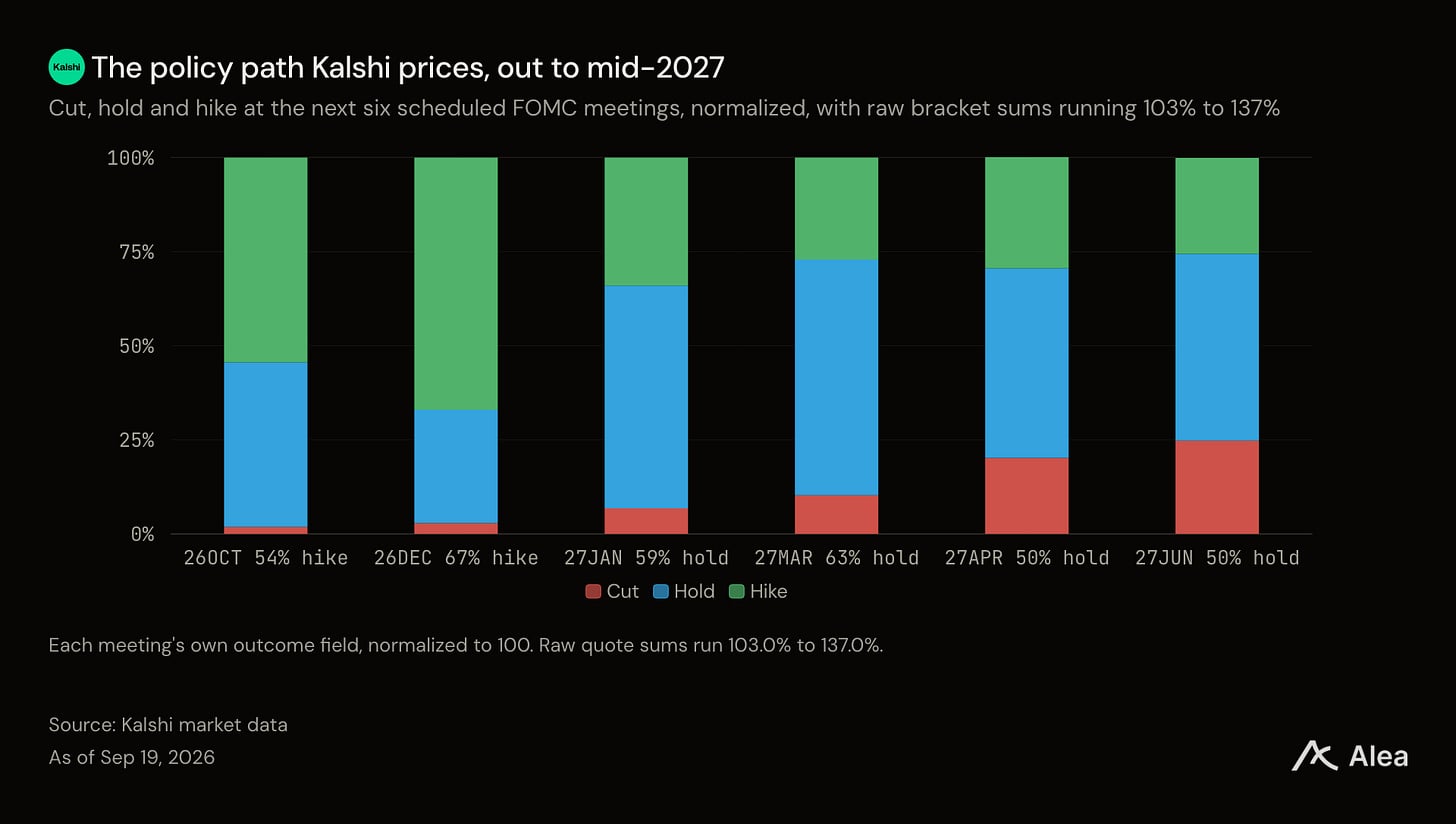
Figure: Pricing path for the next six FOMC meetings, normalizing rate cuts / holds / hikes to 100%.
Kalshi's October contract closed at 55%, and December closed at 67%. Summing both, the exchange prices these two meetings at 1.22 times twenty-five basis point changes, while the committee's median is one. Two-thirds of committee members support a rate hike before the end of the year, while the pricing for the next meeting is just slightly above a fifty-fifty split.
This repricing is more easily attributable than in most cases. The Federal Reserve was in a quiet period from September 5 to September 16, and the only subsequent statements were from Bowman in two speeches on September 18, both discussing bank regulation. The pricing for October moved from 45% to 55% with no accompanying policy communication. Another explanation is the data from the same period: initial jobless claims fell to 196,000 on September 17, and August retail sales grew by 1.2%.
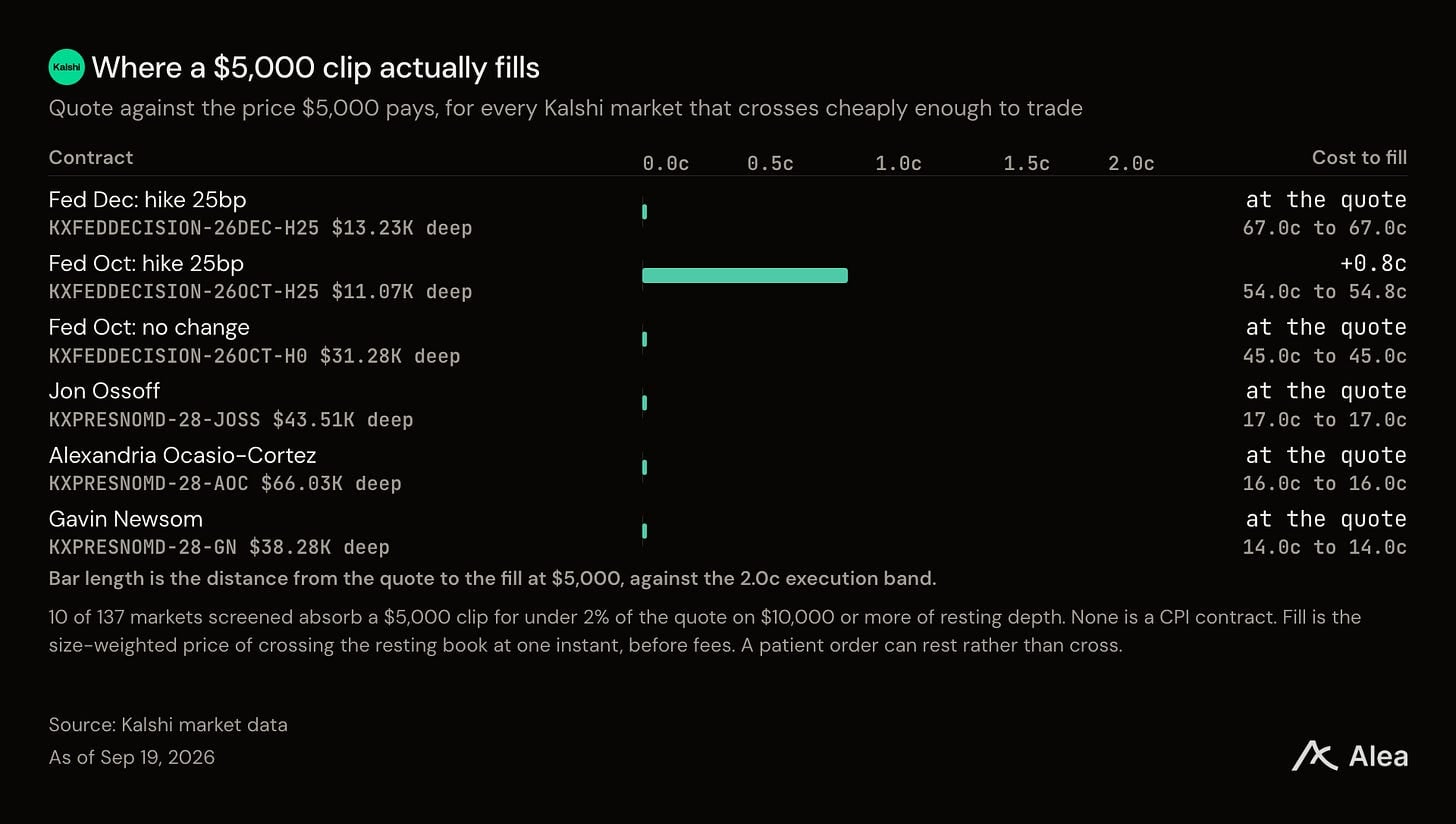
Figure: The cost of crossing the order book with $5,000 (Federal Reserve contract compared to the three deepest markets).
Among the 137 Federal Reserve, CPI, and Democratic nomination markets traversed on September 19, ten could absorb a $5,000 transaction with a cost of under 2% on the quote, with order depth above $10,000. None of these ten were CPI contracts. The October interest rate hike contract has the highest crossing cost among those that survived, quoting at 54 cents with an additional cost of 0.8 cents, and it is precisely the contract carrying this week’s repricing.
The deepest order book on the exchange belongs to a market with almost no transactions.
What the resolution did to holdings
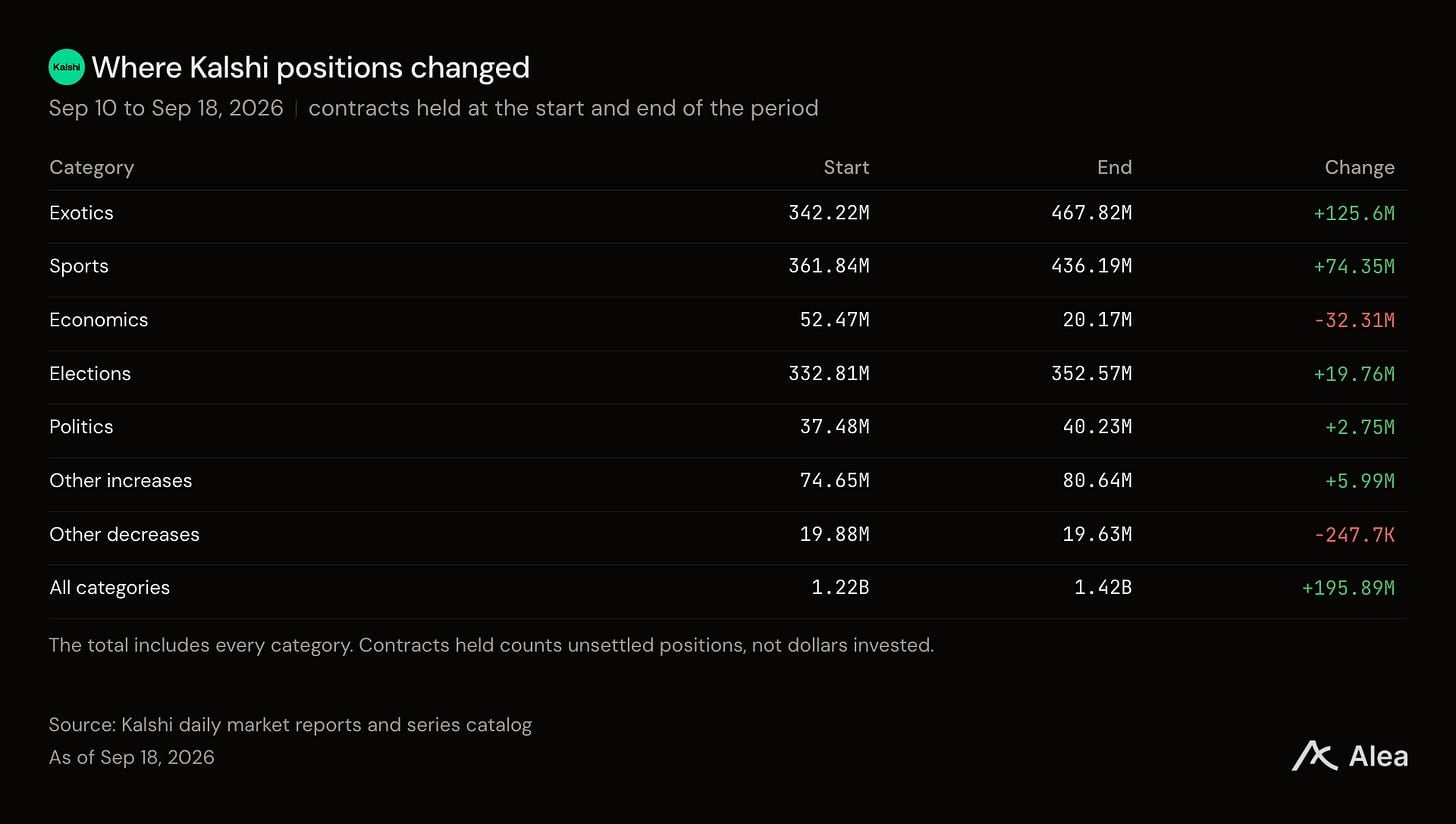
Figure: Holding and changes of each category of contracts at the beginning and end of the period.
Economics is the noisiest category this week and also the biggest loser. Contract trading volume rose 152.1% to 81.7 million, while holdings decreased by 32.3 million, as September Federal Reserve contracts executed 62.3 million contracts, with holdings falling from 32.5 million to 1.8 million after settlement. This category hasn’t lost interest; everyone settled what they were holding, and the funds left. The only meaningful position built underneath is KXRATECUTCOUNT, which asks how many changes rather than whether there was a change, adding 1 million.
What people actually bought
KXMVECROSSCATEGORY, that is the football parlay book, transacted 9.52 billion contracts, accounting for 54.1% of the entire exchange’s trading volume, with holdings of 362.5 million contracts at the end; these are combination contracts for the NFL and NCAA, settled by the leagues managing the events.
KXPRESNOMD, that is the Democratic nomination, transacted 6.8 million contracts, increasing holdings by 6.6 million, with 14.46 million held at the end, retaining one holding for nearly every contract traded, while a parlay retains a holding for every twenty-six trades.
On the other hand, the Super Bowl increased holdings by 21.4 million, the World Series decreased by 6.4 million, and the two accounts for US Open singles finished at zero after the events concluded.
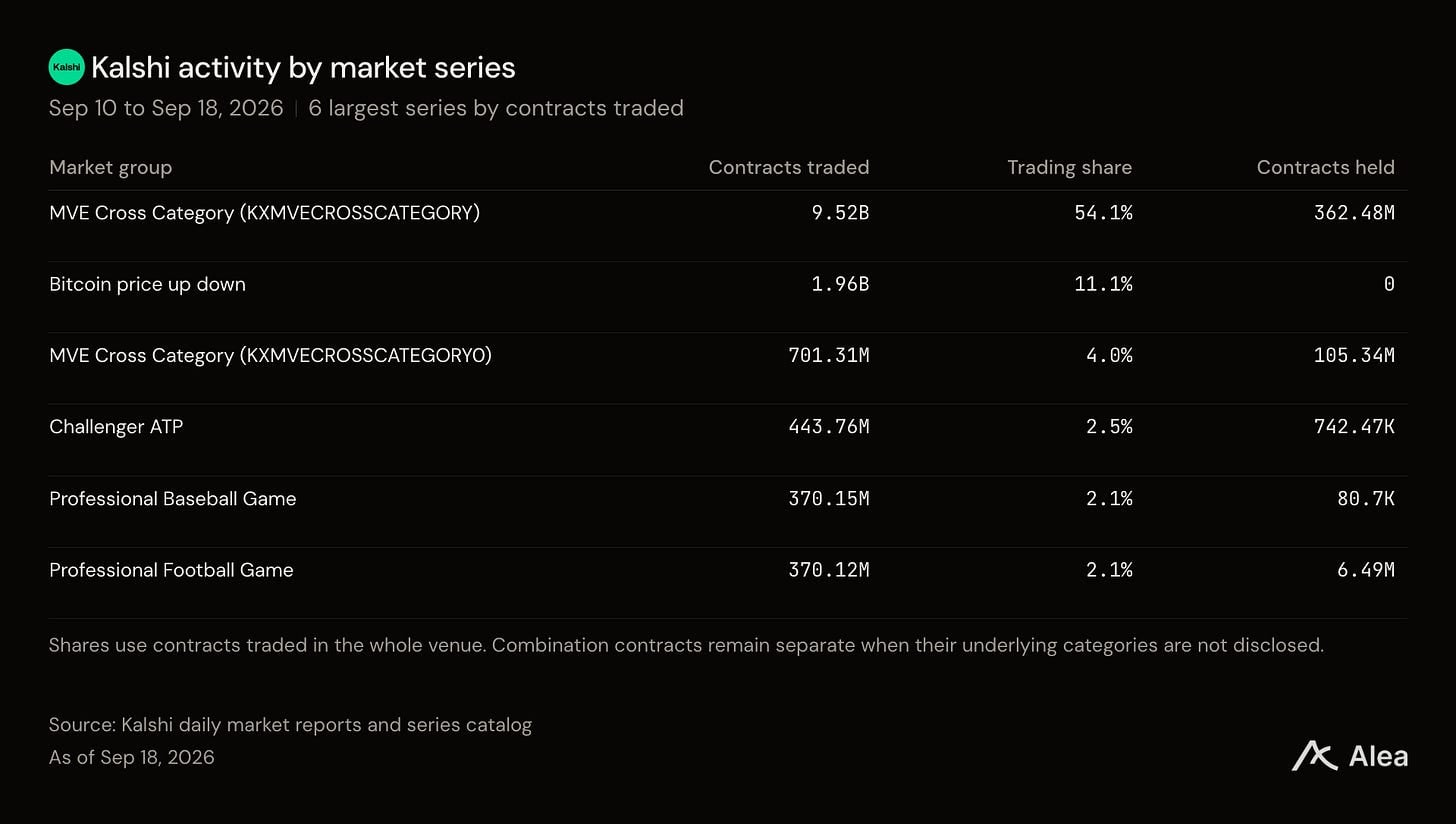
Figure: The highest trading volume series over nine days, with one line taking up more than half.
Another account
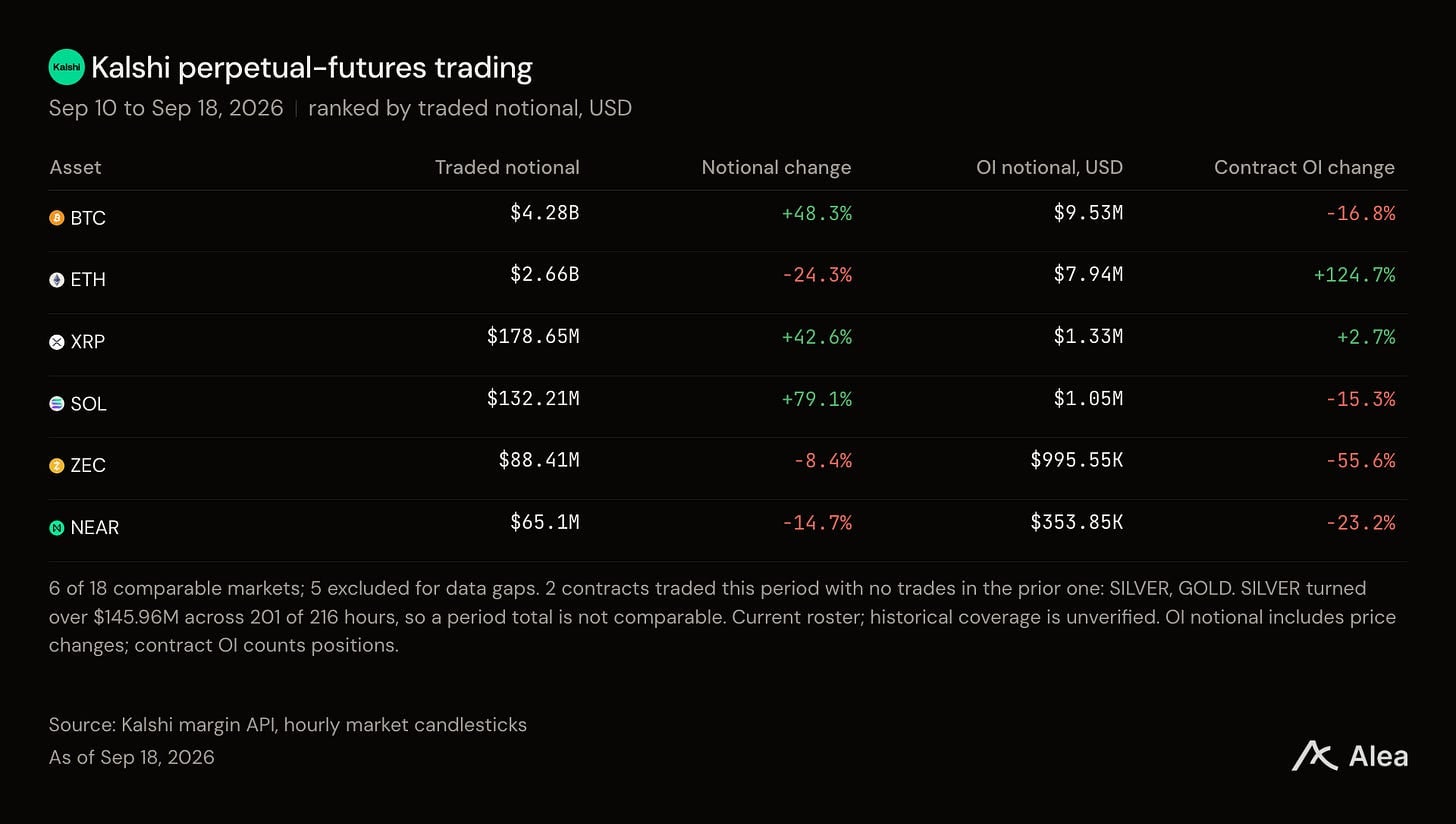
Figure: Kalshi perpetual futures ranked by notional volume and changes.
Kalshi’s perpetual futures had a notional volume of $7.62 billion, rising by 8.6%. That’s about twice the cash turnover of event contracts. The two are not the same measure: notional volume reflects the price exposure of leveraged contracts, while cash is the money paid for a specific contract.
Within that account, the two largest markets are moving in opposite directions. Bitcoin’s notional volume rose 48.3% to $4.28 billion. Ethereum’s volume dropped 24.3% to $2.66 billion, while its corresponding holdings rose by 124.7%. The decreased turnover and increased holdings indicate this is an account being built rather than traded, which is the clearest positional change in this week’s perpetual contract mix.
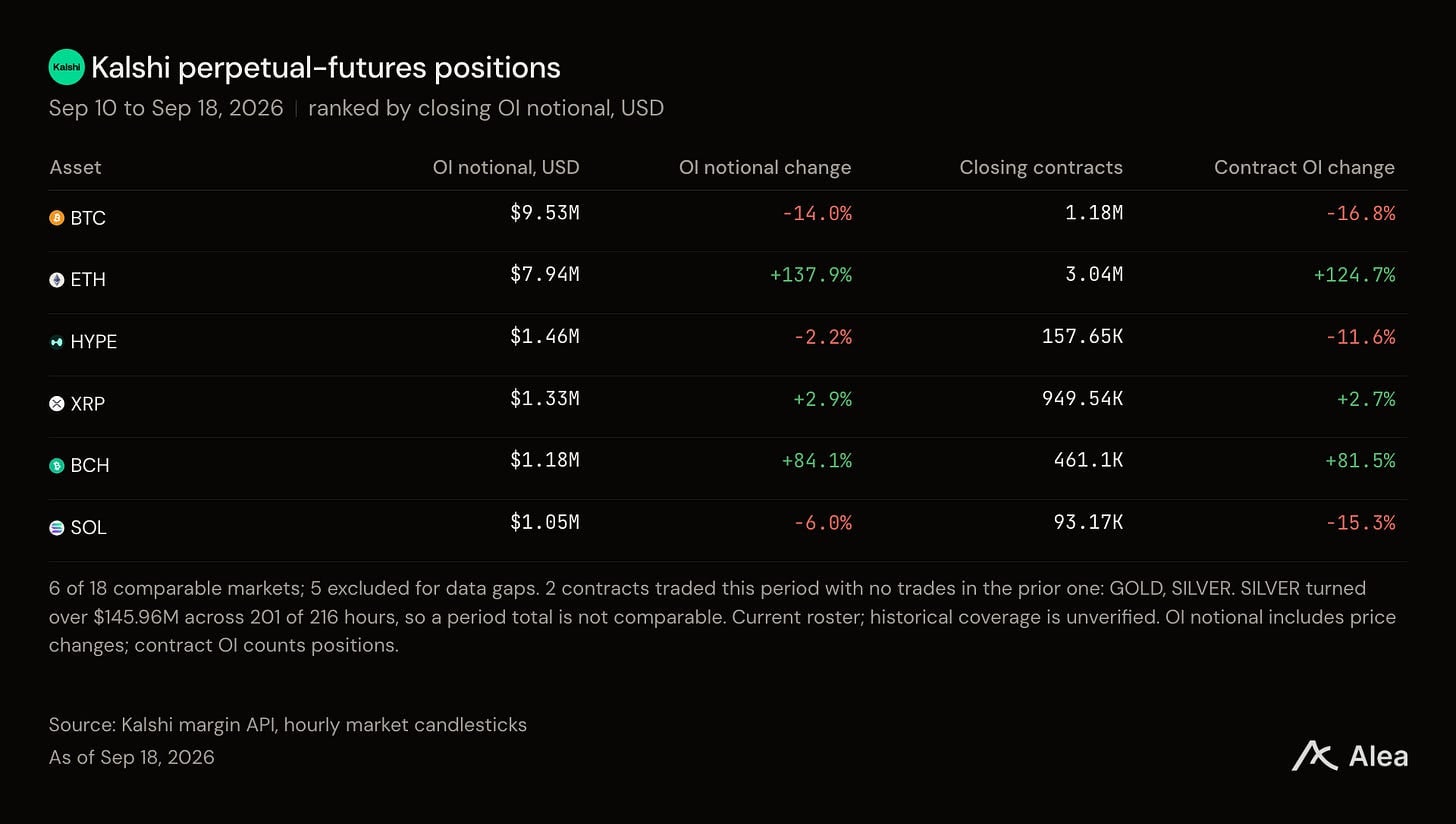
Figure: Ranked by holdings (not trading volume) in the same account, with the largest holdings in Ethereum.
This product is only sixteen weeks old. Kalshi launched the first U.S. perpetual futures on May 29, crossing $1 billion in the first week. On September 10, it added gold and silver, which were its first non-crypto perpetual contracts launched. The metals also triggered the only two rate adjustments during the window, both setting the market maker fee multipliers for a particular metal contract to zero at 04:00 UTC on September 10, and neither was retracted. Silver then traded $1.4596 billion in 201 of the 216 hours during that period, while gold covered 202 hours.
New launches, and what remains
513 series had trading during this period that were not traded in the previous period, calculated from the first observed trading date rather than the listing date on the exchange. This wave is primarily sports: 176 are Sports series, led by golf, with the PGA Tour book reaching 26.76 million contracts, followed by boxing, WNBA, UEFA Cup, AFC Champions League, and hourly temperature markets for New York and Chicago.
A comparison within this group is a microcosm of the entire period’s content: the PGA Tour holds 16.67 million of its 26.76 million contracts, while the Davis Cup market transacted 26.18 million contracts, holding 140,000. Almost identical trading volume, yet the retention variance is 119 times.
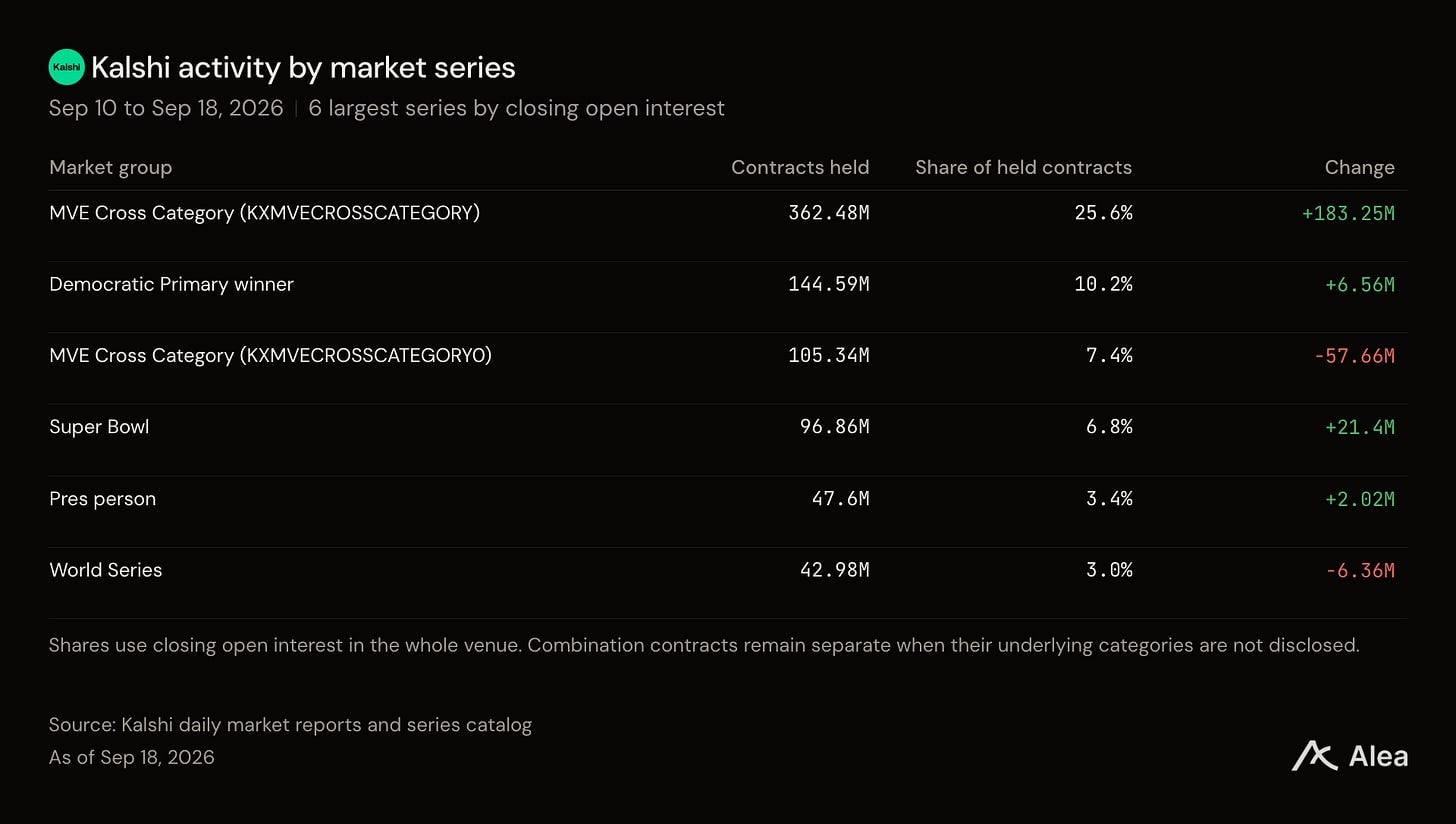
Figure: Series with the most contracts held at Friday's close, ranked almost independently of trading desks.
Were the crowd’s judgments correct, and what will be settled next
Last week, a prediction emerged early: the likelihood of the Federal Reserve raising rates on September 16 was 88%. The Federal Reserve raised rates on September 16. Among the contracts settling this period, ranked by trading volume, are the September Federal Reserve resolution, the two U.S. Open singles champions, and the week’s UEFA Champions League events.
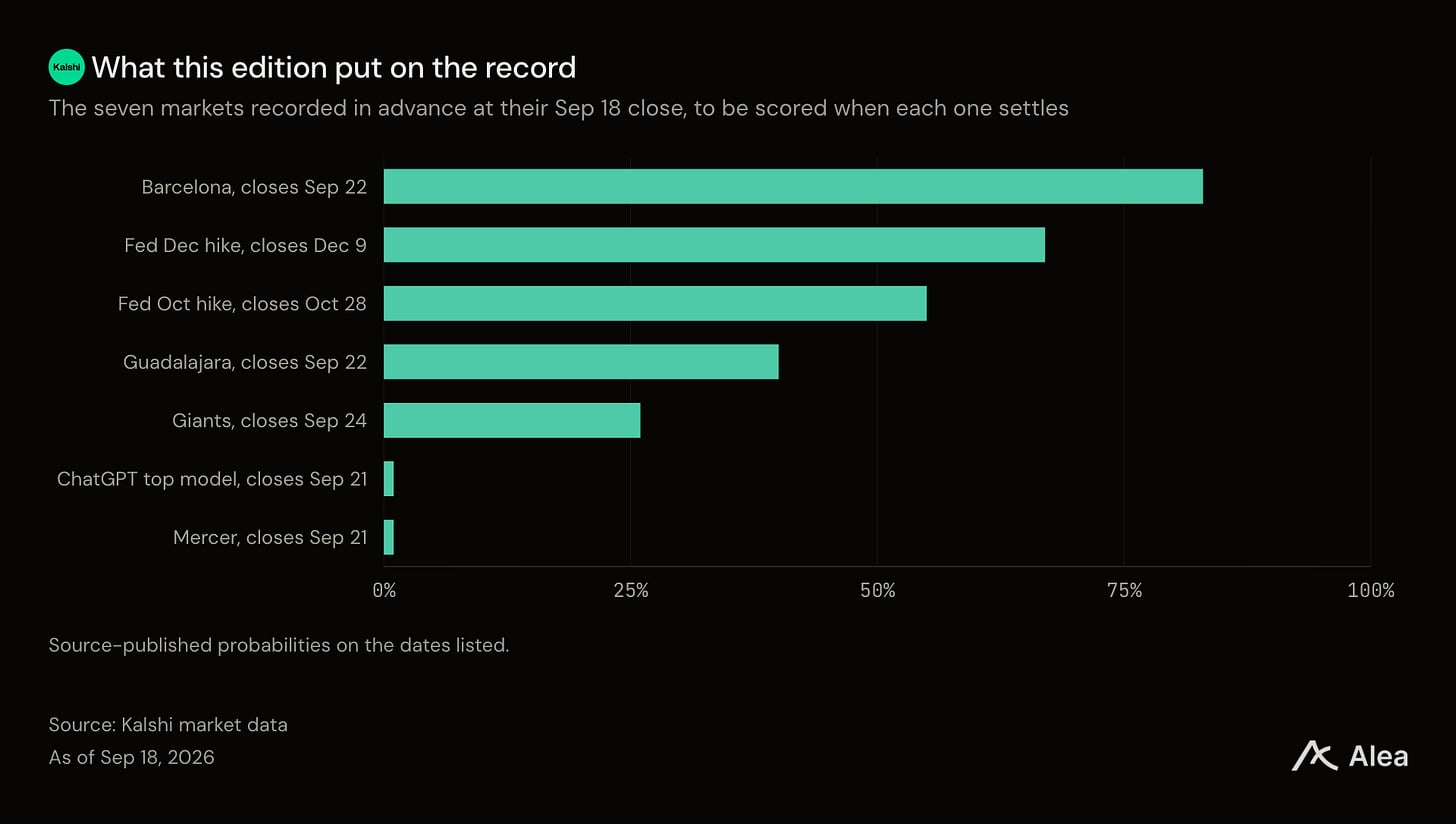
Figure: Performance of seven Kalshi markets recorded early as of September 18.
Kalshi's pricing for the October interest rate hike closed at 55%, marking its first close above 50%, up from only 31% nine days ago. Among the eighteen FOMC participants, twelve included the prediction of one more rate hike, with two meetings left to materialize. The October contract will settle on October 28. The December contract is priced at 67%, settling on December 9.
免责声明:本文章仅代表作者个人观点,不代表本平台的立场和观点。本文章仅供信息分享,不构成对任何人的任何投资建议。用户与作者之间的任何争议,与本平台无关。如网页中刊载的文章或图片涉及侵权,请提供相关的权利证明和身份证明发送邮件到support@aicoin.com,本平台相关工作人员将会进行核查。


