

Author: danny
On September 10 at 00:00, the LSKUSDT perpetual contract price was 0.116. On September 13 at 03:28:14 UTC, the price was 2.3705. In four days, it increased 20 times. On the 13th alone, the perpetual contract had a trading volume of 35.8 million transactions and 3.2 billion dollars; a total of 4.3 billion over four days.
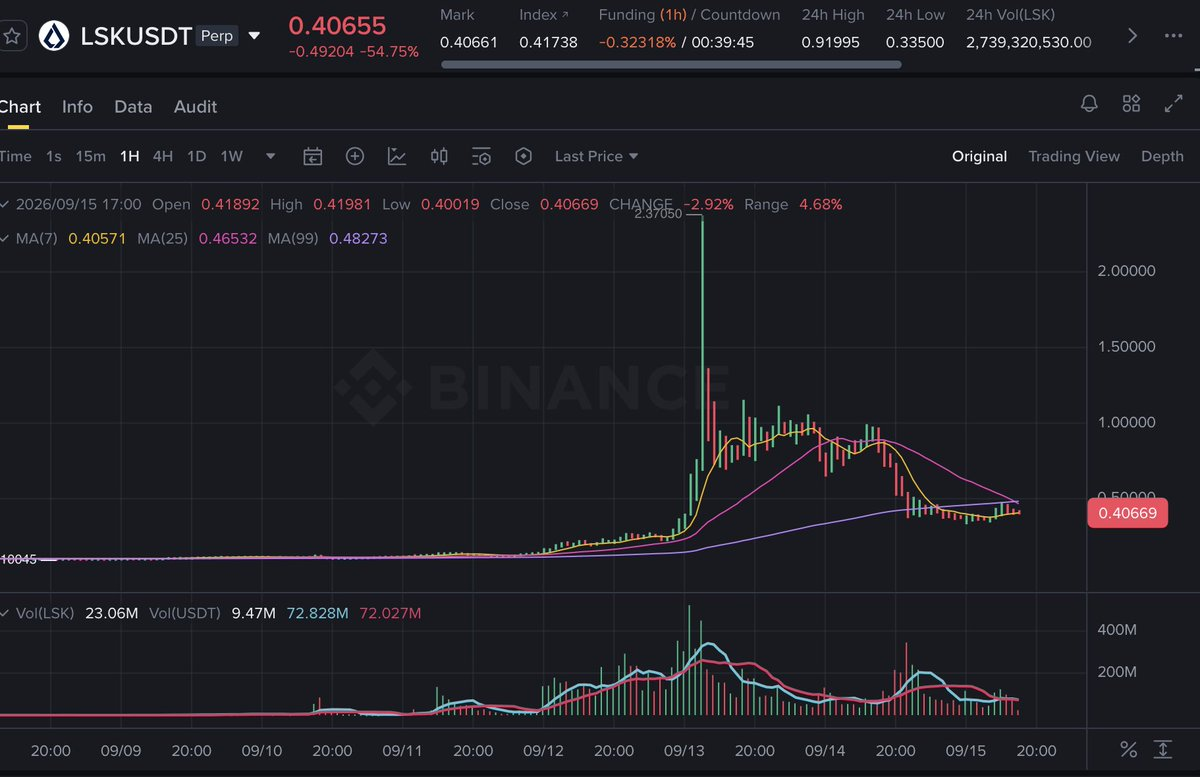
By common sense, a 20-fold increase requires a large amount of money and many buyers. Someone must have brought money and absorbed the sell orders layer by layer for the price to go up. However, when we break down these 49.79 million transactions by the active buyer, it does not appear to be the case.
Over four days, the net active buying minus active selling amounted to 81 million dollars, which accounted for 1.9% of the total transaction of 4.3 billion. Daily active buying accounted for the transaction volume as follows: 48.7%, 50.1%, 51.1%, 51.0%. The hour with the most “intense” trading was at 11:00 on the 13th, at 38.9%—seller-dominated.
A 20-fold market, where active buying and selling are almost equal, what does that mean?—There is something fishy~
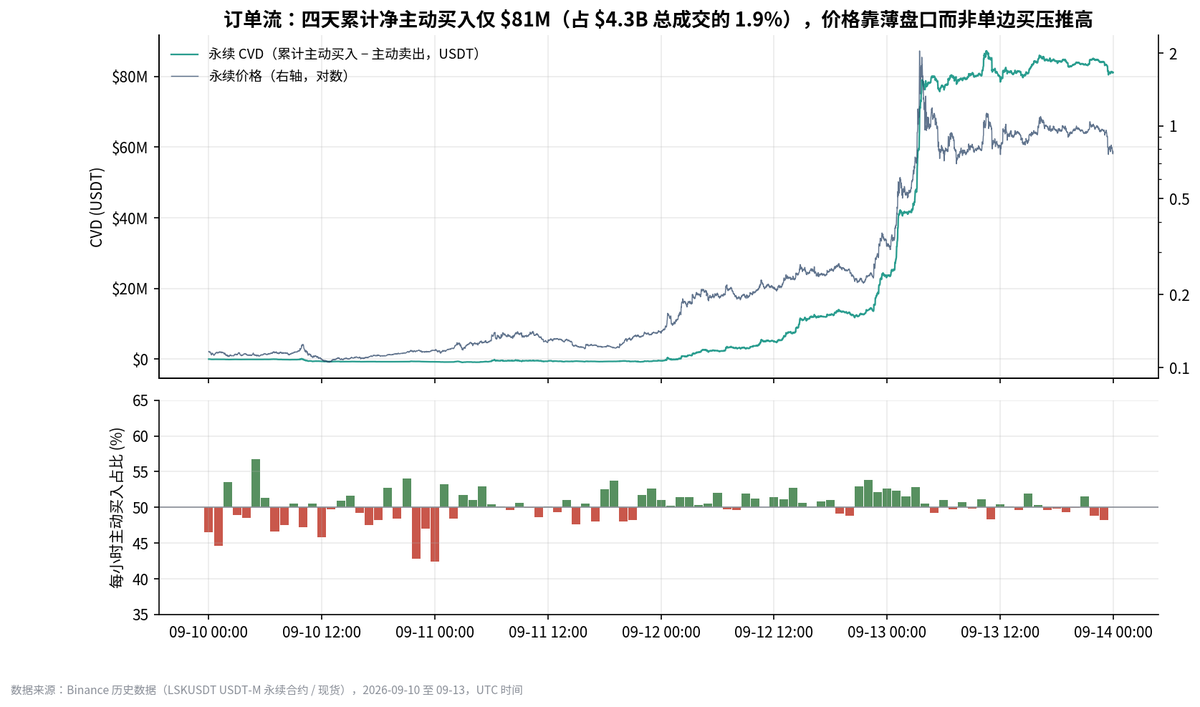
This is what this article will discuss: If not the buying, where did the 20-fold increase come from?
Next, I will unravel the data step by step—transactions, order books, basis, and positions.
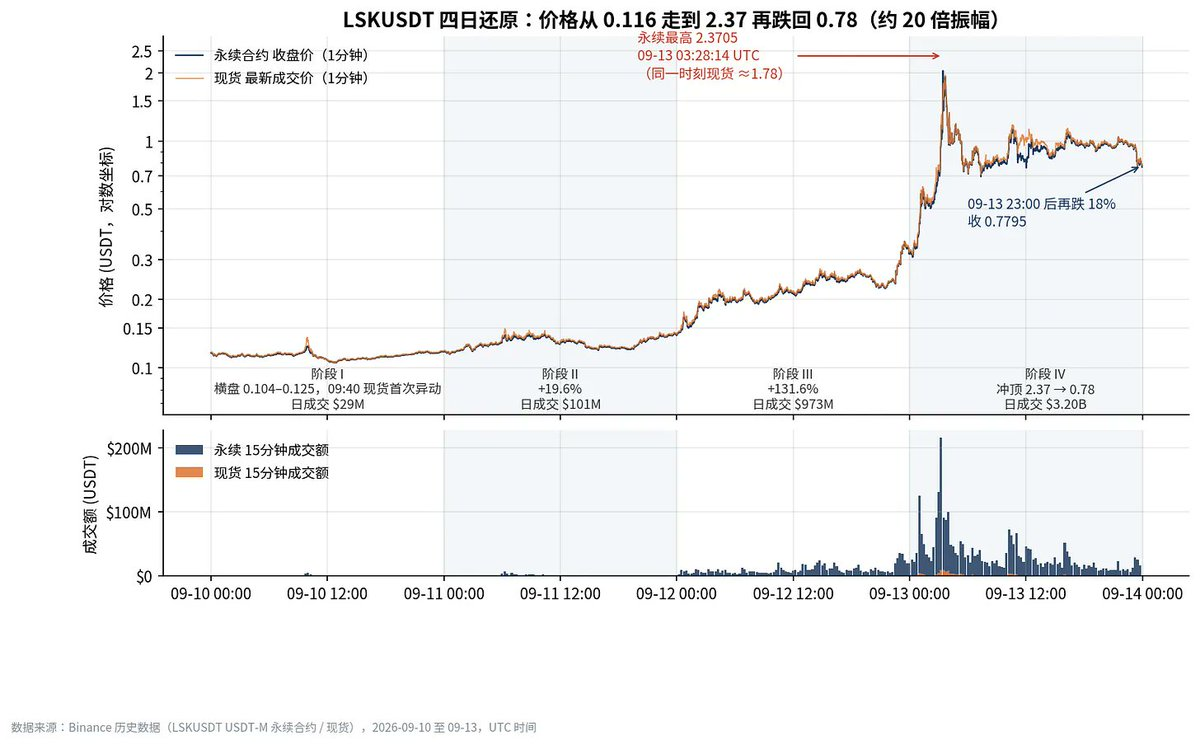
Figure 1|Four-day price (logarithmic scale) and 15-minute trading volume. The gray background represents September 11 and 13.
1. First Layer: Where Did the Money Go?
First, let's look at what LSK's order book looks like.
The number of transactions has increased 87 times in four days (starting from the 11th), from 410,000 to 35.8 million; the trading volume increased 112 times. However, the average transaction amount has hardly changed: the average increased from $69.7 to $89.3, while the median decreased from $34.8 to $28.6.
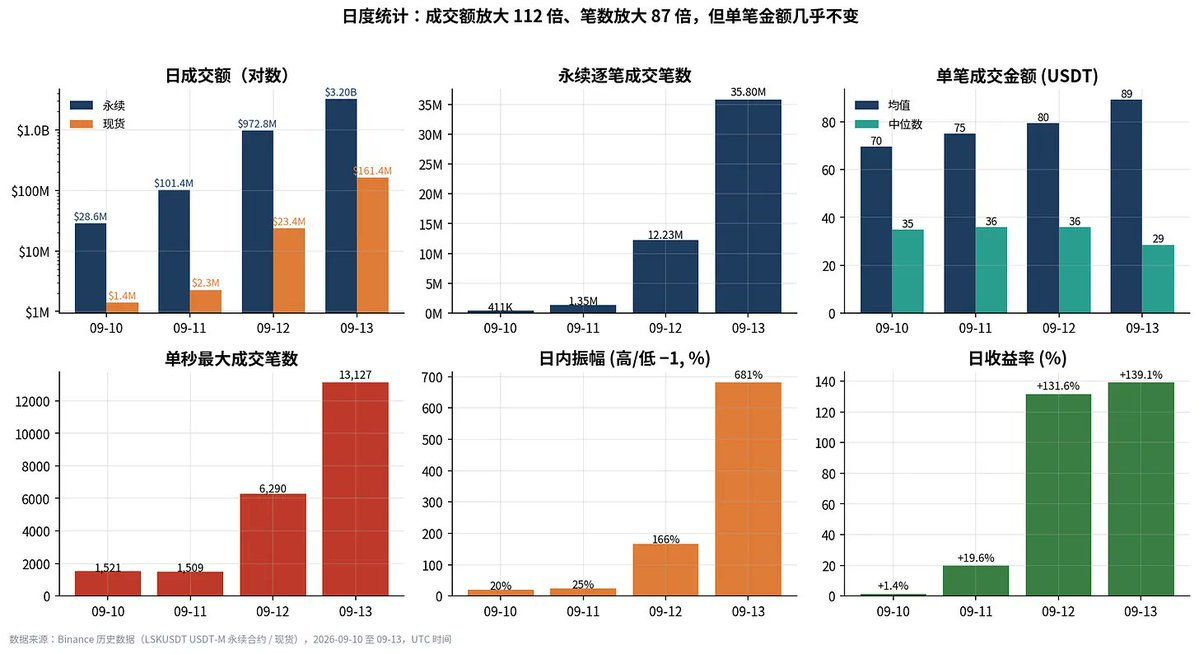
The distribution of transaction amounts remained basically the same over the four days:
The four modes fixed around $5, $12, $30, and $80, rotating in weight without changing positions. About 60% of the number of transactions was less than $50;
More than 70% of the trading volume came from the range of $200 to $10,000;
Orders over $10,000 contributed only 2.4% to the trading volume on the 13th. The largest single transaction was $1.49 million. The 3.2 billion dollars was built up from tens of millions of orders between $50 and $500. There are no signs of large capital building positions with large orders.
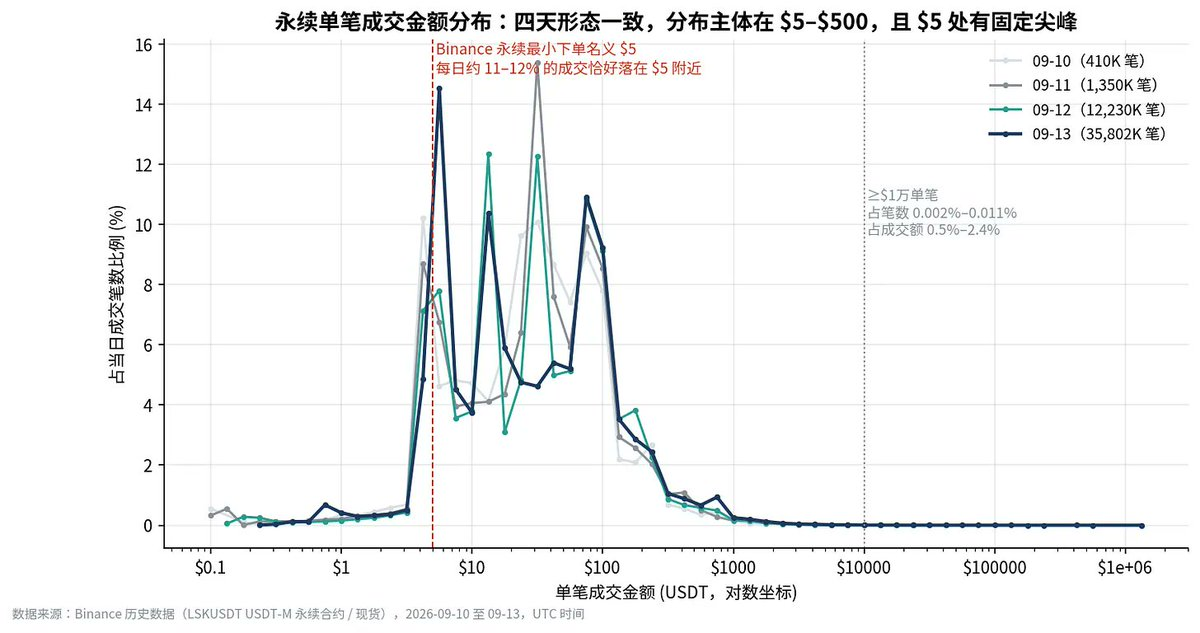
Figure 2|Perpetual single transaction amount distribution (logarithmic horizontal axis). The form over four days was consistent, with a spike at $5.
Why are there $5 transactions? Because the minimum order amount for Binance perpetuals is $5. Every day, 11%–12% of the single transactions fall between $4.9 to $6.0, with corresponding quantities adjusted inversely with the price—on the 10th, 45 LSK was most common, on the 13th, 6 LSK. The total trading amount under $10 accounted for only 2% of the trading volume. Although the contribution of these types of orders to the trading volume can be considered negligible, they determine the number of transactions, matching load, and the “activity” and “heartbeat” visible to the outside—indicating these are active orders from certain traders/algorithms.
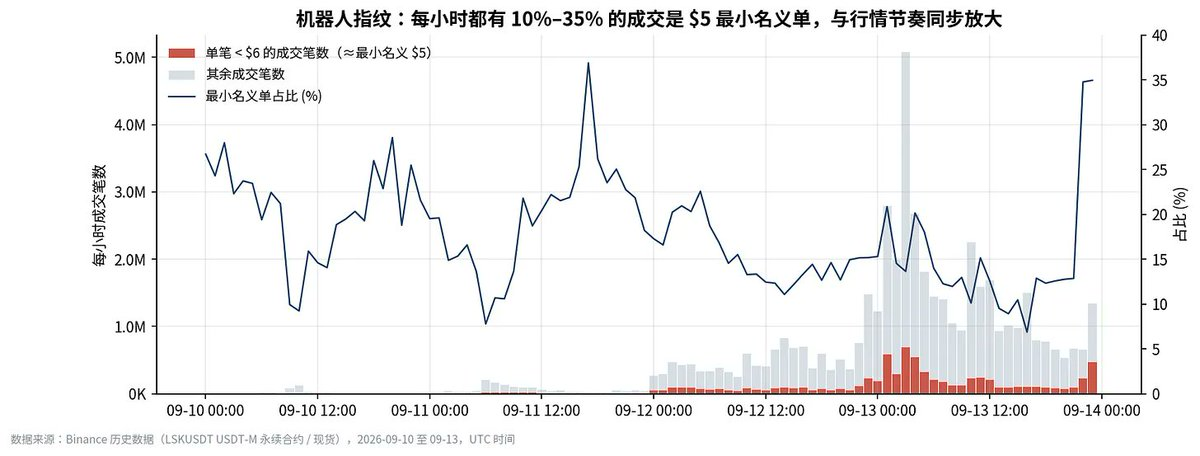
Figure 3|The number of minimum nominal orders of $5 in each hourly trading volume and percentage
Next, let's look at the relationship between trading volume and positions. The daily trading volume divided by the daily average position over four days was 13 times, 25 times, 60 times, and 99 times. On the 13th, each position was turned over nearly a hundred times, while the net change in positions on the same day accounted for only 1%–2% of the trading volume. The highest single second was 13,127 transactions, with 226,919 transactions in one minute at 03:27.
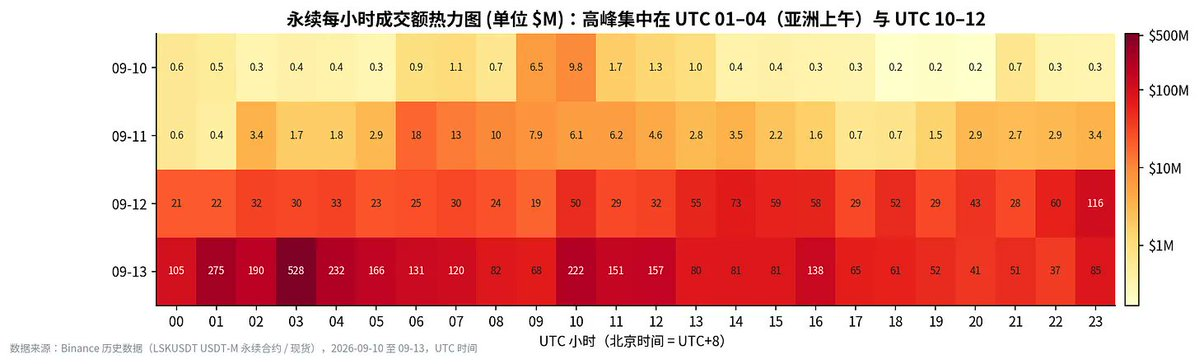
The answer to the first layer: The money did not go into building positions. The trading was a flip— the same batch of positions being repeatedly traded, complemented by a swarm of robots trading the same cabbage at $5. They generated $3.2 billion in trading volume but did not create a direction—it was just creating an illusion of activity.
So what moved the price?
2. Second Layer: How Thin is the Order Book?
The trading volume expanded 112 times, but the ±1% order book depth only expanded by 2.4 times—average daily values were $98,000, $110,000, $237,000, and $230,000. Dividing the minute trading volume by the ±1% bilateral orders over four days gives us 0.20 times, 0.64 times, 2.85 times, and 9.63 times. Every minute on the 13th, the average trading volume was 9.6 times the total pending orders at ±1%; 31 times at 01:00, 35 times at 04:00.
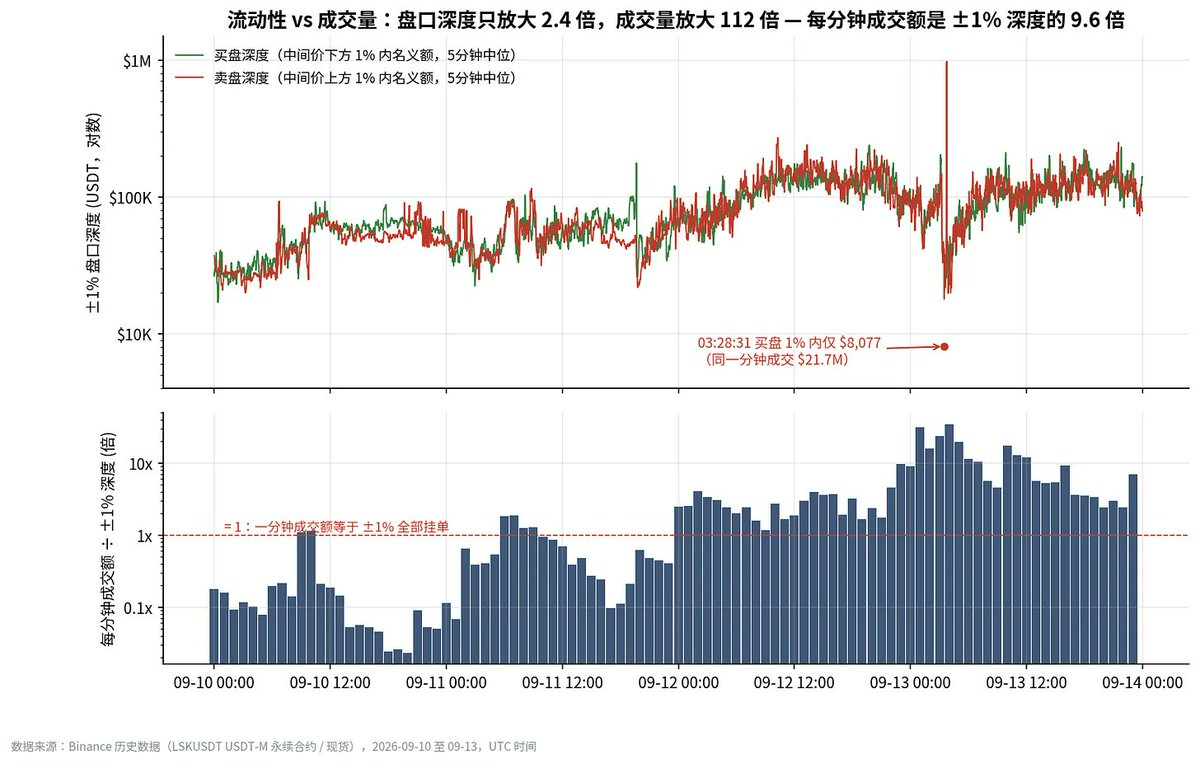
Figure 4|Top: Nominal amount of buy and sell orders within ±1% (logarithmic); Bottom: The ratio of trading volume by minute to ±1% bilateral depth.
It is clear that market makers did not adjust their quotes with the expanding trading volume. Because in such volatility, expanding quotes equals taking on unhedgeable inventory risk, retreating is the rational choice. The consequence is that the order book is so thin that the same net buy/sell can disproportionately push the price. The data shows: Starting on the 12th, the first-order autocorrelation of one-minute returns shifted from zero to positive (+0.044, +0.076 on the 13th), and skewness changed from symmetric to +1.98.
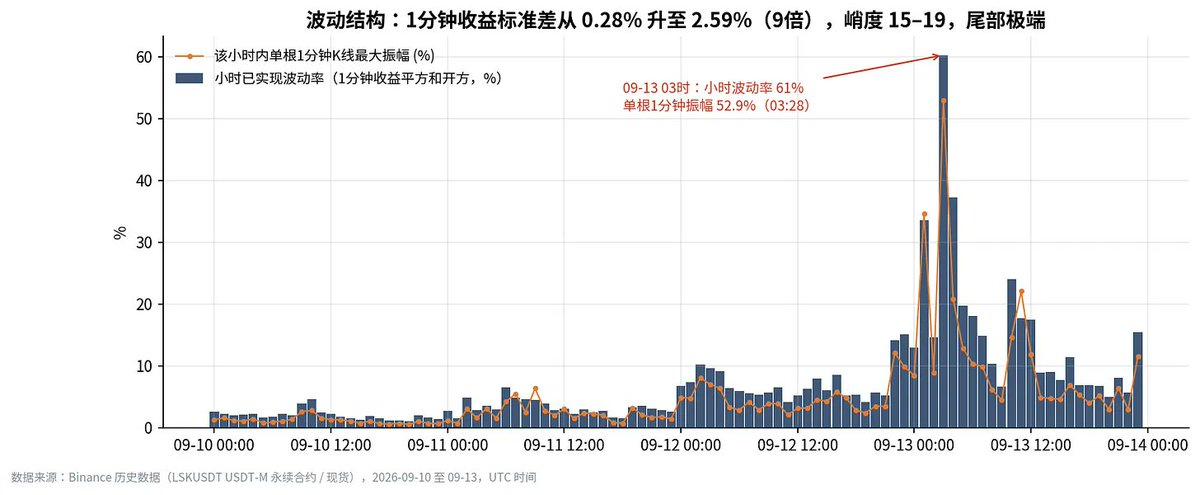
The answer to the second layer: The order book is thin, explaining why prices “instantaneously break through” (aka spike). But thin is just a condition, not a direction. A thin order book can jump up or down.
Where does direction come from?
3. Third Layer: Why Are Perpetuals Cheaper Than Spot?
LSK has two markets: spot and perpetual contracts. The price of the perpetual contract has a difference from spot, known as the basis. Under normal circumstances, perpetuals are close to or slightly higher than spot—whoever deviates pays. When perpetuals are above spot, longs pay funding fees to shorts, and vice versa.
During these four days, the perpetual price was always at a discount to spot (perpetual < spot), expanding daily: average daily rates were -0.71%, -1.17%, -1.66%, -3.35%. Strangely, on the 11th and 12th, there was not a single minute with a premium (perpetual > spot).
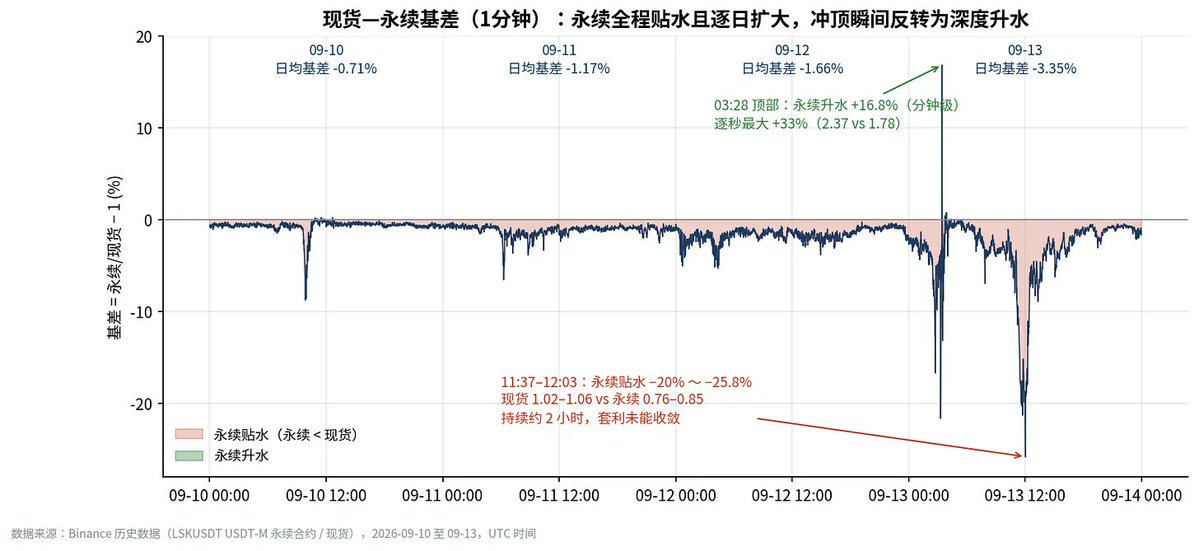
Figure 5|One-minute basis = perpetual / spot - 1
A discount in perpetual contracts means that there is stronger selling pressure on the perpetual side than on the spot side. On an asset that has risen 3 times in price, the selling pressure on perpetuals can only come from one type of person—those shorting. They sell coins they do not own on perpetuals, pushing the perpetual price below spot while continuously paying funding fees for this.
Rewind to September 10 at 09:40, the first anomaly in four days. The spot price moved from 0.1195 to 0.128, while perpetuals only reached 0.1209, and the basis instantaneously widened to -8.8%; positions increased by 50% in twenty minutes, while the large trader long to short ratio fell from 1.57 to 1.11. As soon as the price moved, some accounts opened shorts above. Before 11:00, the price returned to the original point. This segment is a microcosm of the following three days: spot moves first, perpetuals increase volume, shorts enter to push the price down.
The answer to the third layer: The direction comes from the shorts. They are pushing down.
So how many shorts are there?
4. Fourth Layer: A Day of Traps Forming
From September 10 to the 12th, the positions on the 12th finally built up.
On this day, perpetual positions rose from 36.2 million LSK to 91.8 million (peak at 20:25 UTC, ×2.5), with a price increase of +131.6%. In a normal rally, positions and prices rise together, with longs adding to their positions; the positions on the 12th also increased, but LSK was different—in the rally, three values moved in the opposite direction:
The large trader long to short ratio dropped from 1.13 to 0.47;
The total market long to short ratio dropped from 1.18 to 0.53;
The large trader long to short position ratio dropped from 0.98 to 0.71.
The correlation between 5-minute price changes and changes in positions fell from +0.34 and +0.39 on the first two days to zero.
To translate: Among the newly added 55 million LSK positions, the shorts were the main force. By the night of the 12th, every 2 short accounts in the perpetual market corresponded to 1 long account, and the large traders were also net short based on their position volume. Another notable figure is that the large trader long to short position ratio of 0.71 was higher than the long to short account ratio of 0.47. High position ratios and low account ratios indicate that longs are concentrated in fewer, larger accounts, while shorts are spread over more accounts.
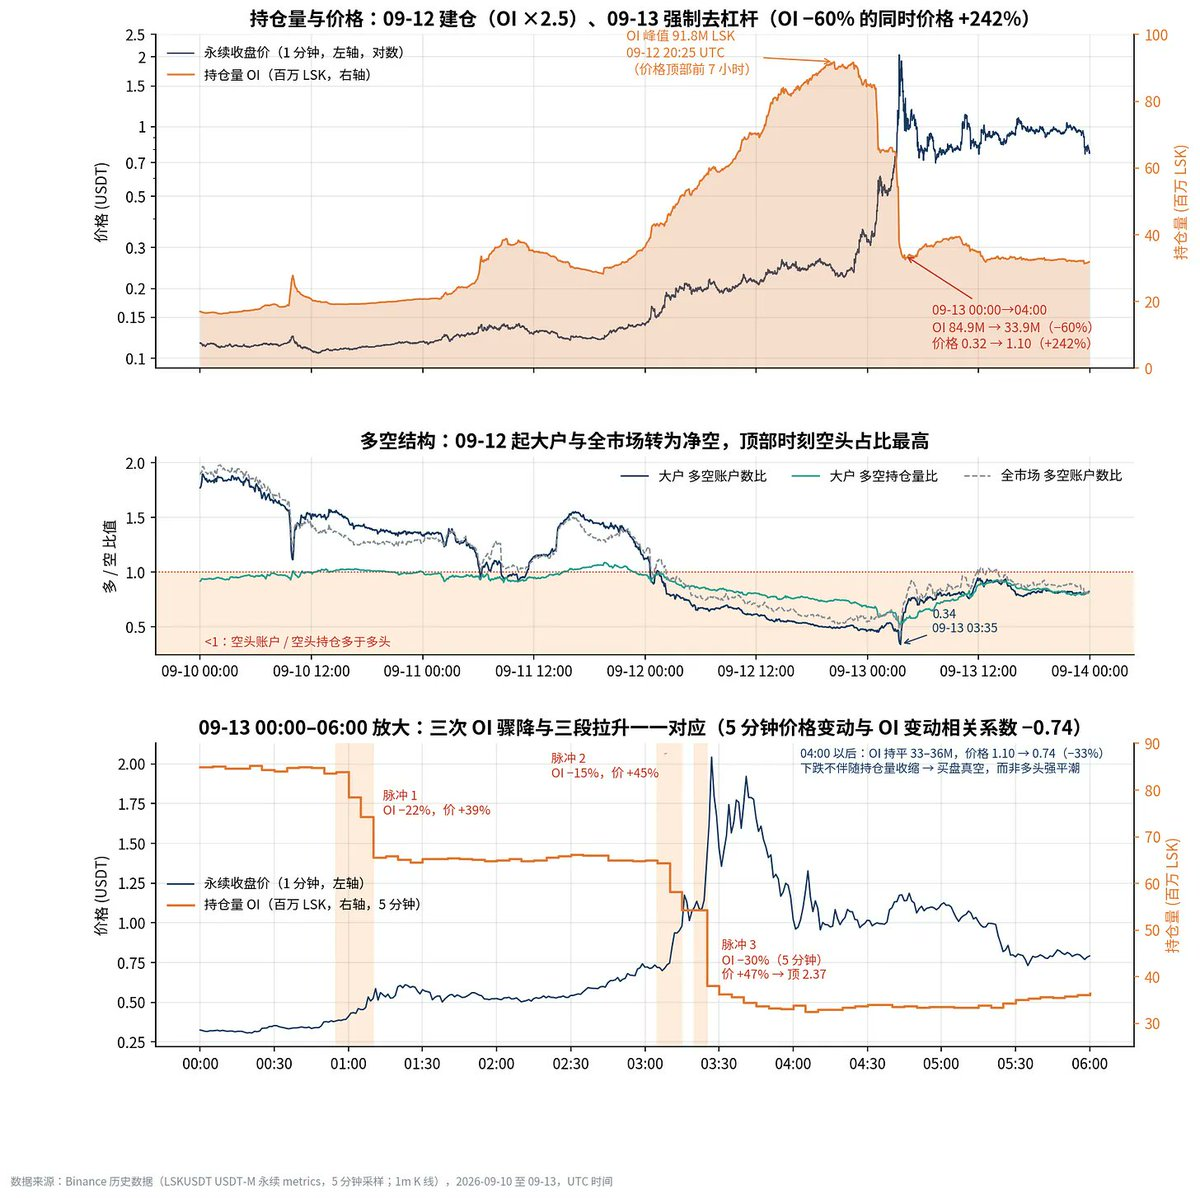
Figure 6|Top: Closing price and positions of perpetuals; Middle: Large trader long to short account ratio, large trader long to short position ratio, total market long to short account ratio, the shaded area indicates the majority are shorts; Bottom: Expanded view from 00:00 to 06:00 on September 13.
These shorts have a structural problem: they have no place to hedge. Shorting perpetuals while holding spot is a standard practice to lock in the basis—when perpetuals rise, the profit from spot can offset, and vice versa. But the daily trading volume of LSK spots is only 1/40 of that of perpetuals; on the 12th, perpetual trading was $973 million, while spot was $23 million. Shorting accounts couldn't possibly buy the corresponding amount of LSK on the spot side. They are naked shorts.
How does a naked short’s story generally develop?
First, after rising so much, how is that possible? They place a margin to open a position;
Second, someone takes the opposite side, pushing up the order book, their margin gets wiped out, and the exchange closes their position at the current price—shorts are closed out, which means the exchange bought it back for them;
Third, where to buy? They can only buy back in the perpetual market, causing the price to rise further.
The answer to the fourth layer: On the night of the 12th, there were 2:1 short accounts pressing on a market with only two to three hundred thousand dollars in order book depth.
The following question is not whether the price will rise/fall, but when the first batch of margins will bottom out.
5. The Actors are Ready, the Show Begins: Three Batches of Positions Sequentially Taken Away
From 00:00 to 03:00 on the 13th, the price increased by +21%, +33%, +42%, +56% in four hours. The positions dropped from 84.9 million LSK to 38 million at 03:25. During this time, the price increased by +242%, while the positions decreased by -60%, with a correlation of -0.74 between 5-minute price changes and position changes.
As the price rose, the positions contracted, and there is only one explanation: shorts were buying back/covering. Buying back pushes up the price while reducing positions. Three stages of price increases correspond to three sharp declines in positions, each one-to-one correspondence.
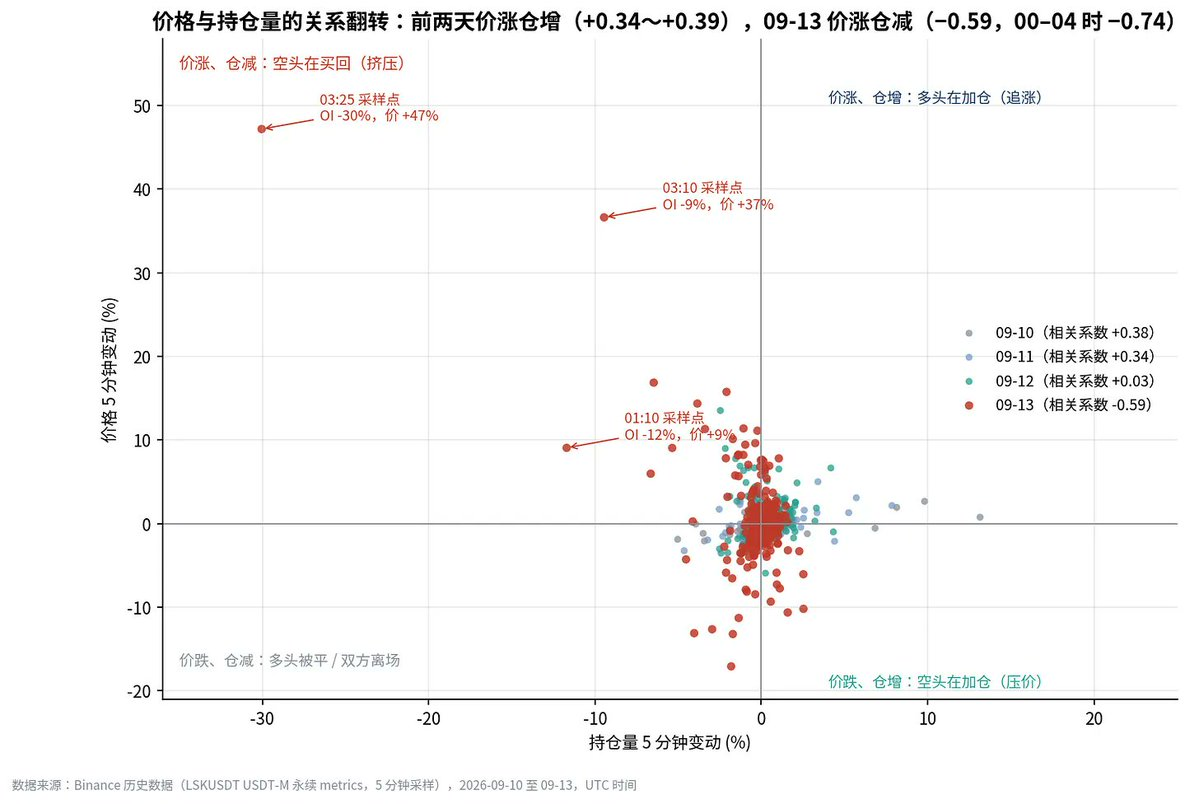
First test, from 00:57 to 01:12. Positions decreased by 22%, and the price rose from 0.395 to 0.549. At 01:08 and 01:11, there were two 1-minute candlesticks of +14% and +12%, with minute trading volumes of $15 million to $21 million.
Second assault, from 03:11 to 03:17. Positions decreased by 15%, and the price rose from 0.737 to 1.066. At 03:11, one minute trades amounted to $24.6 million, 184,570 transactions, with a 57% active buy ratio. The order book at 03:12:31 showed: within 1% sell orders were $405,000, and buy orders were $21,000—there was a selling wall above, but almost a vacuum below. The key moment was at 03:14:26 when a market buy order for 218,132 LSK was placed at @1.00, breaking through 443 orders, pulling down the selling wall at the whole number $1.00. By 03:18, perpetual was at 1.01, spot at 1.29, with a 21.6% discount for perpetuals: spot led the way, but perpetuals were pressed below the whole number by the shorts.
Third total assault, from 03:21 to 03:27. Positions decreased by 30%, with 16.3 million LSK disappearing. From 03:25 to 03:27, there were three 1-minute candlesticks of +20.9%, +18.0%, +25.9%, with 226,919 transactions in one minute at 03:27, about 3,800 transactions per second. 75 seconds before the peak, the perpetual price surged from 1.62 to 2.37, with active buying accounting for 60%–77%, while spot only reached 1.78, with perpetuals trading at a 33% premium.
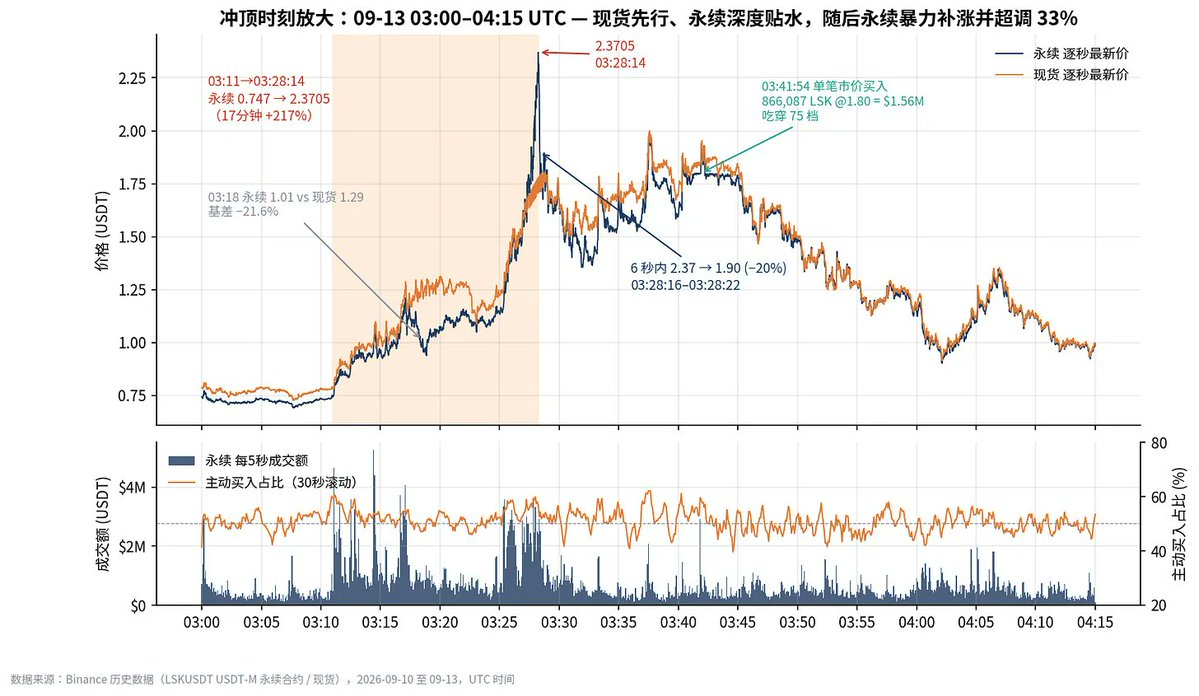
Figure 7|From 03:00 to 04:15 UTC on September 13, per-second prices (perpetual vs spot), every 5 seconds trading volume, and 30 seconds rolling active buying proportion. The orange segment is the price surge from 03:11 to 03:28:14.
The buyback of 16.3 million LSK ($1.69) at the time of position contraction had an implied price of about $27.6 million, an astronomical figure directly impacting a market with a ±1% depth of only two to three hundred thousand dollars. A price surge of 47% was inevitable.
To help readers better understand, the simplified chain of events is as follows:
Contract price rises → Shorts floating losses → Margin gets breached → Exchange buys back at market price → Breaking through multiple layers of selling walls → Price suddenly shoots up → The next batch of shorts gets squeezed - and so on.
Every time the circle turns, the order book gets thinner, but the momentum of the forced covering remains unchanged, and the next time it can only push higher.
Where was the selling wall (opposite side) at that time?
1.00 (443 orders, $218,000), 1.60 (445,212 LSK, $712,000), 1.80 (866,087 LSK, $1.56 million, 75 orders), 2.00 (03:37:32 at the same millisecond two orders, 131 orders, and 91 orders), 2.20 (73 orders)—the largest orders over the four days were all single market buy orders at whole numbers, occurring between 03:14 and 03:44.
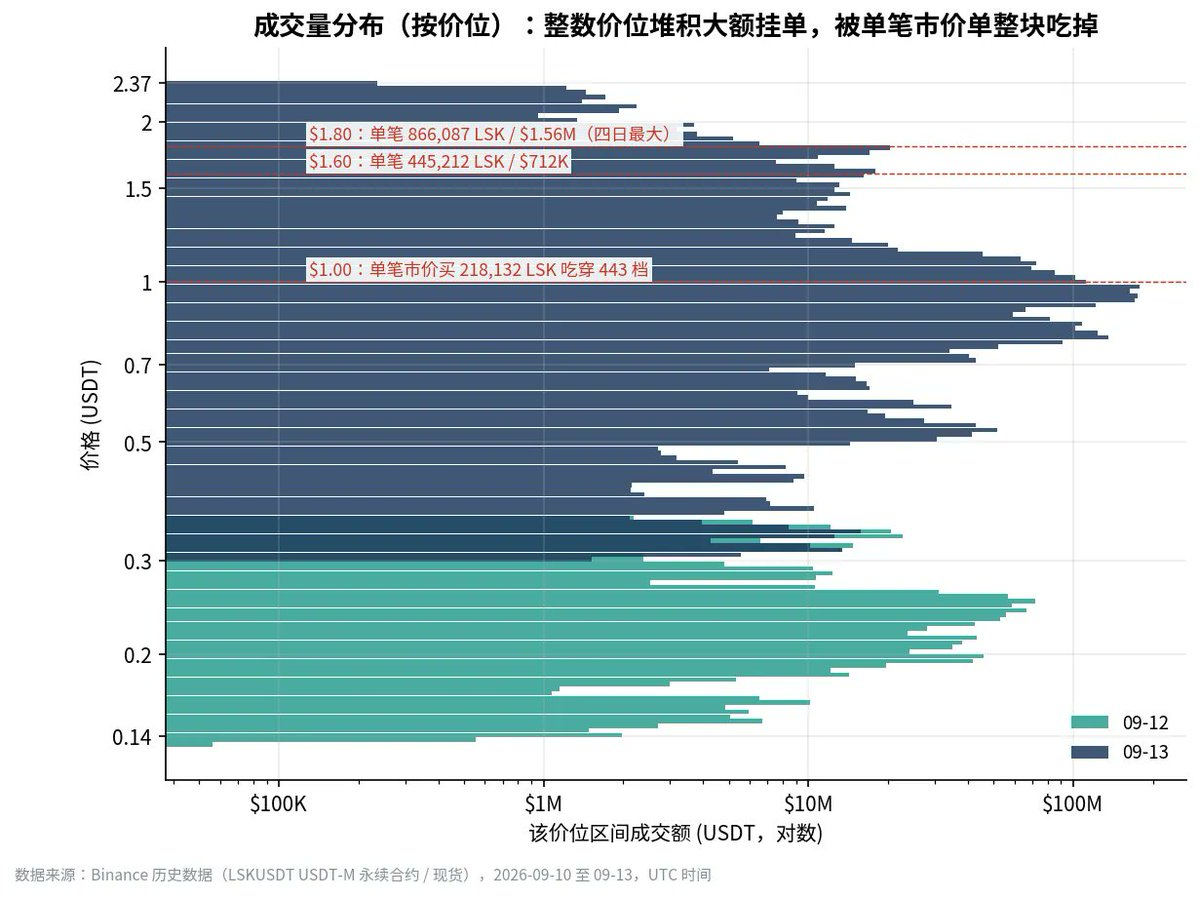
Figure 8|Trading volume statistics by price level (September 12, 13), with red lines indicating integer price levels that were completely absorbed by single market buy orders.
Returning to the initial question: Who funded the 20-fold increase?
It was the exchange buying for the liquidated shorts—they are the main force behind the 20x. There were buy orders—initially, active buys accounted for 77% in the first 75 seconds, followed by those whose margins bottomed out and were forced to execute buy-to-cover orders.
Four days of net active buying at 1.9% and the 77% active buying in that one minute at 03:27 are two aspects of the same thing: the last 17 minutes’ buyers were reluctantly pushed in.
6. After the Charge to the Top
At 03:28:14–15, the price reached 2.3705.
At 03:28:16, the proportion of active buys dropped to 23%. Five seconds later, at 03:28:21, the single-second transaction volume was $785,000, with 68% active selling. Six seconds later, it fell from 2.37 back to 1.90. According to the snapshot from 03:28:31: there was only $8,077 within the 1% buy orders.
After this rollercoaster charge, there was not a single buyer within the order book.
In the two hours where it dropped from 1.10 to 0.74, the positions remained stable at 33 million to 36 million. The drop was not accompanied by a contraction in positions—over the hill, finding no one waiting. Shorts cleared out before 04:00, while the remaining positions on both sides did not exit due to the absence of buy orders. The large trader long to short account ratio returned from 0.34 at 03:35 to 0.76 at 05:00: after the shorts exited, the number of long and short accounts approached equilibrium again. In two hours, it retracted 69% from the peak.
Also mention a counterintuitive point: From 03:28 to 06:00 during these 150 minutes, the price dropped by -67%, yet the net active buying in perpetuals was +6.84 million dollars, was it to prevent the candlestick from free falling? Or were there people coming in to pick up bargains? We do not know.
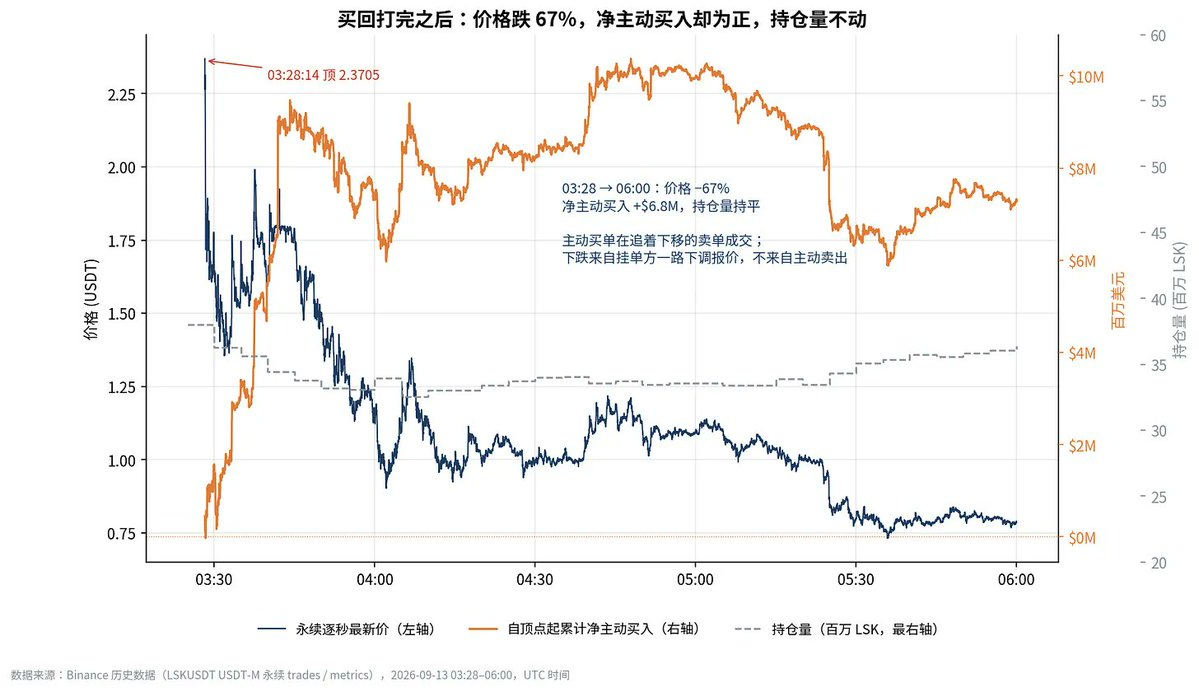
But from the data, the decline was not caused by active sell orders hitting the market; instead, the quotes were pushed down continuously on one side of the order book, with active buy orders following down to execute. Then the question arises, who is using limit orders to sell? How to sell?
Answer: To clear positions, they can only raise the negative funding rate (short pays long), attracting buy orders to enter the order book, step by step clearing.
Conclusion
In four days, $4.3 billion in trading volume, prices rose from 0.116 to 2.37, with net active buying only at 1.9%.
The buyers were not in the trades. Amid a cluster of small orders placing orders based on dollar amounts, turning over the same batch of positions nearly a hundred times a day; a thin order book that was 9.6 times its own posted orders; and the two-to-one ratio of shorts created on the night of the 12th, without holding any coins, paying margins at prices as low as thirty cents.
免责声明:本文章仅代表作者个人观点,不代表本平台的立场和观点。本文章仅供信息分享,不构成对任何人的任何投资建议。用户与作者之间的任何争议,与本平台无关。如网页中刊载的文章或图片涉及侵权,请提供相关的权利证明和身份证明发送邮件到support@aicoin.com,本平台相关工作人员将会进行核查。


