If we look merely at trading volume, Polymarket's first half resembles a platform competition; if we combine wallets, market categories, and settlement results, the story becomes closer to a division of labor chart: Polymarket's US market is growing rapidly, with the sports and crypto markets facilitating quick capital flow, while retail users bear most of the profit and loss volatility.
Written by: Surf
Key Findings
The following conclusions are based on 787 million transactions in Polymarket's international market from January to June 2026, along with 1,733,011 wallets, combined with venue-level data from Polymarket US.
- The second Polymarket is rapidly increasing: the monthly trading volume of the CFTC-regulated US market rose from 5% of the international market in January to 47% in June, reaching 67% in July.
- High-turnover categories are the fee engines: sports and crypto markets contributed approximately 98% of the $184 million in gross fees generated by the international market in the first half; the crypto market generated $96.3 million in fees with about half the volume, exceeding the sports market's $83.5 million.
- User numbers and trading volumes are highly misaligned: retail wallets make up about 90% of users, but robots and professional users together contribute roughly 80% of taker trading volume; only accounting for 5.9%, robot wallets completed about two-thirds of the transactions.
- Attracting new users is not dependent on a single blockbuster: the largest single leading market in the first half brought in less than 7,000 new wallets, while the total of new wallets was around 1.13 million; in any given month, the top 15 leading markets accounted for only 8%—19% of that month's new wallets.
- No single market category has significantly raised platform retention rates: approximately 51%—57% of monthly active wallets return the following month, but users often leave the initial category they entered in favor of other categories on the platform.
- The robot group overall is profitable, but the median is still at a loss: the robot sample achieved approximately $108 million in net profit, but only 27% of wallets were profitable; among about 1.75 million wallets, only 146 wallets maintained positive cash flow for six consecutive months.
Part One: A Panorama of the Two Polymarket Markets
Polymarket US: The Second Market is Taking Shape
In the first half of 2026, Polymarket effectively became two trading venues, yet discussions mostly focus on just one. The international market, catering to non-US users, continues to operate on a Polygon-based off-chain CLOB, achieving a unilateral trading volume of $17.9 billion over six months; meanwhile, Polymarket US, which launched at the end of 2025 and is regulated by the CFTC, climbed from 5% of January's international market monthly volume to 47% in June, reaching 67% in July (approximately $2 billion vs. $3 billion).
Both markets share branding and basic order book mechanisms but do not share order books, user bases, or revenue structures. Like Kalshi, they use off-chain matching and a centralized limit order book, and apply the same fee curve for takers, which changes with the price: fee = Θ·C·p(1−p). The difference lies in the settlement track: the international market publicly settles each transaction on Polygon, while the US market clears through a private, regulated ledger.
When comparing across platforms, it is essential to standardize definitions first. The volume referenced here indicates unilateral taker-side trading dollars, counted once; nominal amounts and bilateral counting usually exceed 2—3 times this figure. Recapping the July data under this definition, the common figures $41 billion/$7 billion/$5 billion correspond to about $13.3 billion/$3 billion/$2 billion.
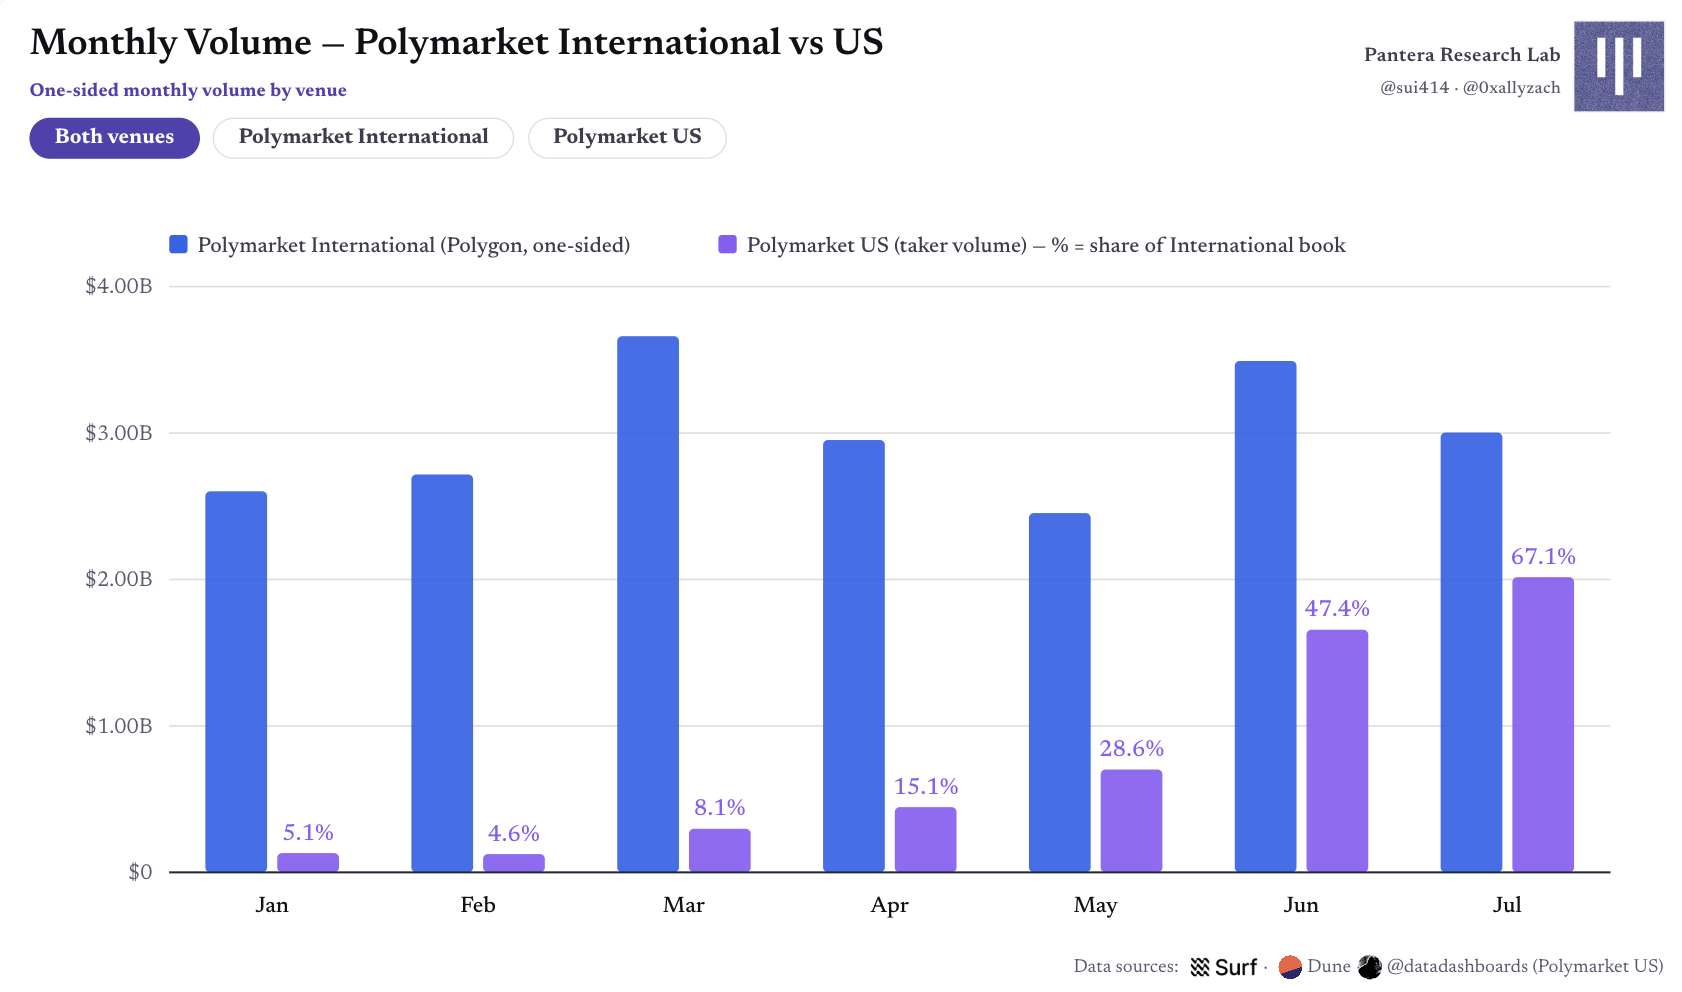
Figure 1 | Monthly unilateral trading volume of Polymarket's international and US markets
The daily trading volume of the US market grew from around $1 million in the early days to $50 million—$100 million by July; daily transaction counts surpassed 1 million, and the open interest once exceeded $150 million. The fee structure shifted from a fixed basis point model in January to a price-sensitive formula initiated in April.
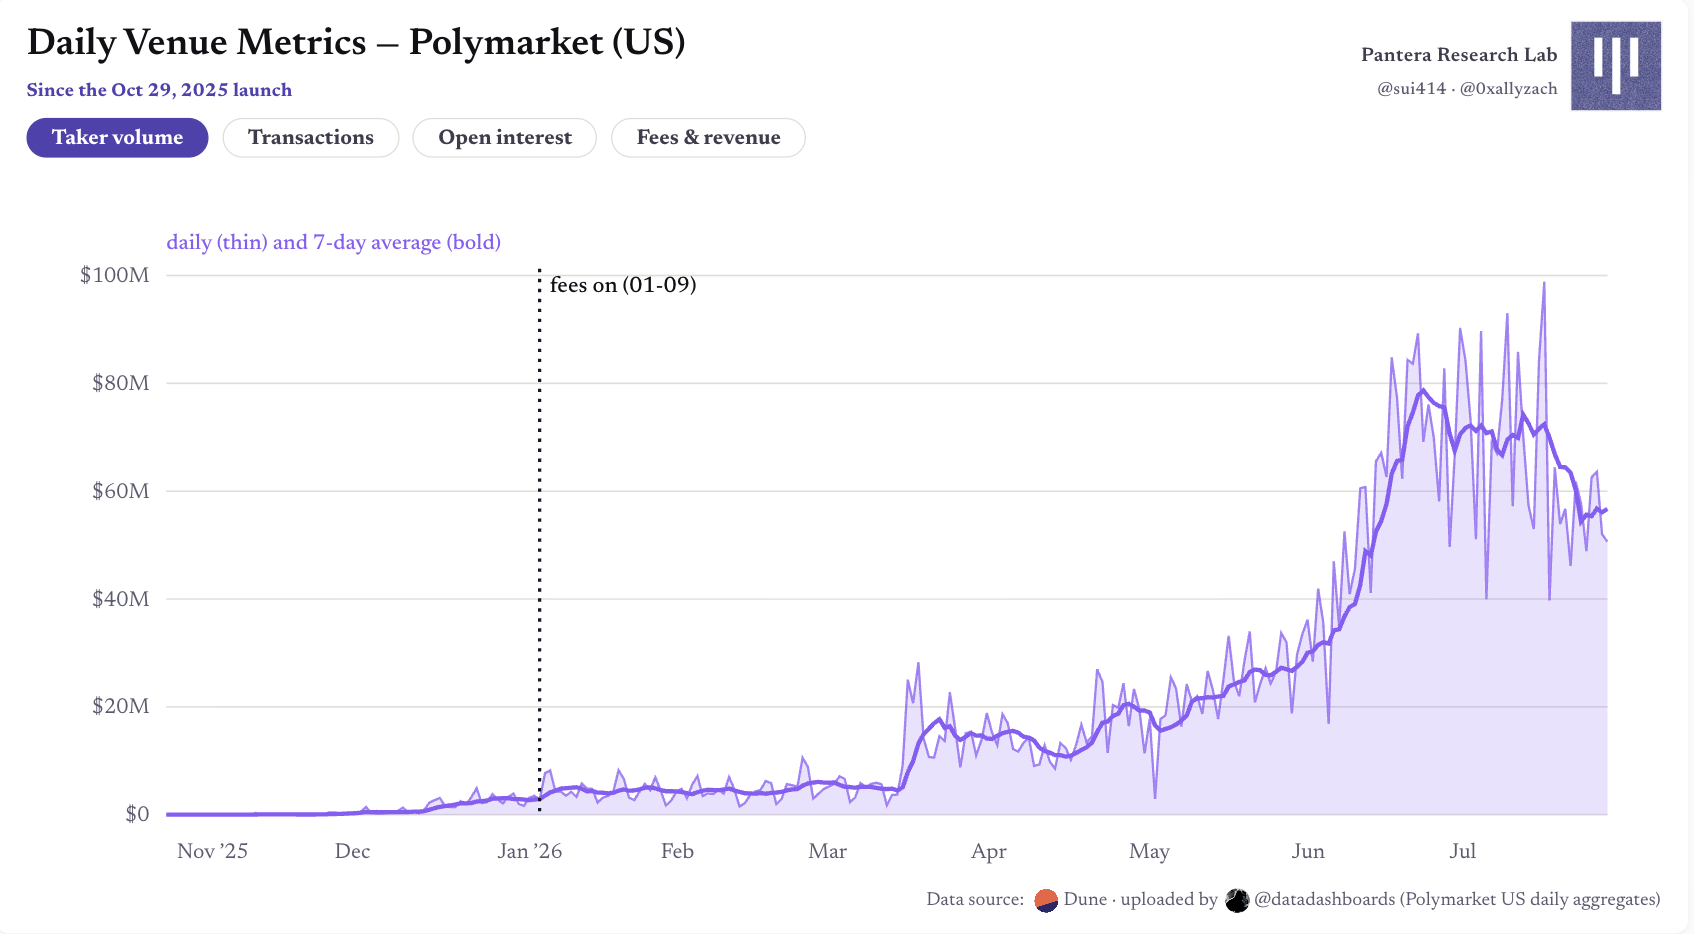
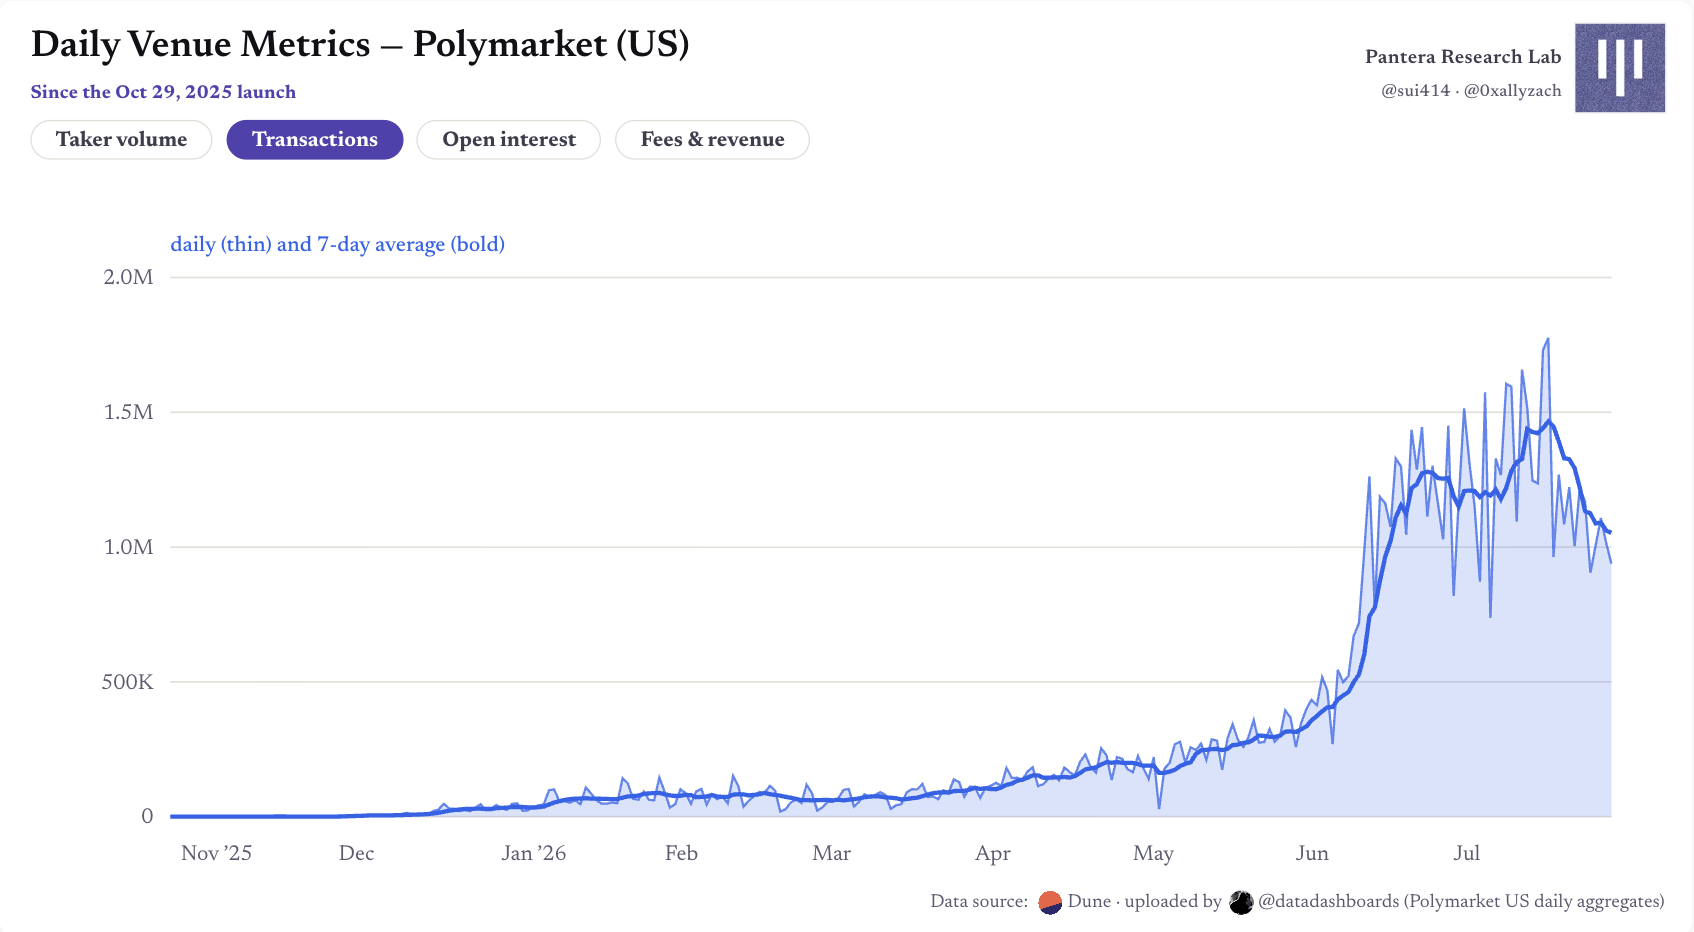
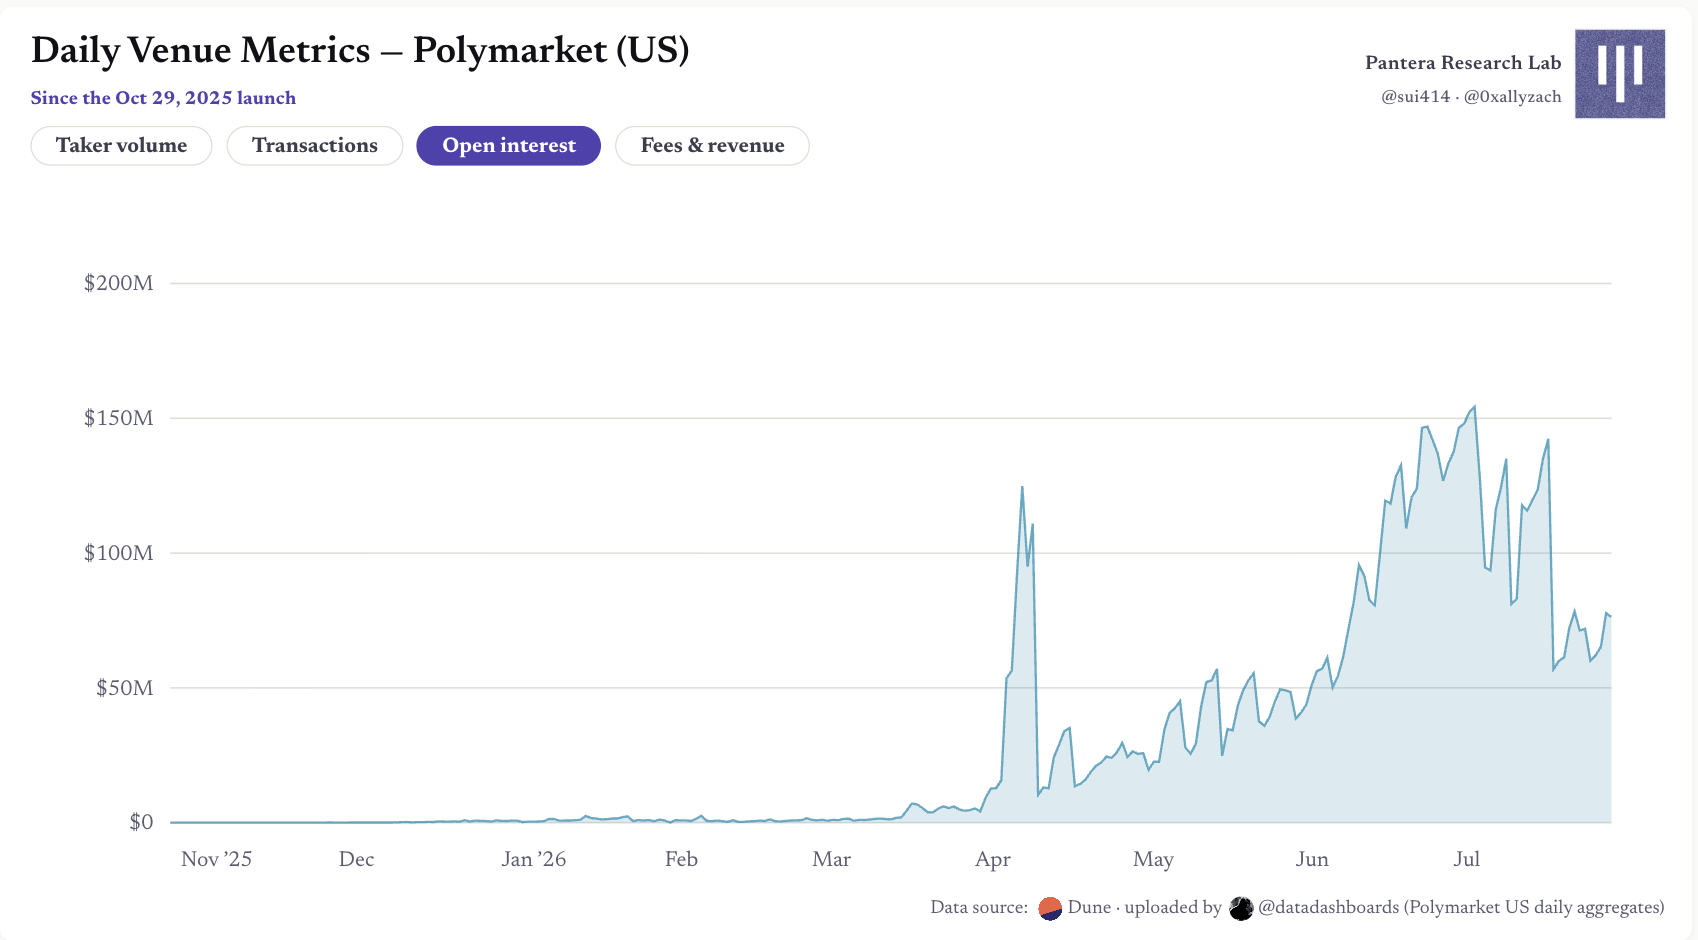
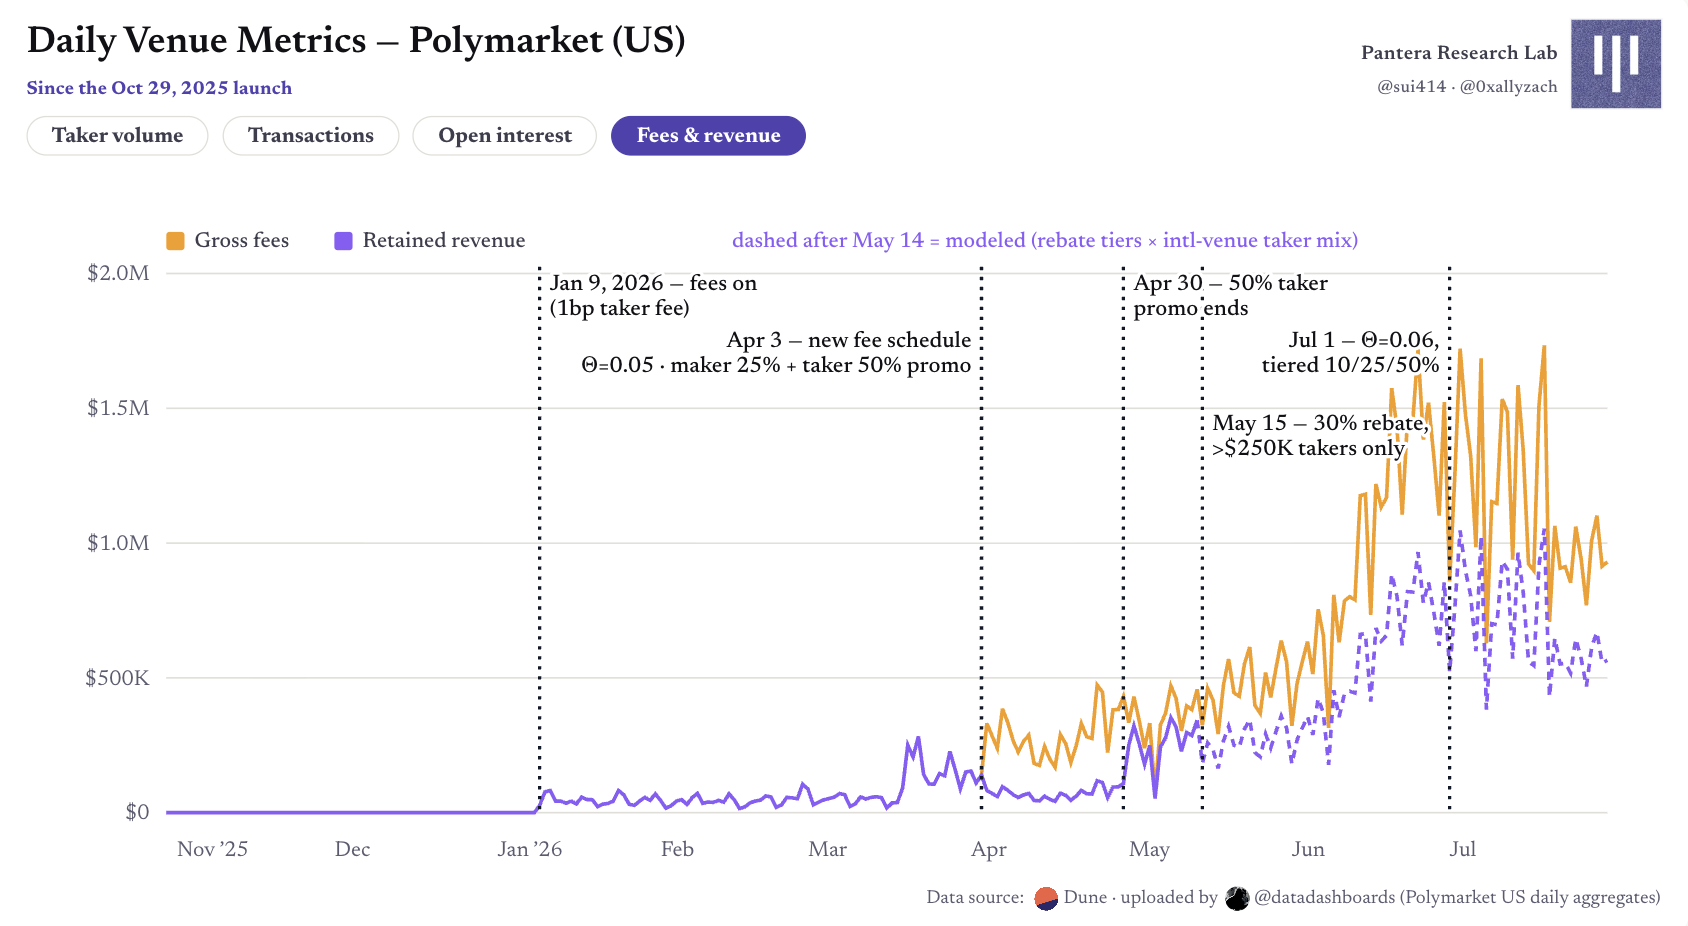
Figure 2 | Polymarket US: Daily venue-level metrics since launch
The scale of fees was also larger than the community datasets estimated: in June alone, taker gross fees were approximately $30 million. Based on the official rebate program estimates—25% returned to makers upon execution, with an all-taker promotional rebate ending on April 30, followed by layered rebates based on trading volume—June's retained revenue was around $17 million, roughly double the fixed 25% assumption adopted by many trackers. Since there is no user-level data in the US market, the layered qualifications for large takers can only refer to the 0.3% top-tier takers in the international market, who contribute approximately 63% of trading volume.
The Fee Economics of the International Market
What is actually being traded in the international market? Sports accounts for about half of the total trading volume; crypto about 30%, with the vast majority being five-minute level up and down micro-markets; and world/geopolitical events account for about 15%. There are even more significant concentration differences among the categories: the largest sports market accounts for only 0.27% of its category, whereas in the science and technology category, a market titled "Will the US confirm the existence of aliens before 2027?" occupies about one-fourth.
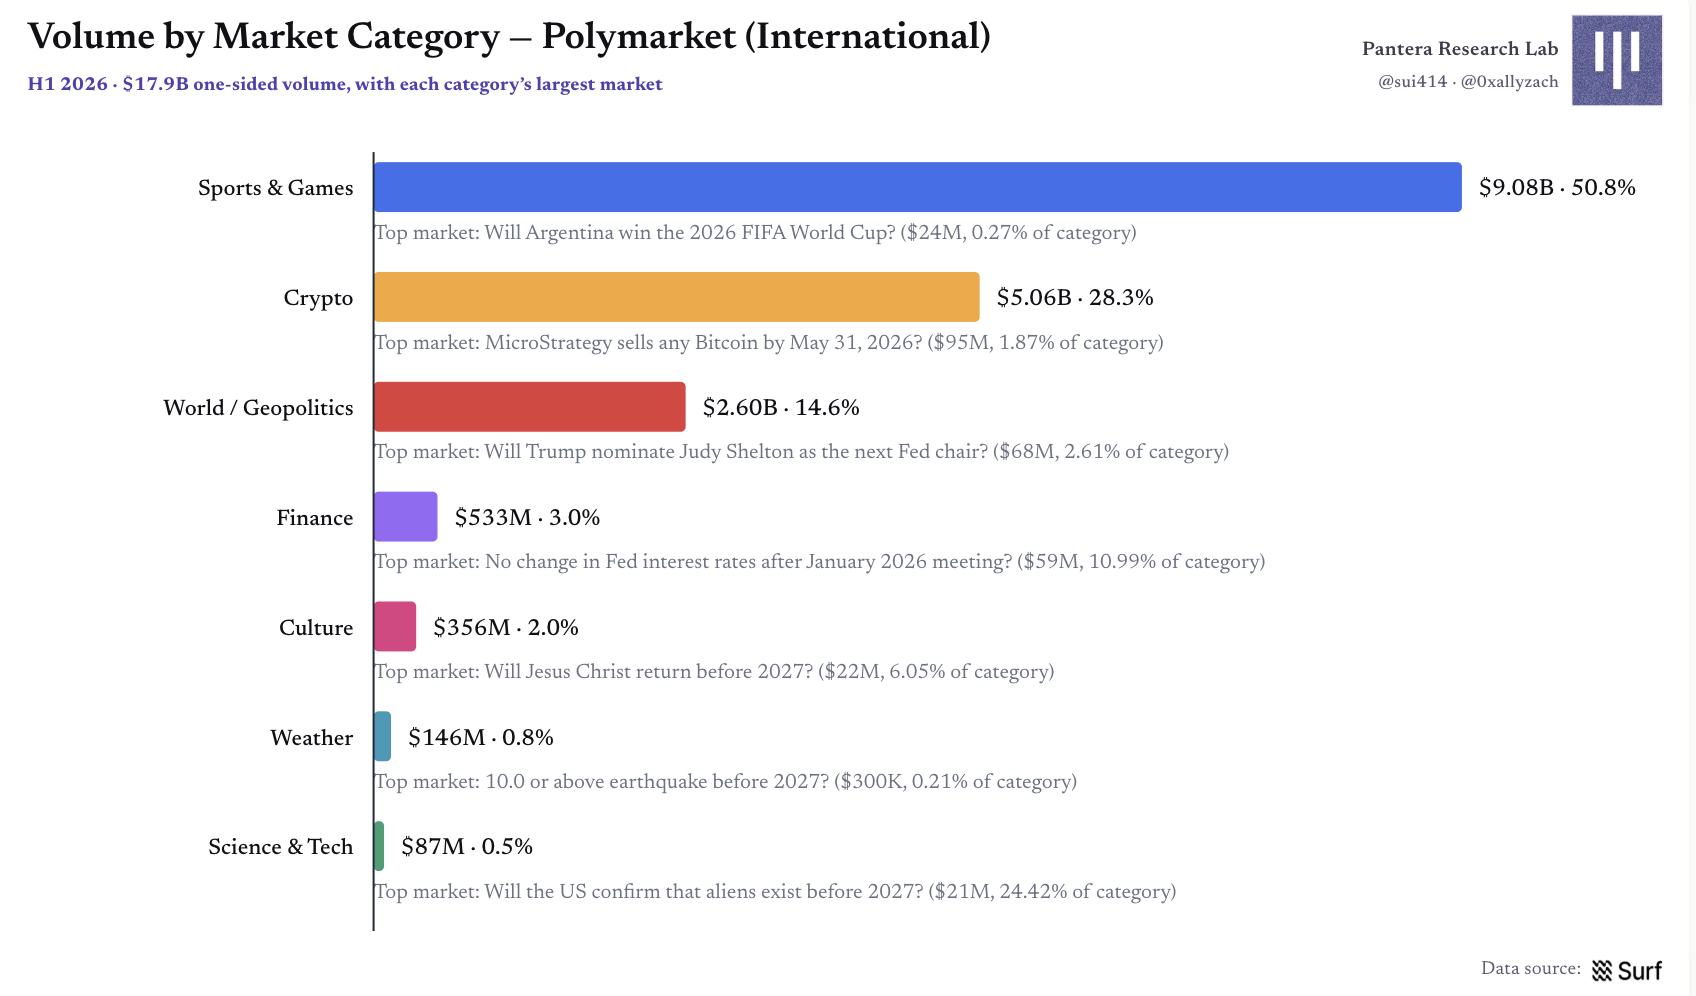
Figure 3 | Polymarket International Market: Volume breakdown by market category
The international market generated approximately $184 million in gross fees in the first half, but this does not account for the net income after maker rebates and incentives. Although the crypto market had only about half the trading volume of sports, it generated $96.3 million in fees, surpassing sports' $83.5 million; the two categories combined accounted for 98% of total fees. The world/geopolitical category adopted a deliberate zero-fee strategy.
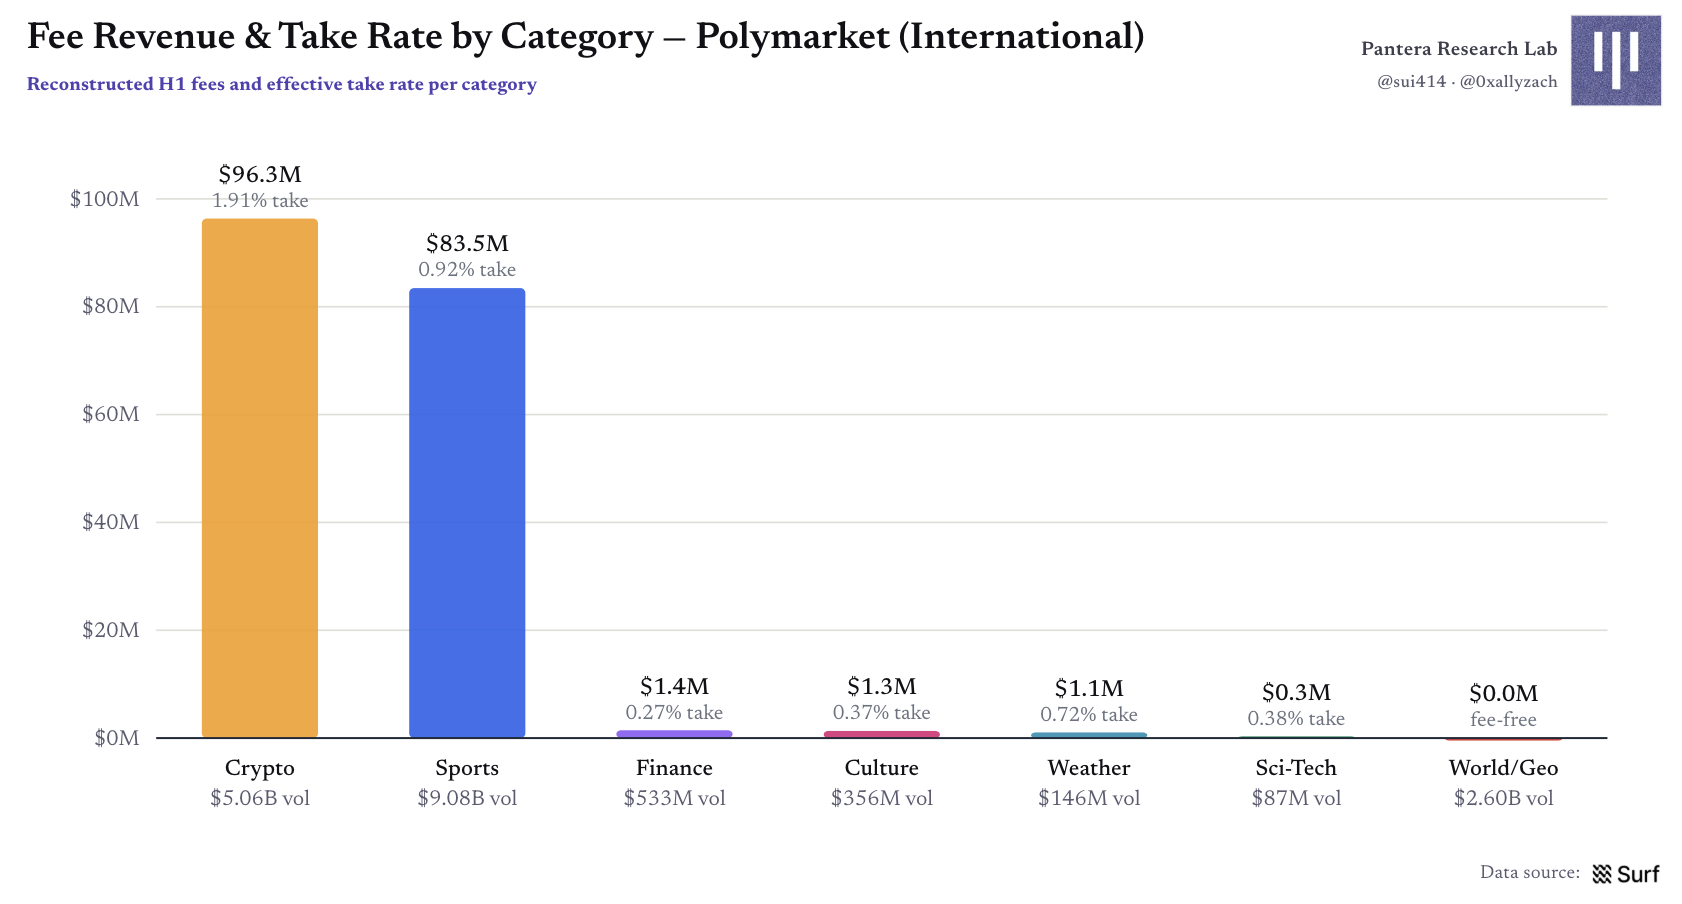
Figure 4 | Polymarket International Market: Fee revenue and effective take rate by category
High-turnover categories are the fee engines
In July, Kalshi's open interest was about 2.3 times that of Polymarket's international market, but its trading volume was about 4.4 times; the corresponding daily turnover rate was approximately 0.44× compared to 0.23×. Polymarket US had the smallest capital pool, yet it ran the fastest with a daily turnover rate of about 0.64×. The answer lies not in the platform name, but in the composition of the market catalog.
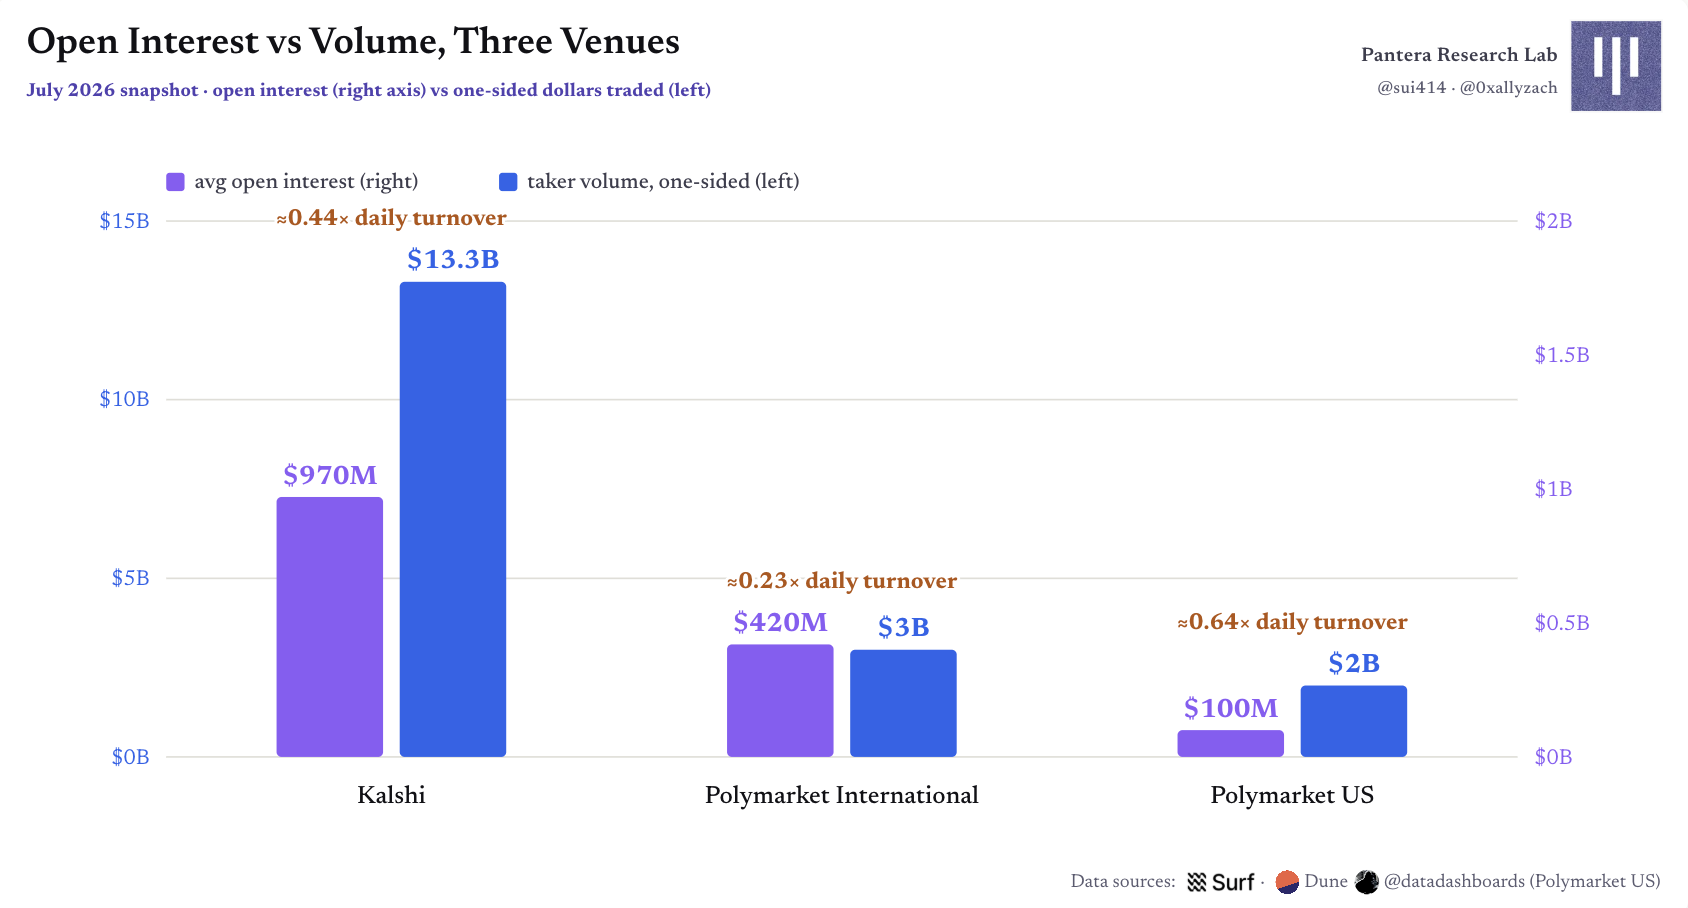
Figure 5 | Open interest and trading volume comparisons among the three markets: capital size does not equal capital turnover
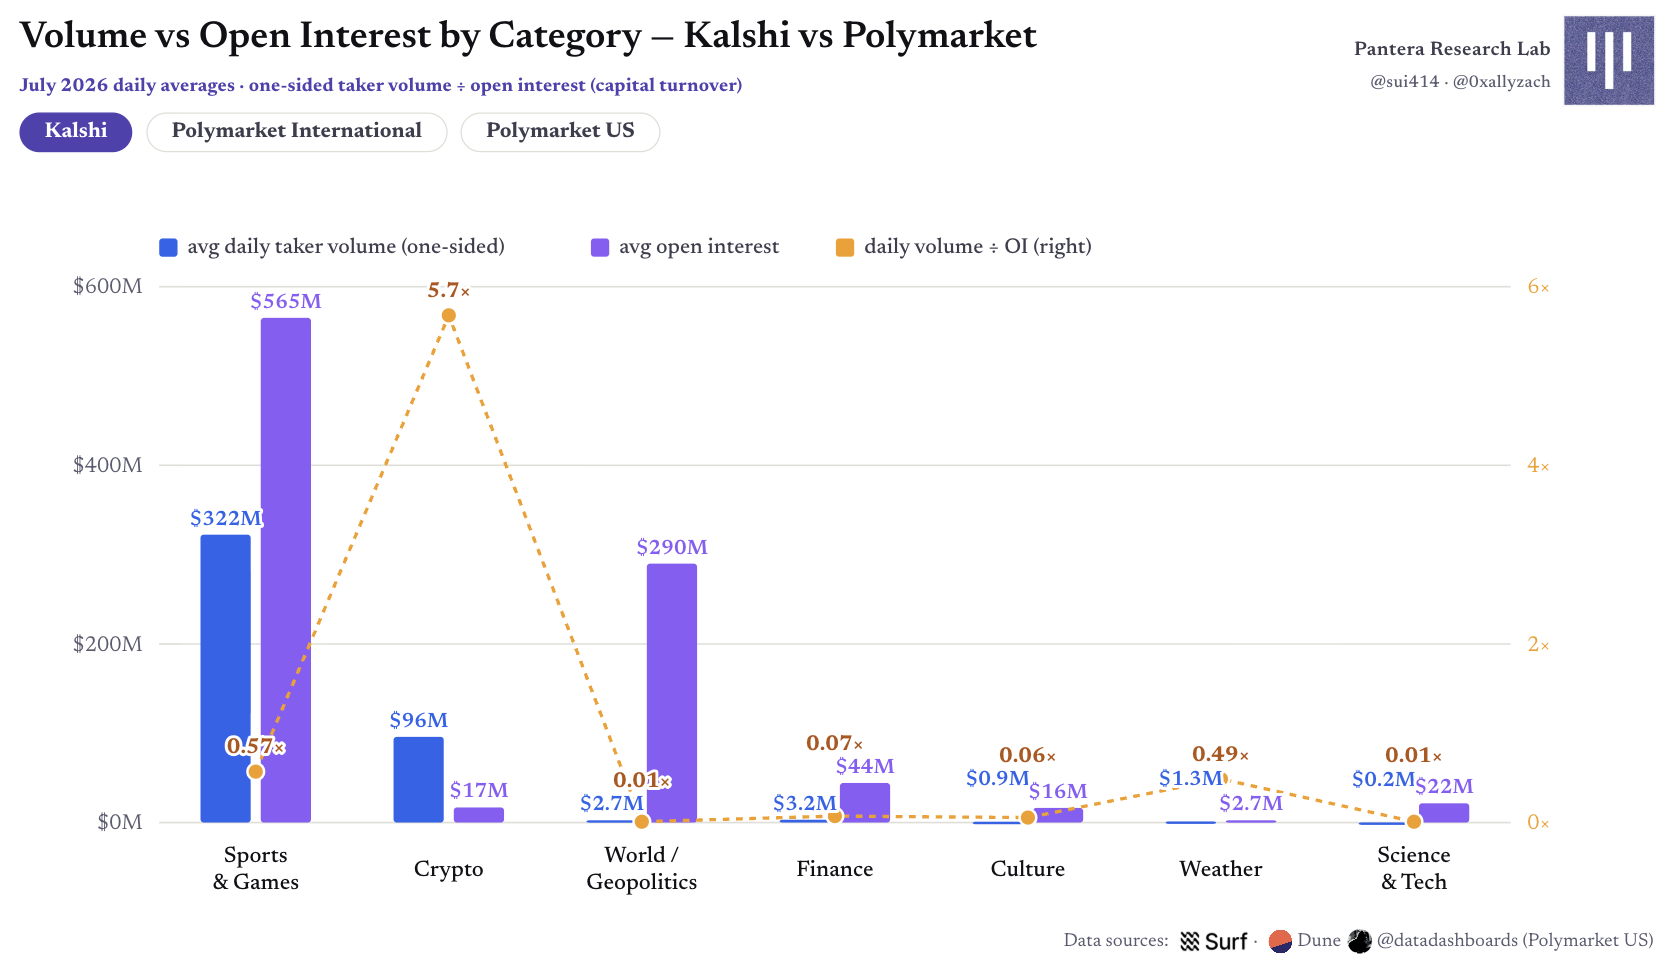
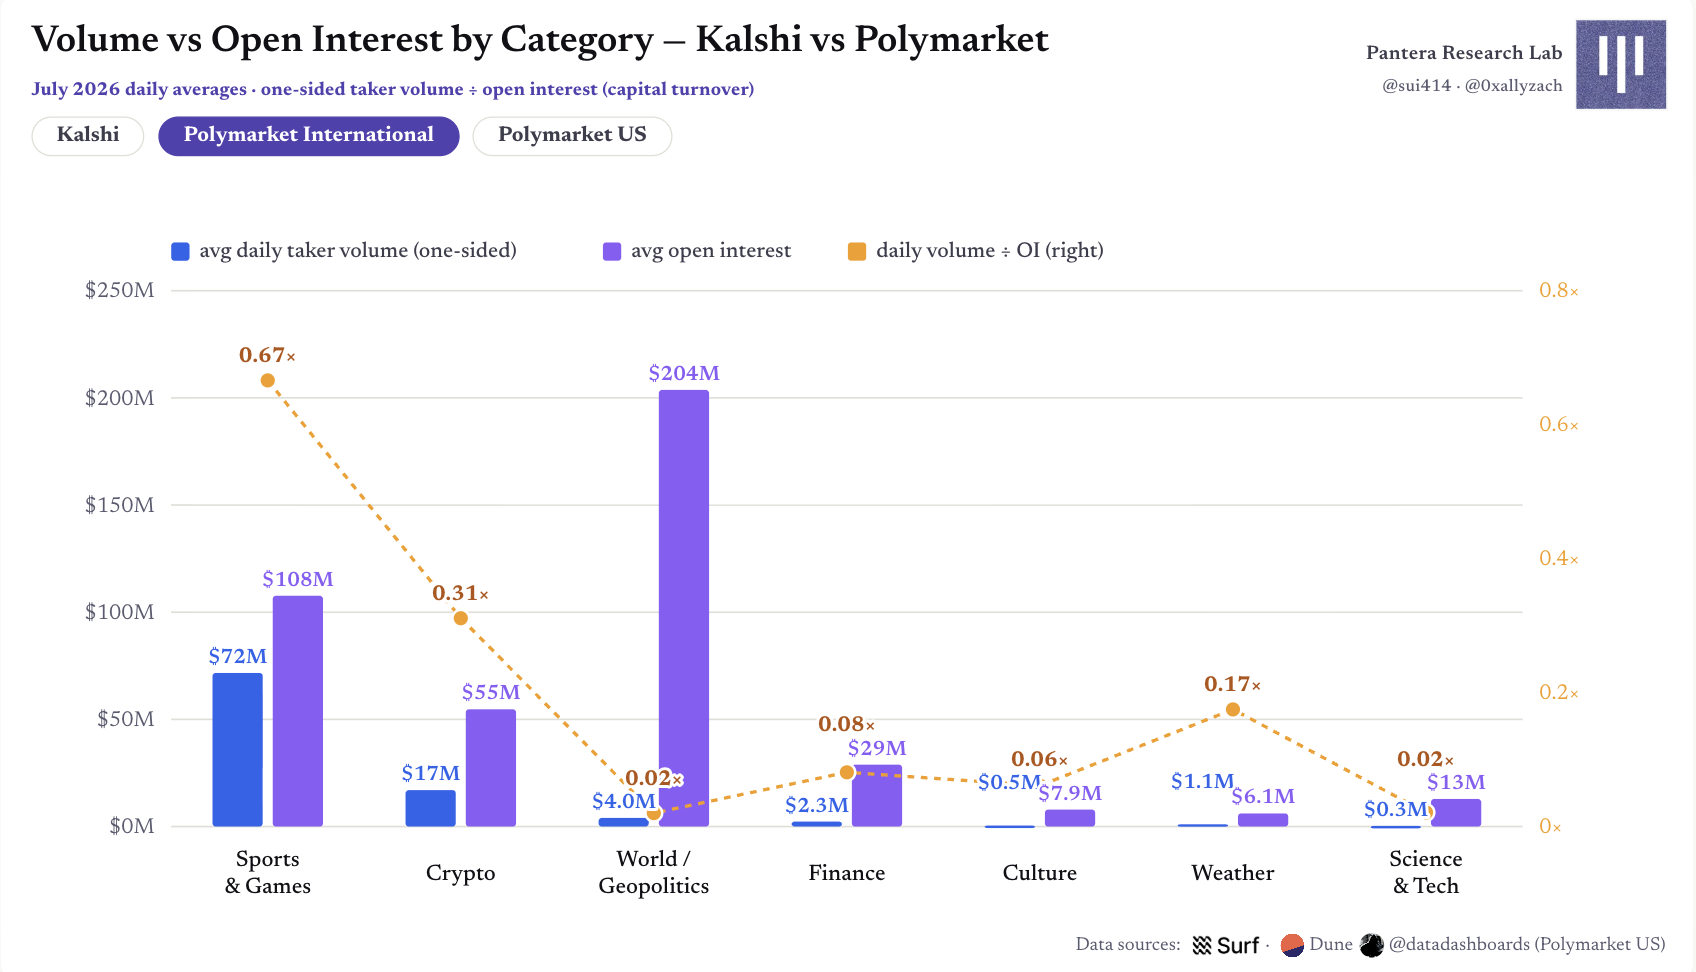
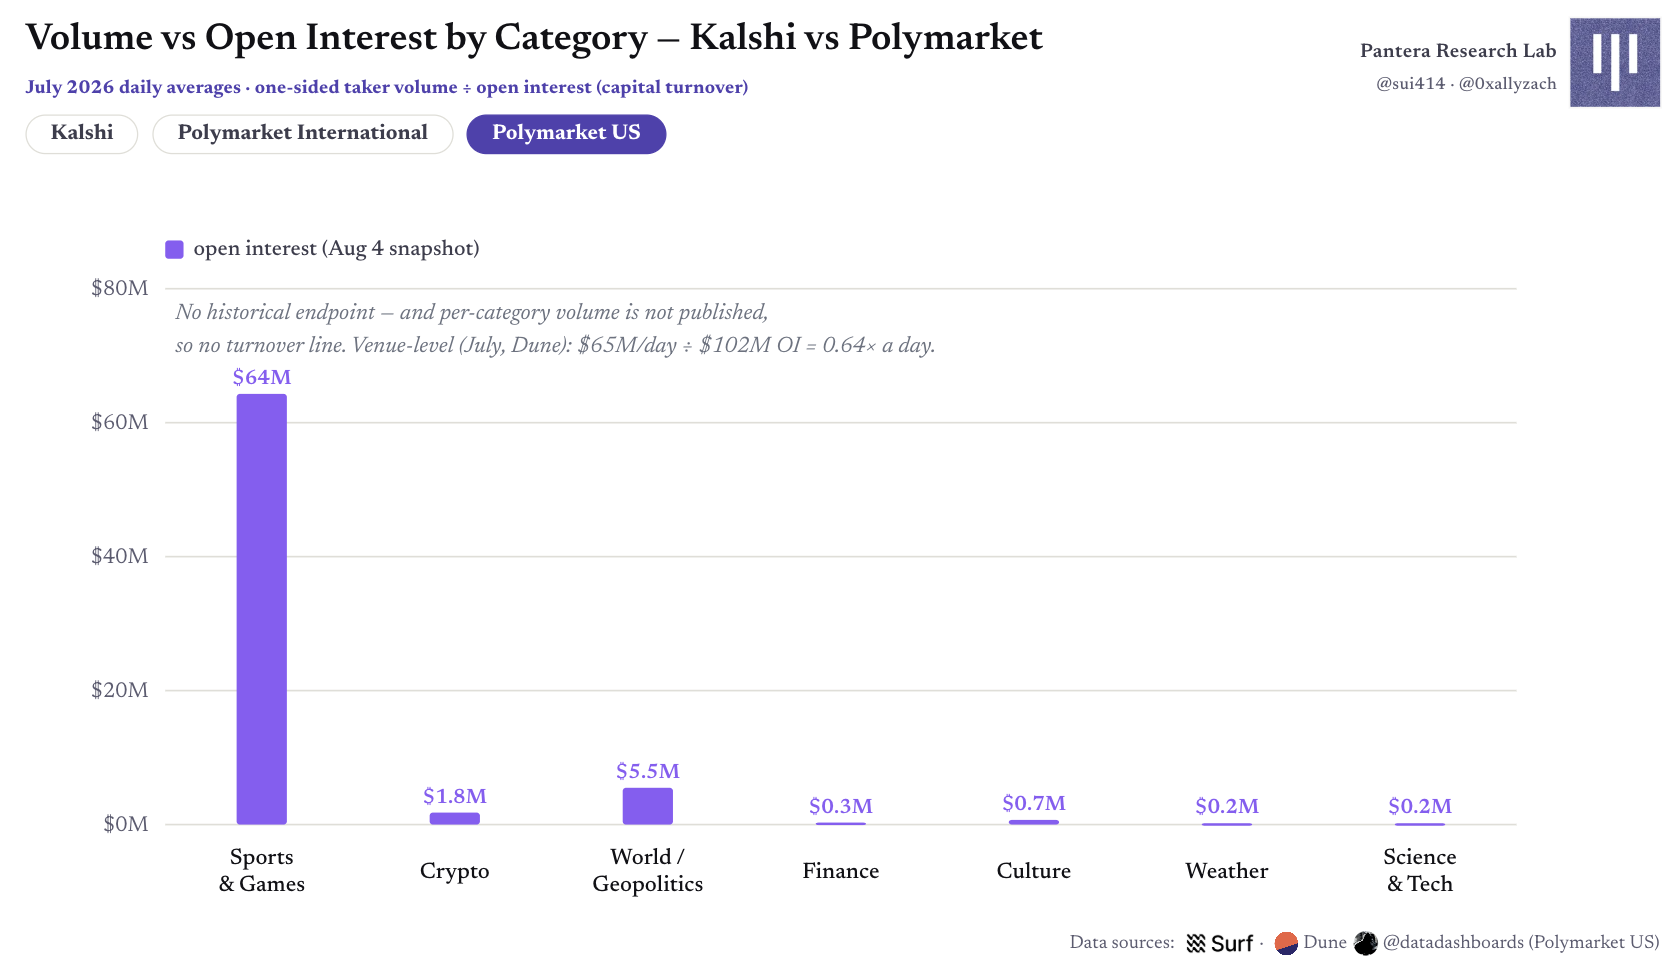
Figure 6 | Comparing Kalshi and Polymarket trading volume/open interest by category
Sports and crypto are the fastest-moving categories, while world/geopolitical events are the slowest, with daily turnovers of only about 0.01—0.03×. Each of the two international markets has about $200 million—$300 million trapped in capital, yet only generates $2 million—$3 million in daily trades, which is why they have set this category to zero fees. Approximately 88% of Polymarket US's open interest is concentrated in sports, explaining why it can achieve a higher turnover with less capital.
Kalshi's crypto market is a significant outlier: about $17 million in open interest corresponds to around $96 million in daily trading, with a daily turnover nearing 6×, where 98% of the market's duration is no longer than one hour. Polymarket's crypto turnover seems to only be 0.31× because the long-dated threshold markets hold most of the open interest, while the five-minute up and down markets make up about 90% of trading volume but do not lock much capital; on average, each of these markets only locks about $2,800 in collateral.
The same category tends to show similar speeds across different platforms: sports turnover rates are approximately 0.57×, 0.67×, and 0.64× for Kalshi, Polymarket's international market, and Polymarket US, respectively. This reflects category attributes rather than platform attributes.
Part Two: User Growth in Polymarket's International Market
The following user analysis only covers Polygon CTF/NegRisk contracts in the international market, with a time frame from January 1, 2026, to June 30, 2026. Polymarket US and Kalshi settle on internal ledgers and the public trading flow has been anonymized, so it’s not possible to create equally deep wallet profiles.
Maker and Taker: The two sides of the order book are not the same group
In the first half, there were 1,733,011 wallets trading in the international market. Almost all wallets have eaten liquidity at least once, but fewer than half have ever placed a limit order. The maker side is noticeably more professional and smaller; the top 1,000 makers provided most of the static liquidity. The demand side is equally concentrated: about 6% of highly active wallets completed 80% of the taker trading volume, while one-third of wallets only traded five times or less over six months.
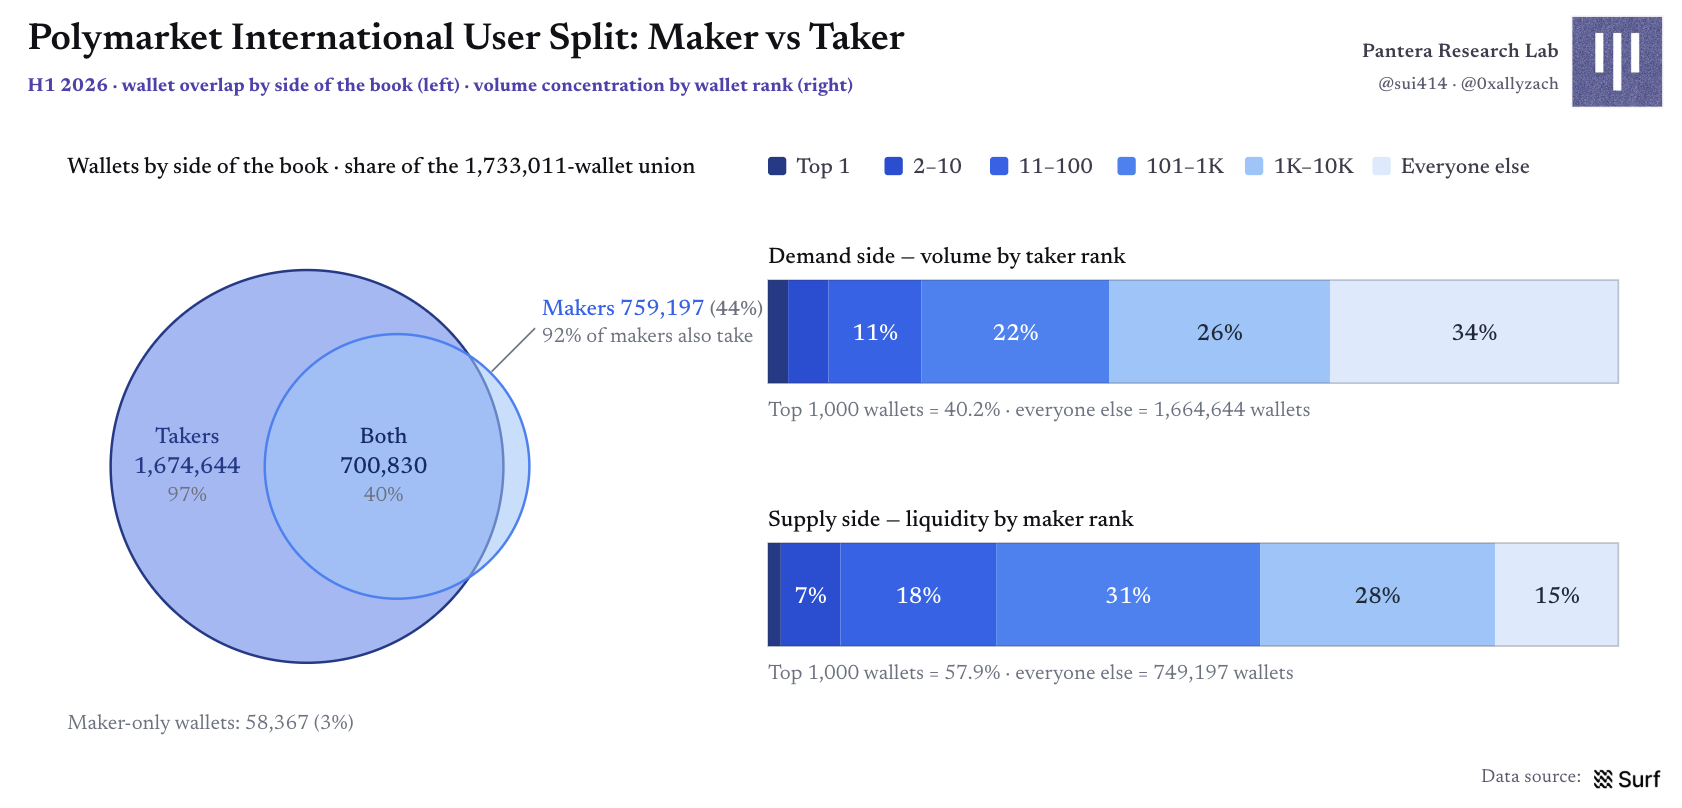
Figure 7 | Wallet structure in Polymarket's international market: Overlap and concentration of Makers and Takers
User Growth Accounting: Activity Almost Flat
User growth is even less optimistic than trading volume: monthly active wallets grew from 580,000 in January to 594,000 in June, showing basically flat growth, even though about 1.1 million wallets traded for the first time during the same period. Each month, 43%—49% of the active wallets from the previous month ceased trading, with a loss of 358,000 wallets in April, meaning the platform must continuously use new wallets and returning wallets to fill the funnel.
There are three important limitations here. Wallets are not equivalent to users; some of the so-called loss may simply be users switching to new wallets; and the churn referred to in this paper only indicates wallets stopping trading, not that accounts are closed or funds are no longer present.
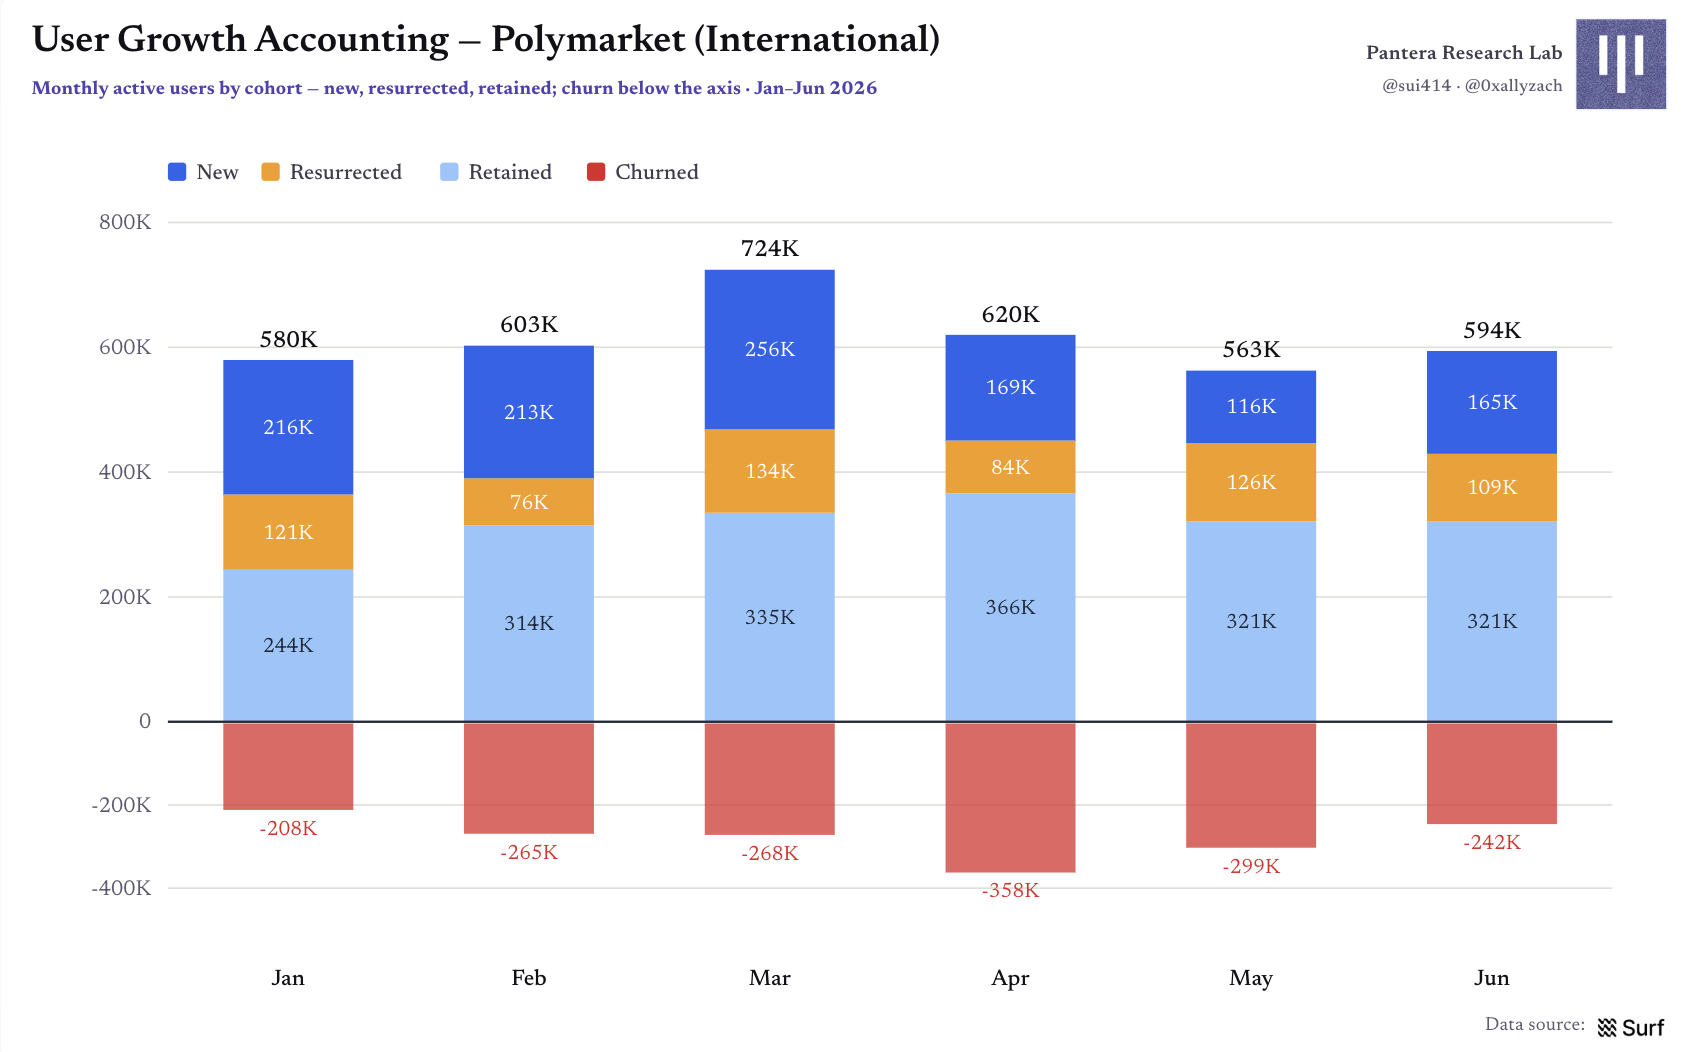
Figure 8 | User growth accounting: New users, returning users, retained users, and churn
Where new users come from: Not a single-point outbreak
When we attribute each new wallet to the market they first engaged with, we can see the seasonality of the new user acquisition: the crypto market peaked in March with about 99,000 new wallets, geopolitics peaked in January with about 68,000, and sports peaked in June with the start of the World Cup, bringing around 91,000 new wallets. Events create peaks but no single market is solely responsible for all new user acquisition.
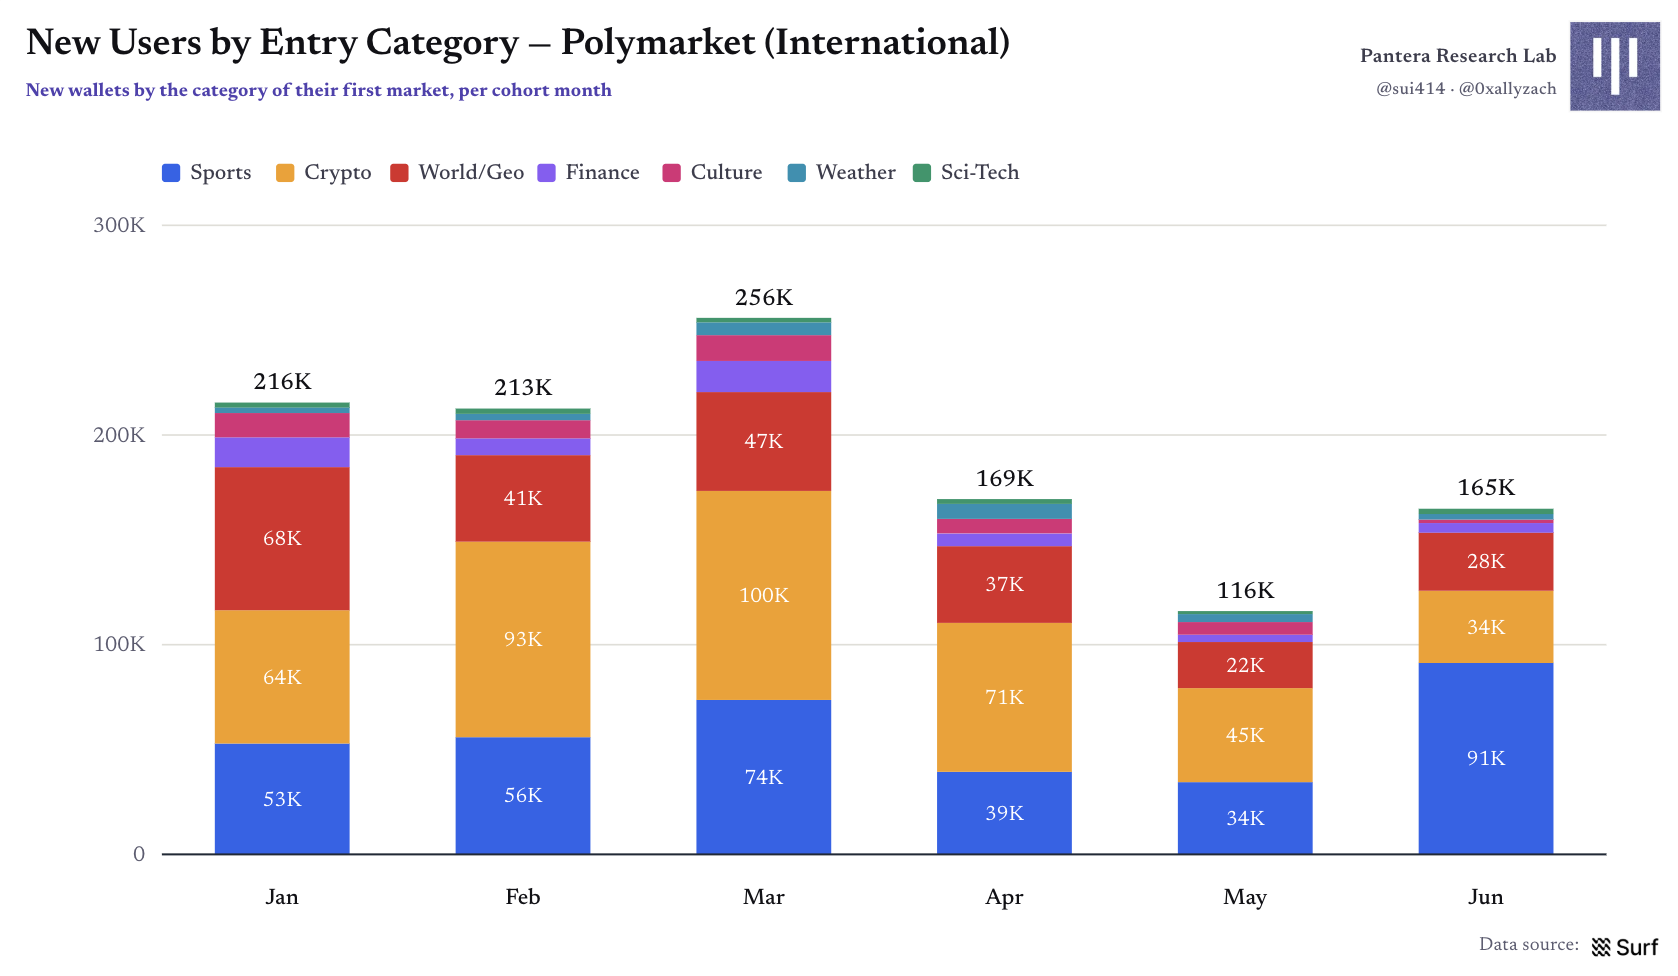
Figure 9 | New wallets counted by first entry category
The strongest single leading market in the first half was "Will China invade Taiwan by the end of 2026?" but it only brought in about 7,000 new wallets. The top ten comprised both geopolitics and events from the World Cup, interest rates, and cultural events, indicating that effective new user acquisition stems from a combination of markets rather than a single blockbuster.
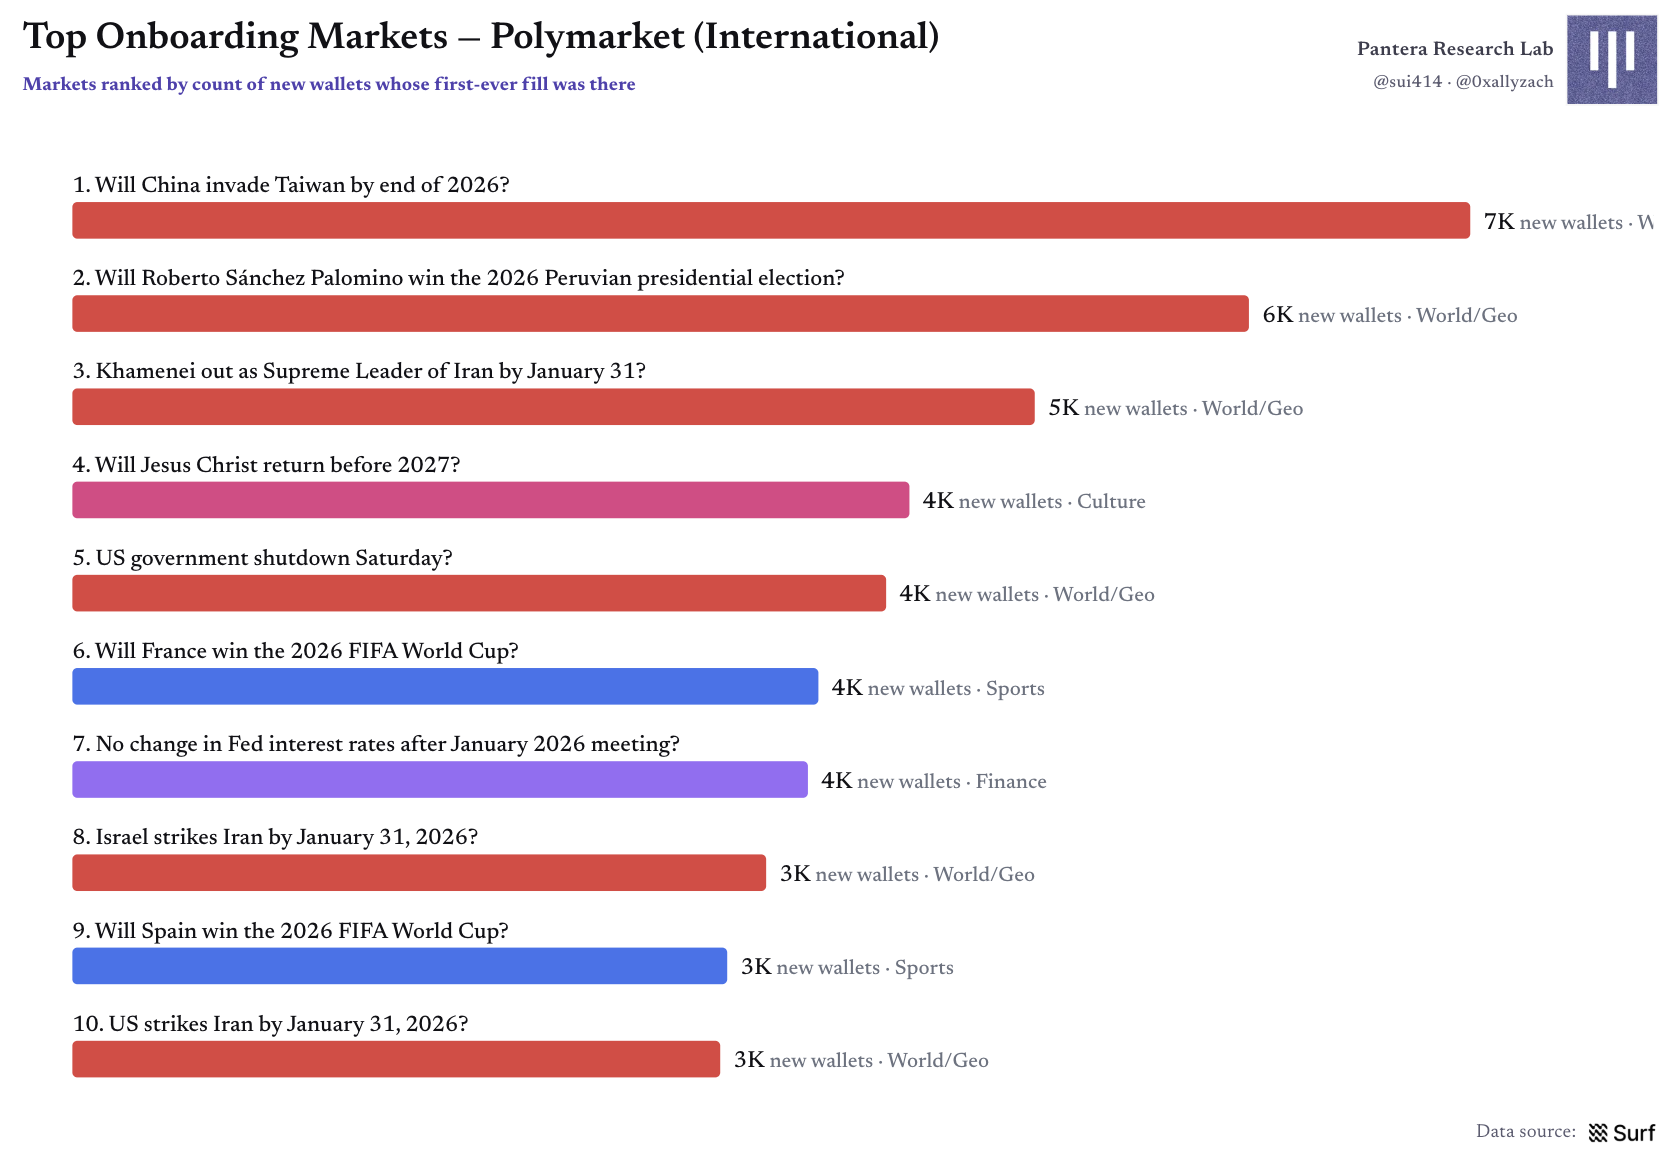
Figure 10 | Top ten leading markets for new wallets in the first half
On a monthly basis, the top 15 leading markets accounted for only 8%—19% of that month's new wallets, with the top market never exceeding about 3%. The highest concentration was in January and June, corresponding to news from Iran, the Taiwan market, and the World Cup.
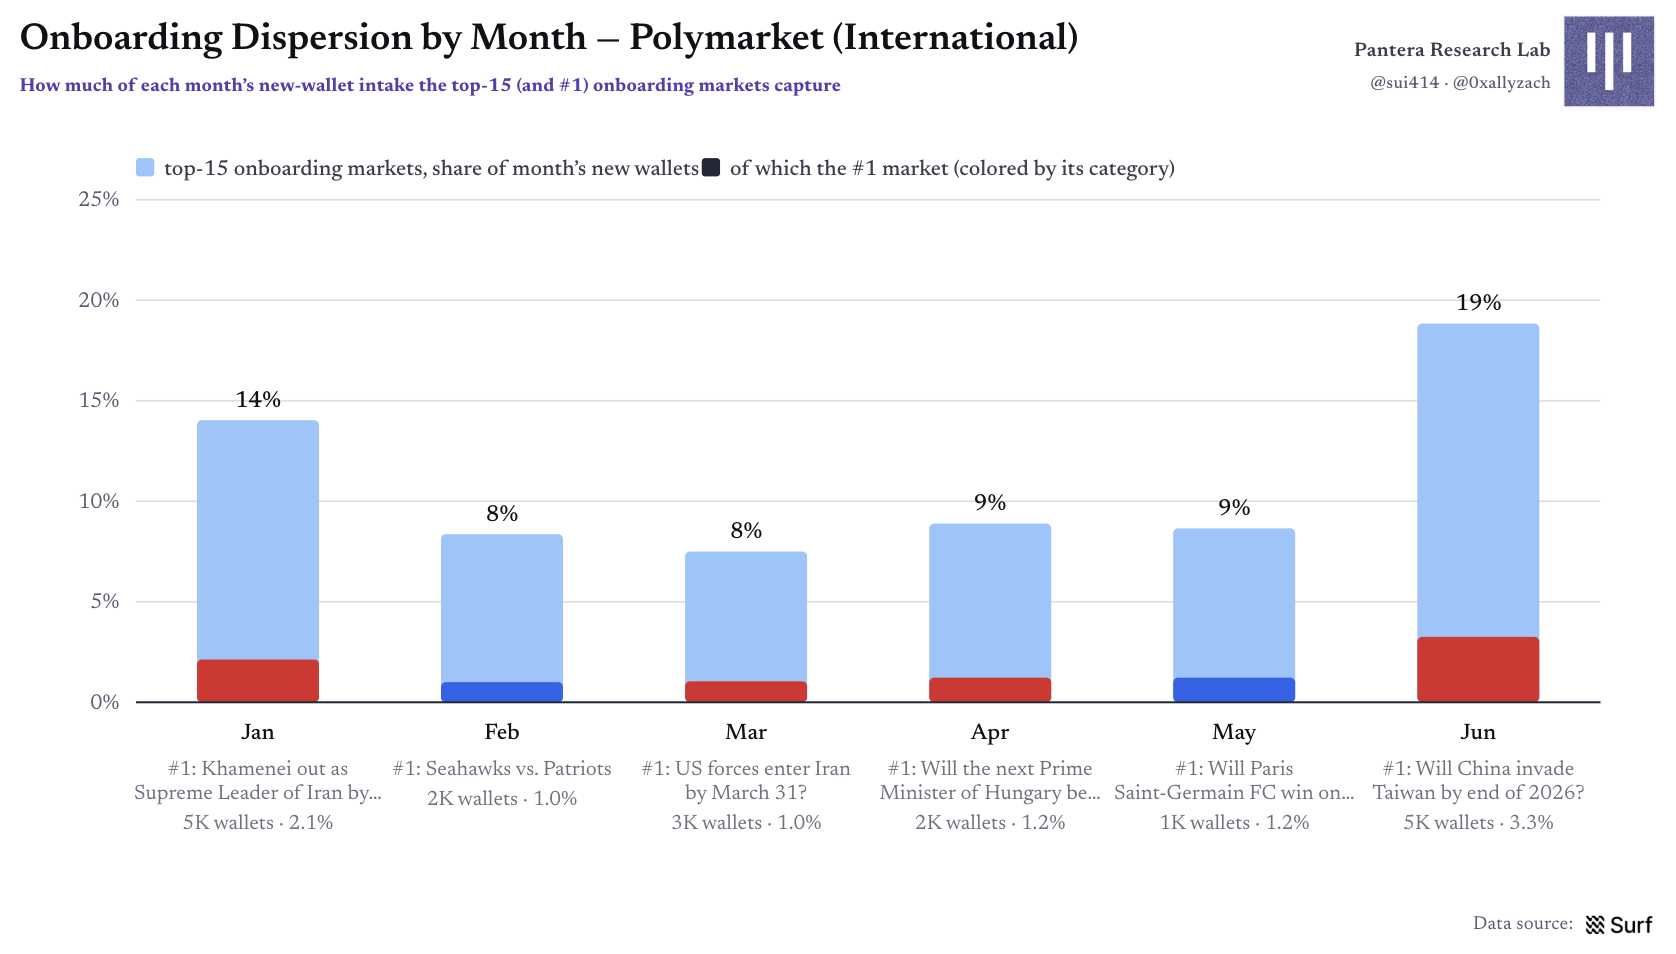
Figure 11 | Monthly New User Acquisition Distribution: Contributions of the top 15 markets and the top market
Retention: Users stay on the platform but not necessarily in the original category
About half of monthly active wallets return the following month, with platform monthly retention at roughly 51%—57%; however, loyalty to any particular category is notably weaker. Users may leave the category they first entered but reappear in another category, which suggests that cross-category recommendations and cross-selling may be at play.
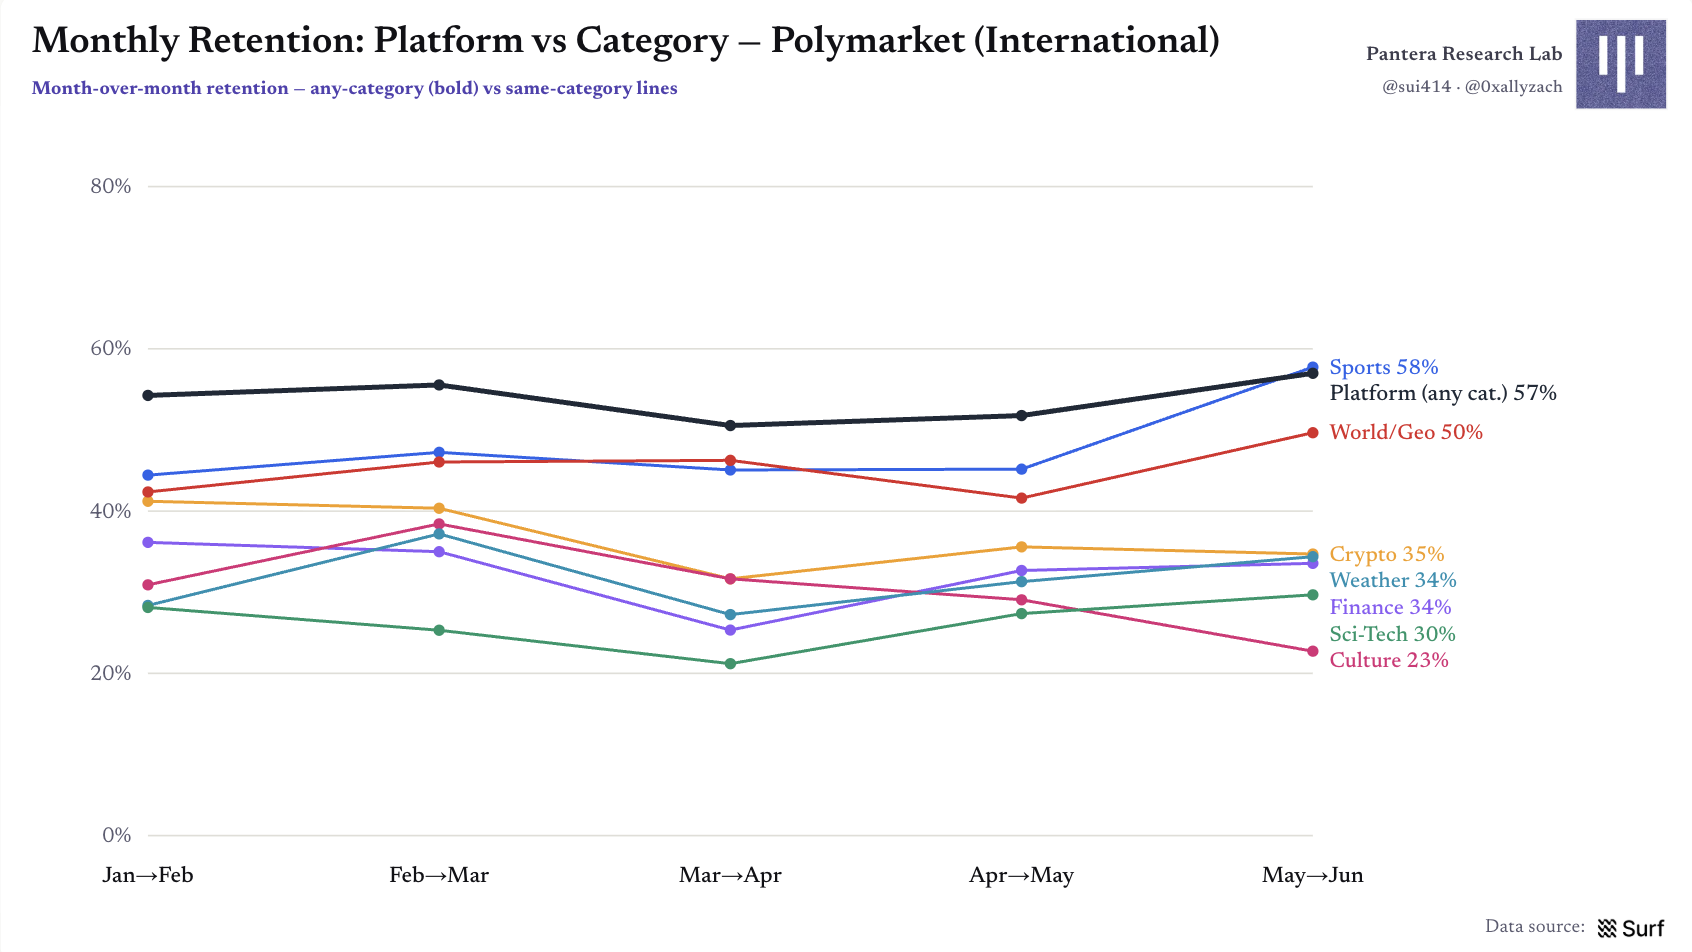
Figure 12 | Comparison of platform retention and category retention
Retention rates for different entry categories are highly clustered between 44%—49% for one-month, with three-month retention approximately 25%—32%. The only noticeable low point is for the crypto entry, with a one-month retention rate of about 37%, which is about 30% lower than other categories; one possible explanation and conjecture is that automated operations in crypto trading often rotate new wallets, leading to a lower apparent retention rate.
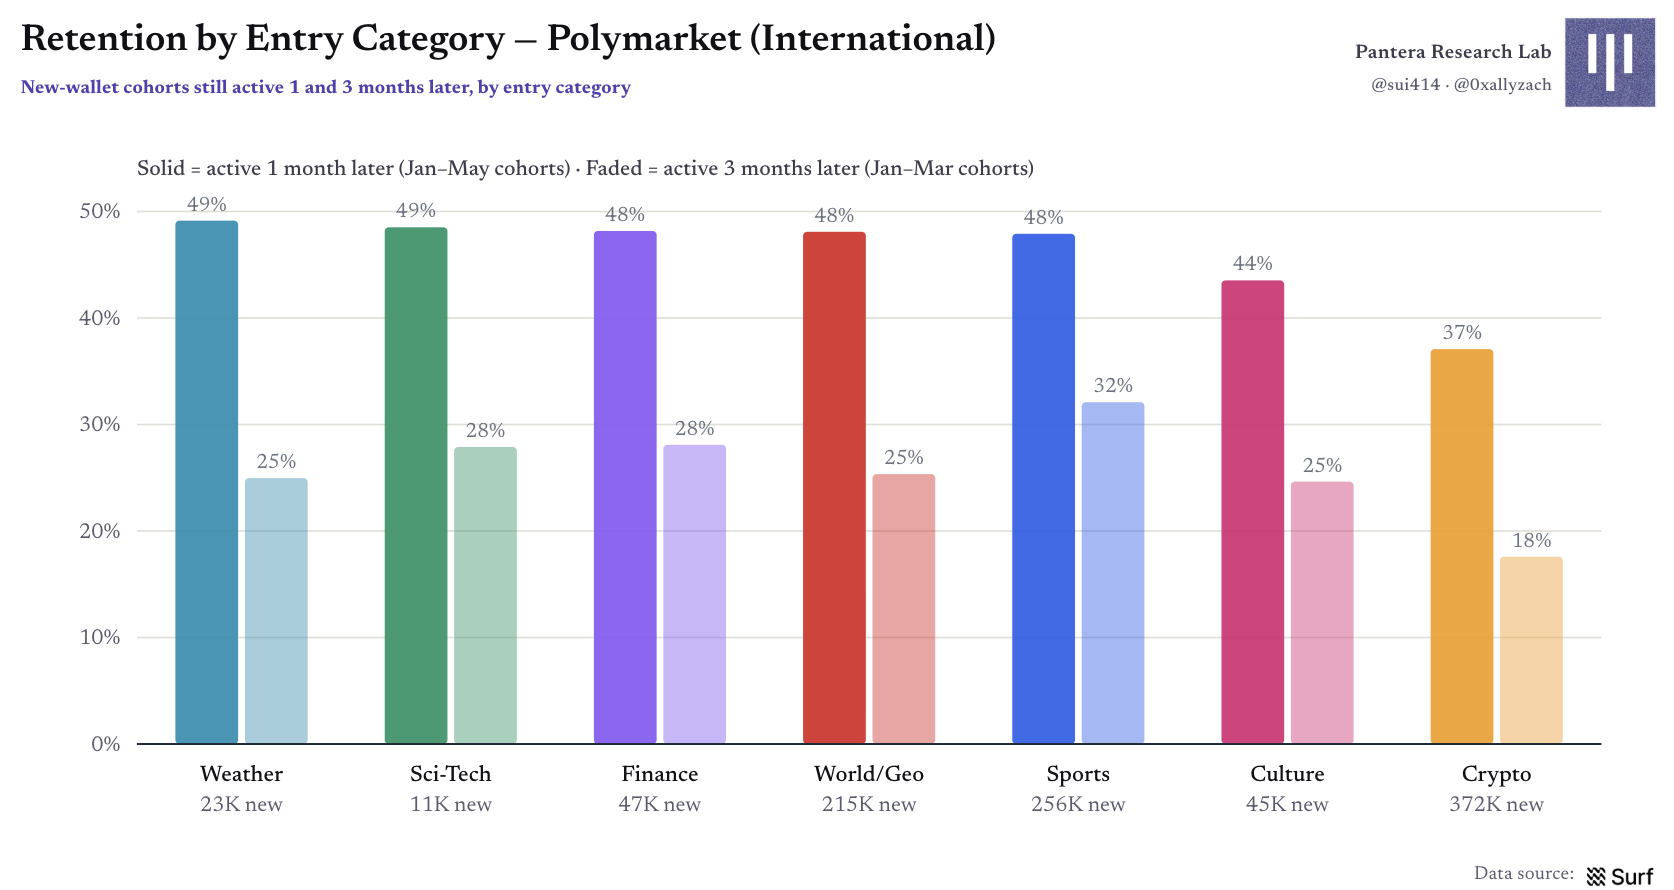
Figure 13 | New wallet retention compared by entry category
User Market Participation Category Matrix: Geopolitics as the Connecting Layer
The matrix diagonal indicates the independent wallet count of each category, while the off-diagonal percentages indicate the proportion of smaller categories simultaneously trading another category. Although sports and crypto are the two largest user groups, their overlap is only 49%, indicating a distinct difference in audience. The overlap between world/geopolitical events and other categories is generally higher (weather being an exception), serving as a core product that connects various interests across the platform.
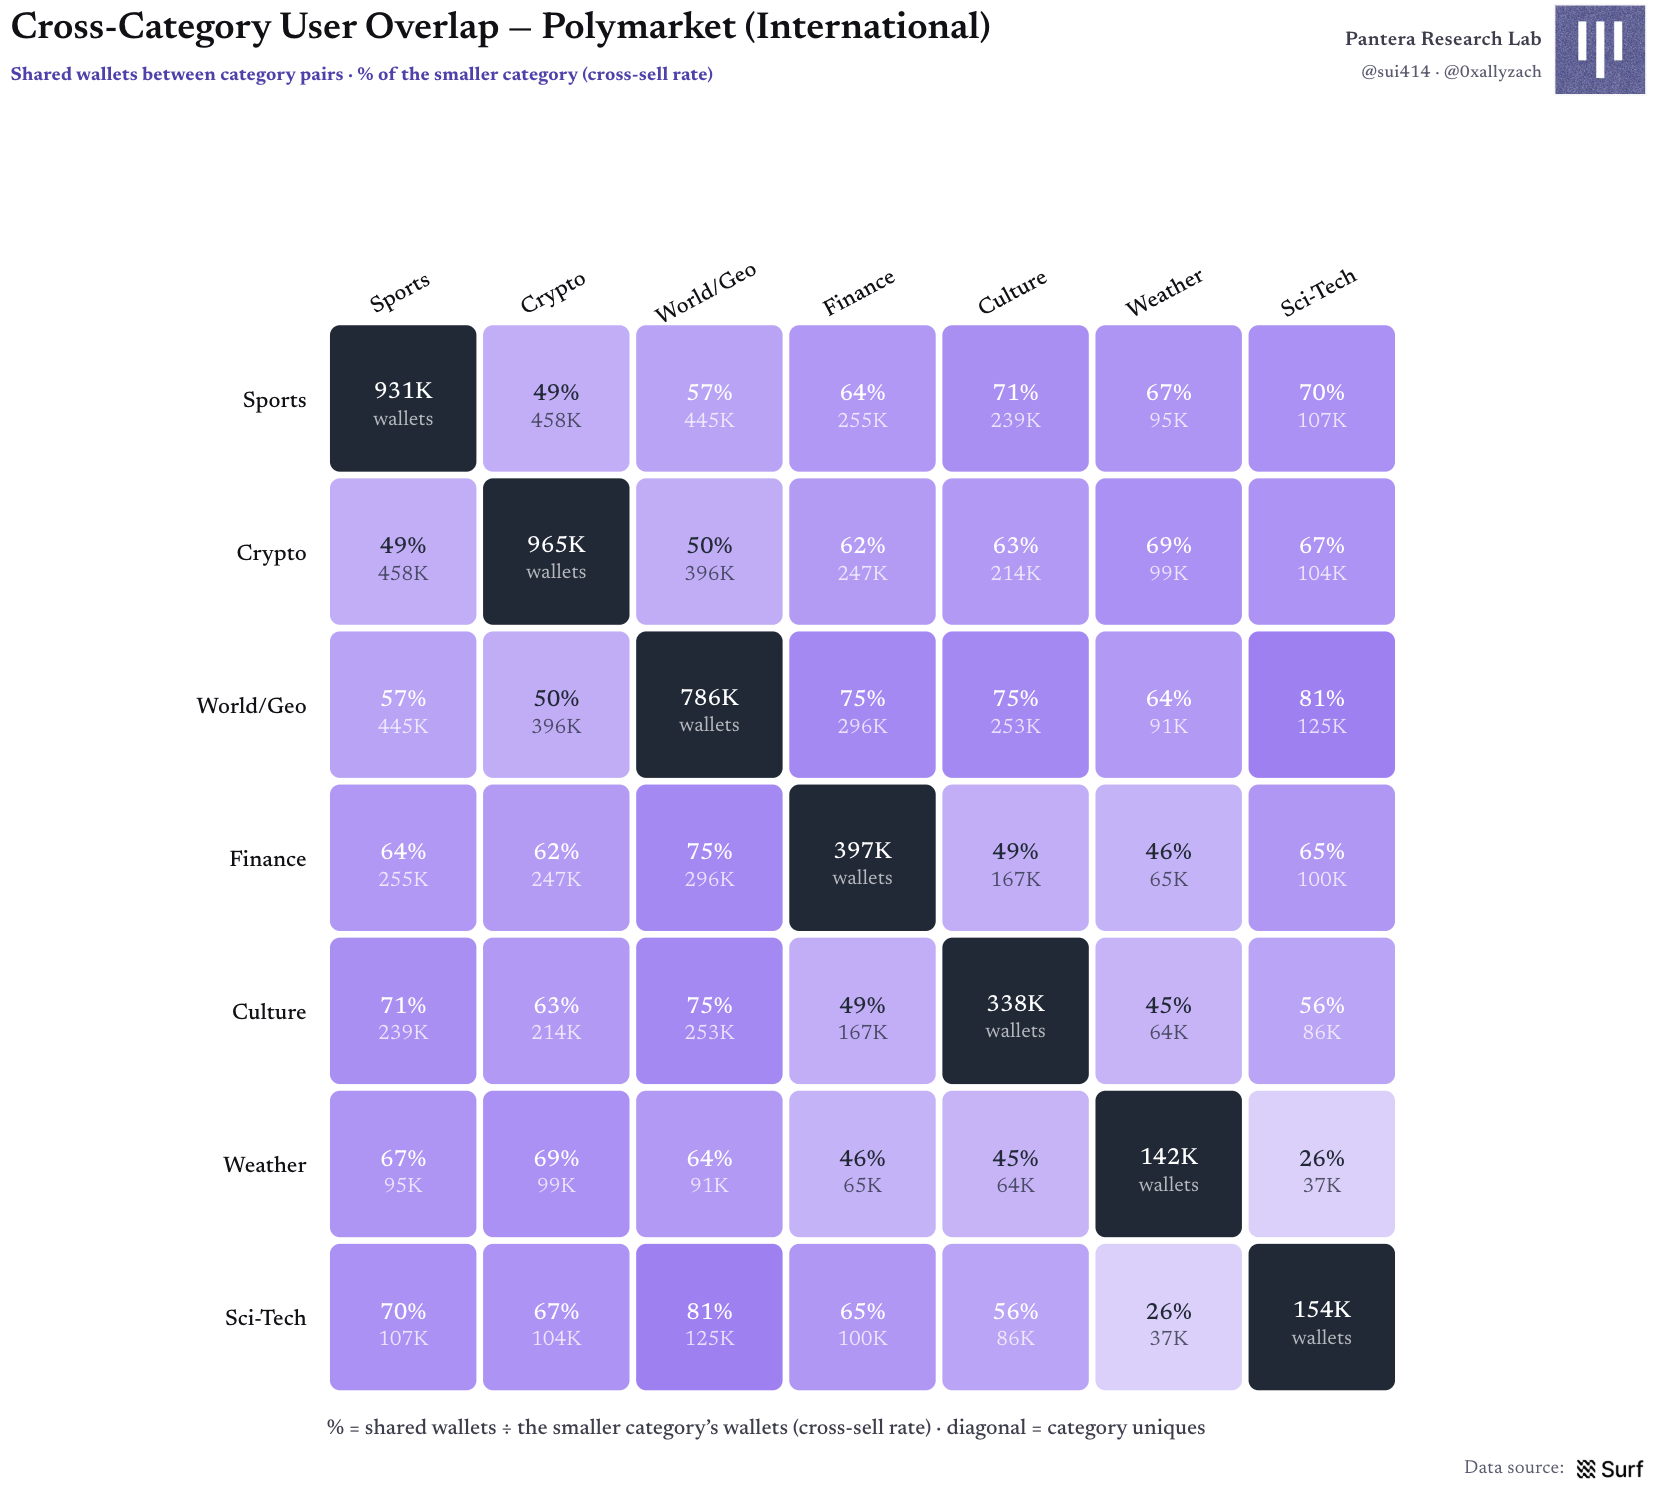
Figure 14 | Cross-category user overlap and cross-selling rates
User Category Stickiness × Diffusion Map: Different Entry Points Lead to Different Quality of Users
Putting entry retention and cross-category expansion on the same chart, six categories cluster in the 43%—49% loyalty range, but their expansion capabilities differ: sports users appear to stay more as stable users, while science and technology attract users who on average explore 3.6 other categories. Crypto falls in the lower left corner: one-month retention is approximately 37%, and expansion is the lowest. The five-minute gambling markets generate trading volume rather than long-term retention or cross-category exploration.
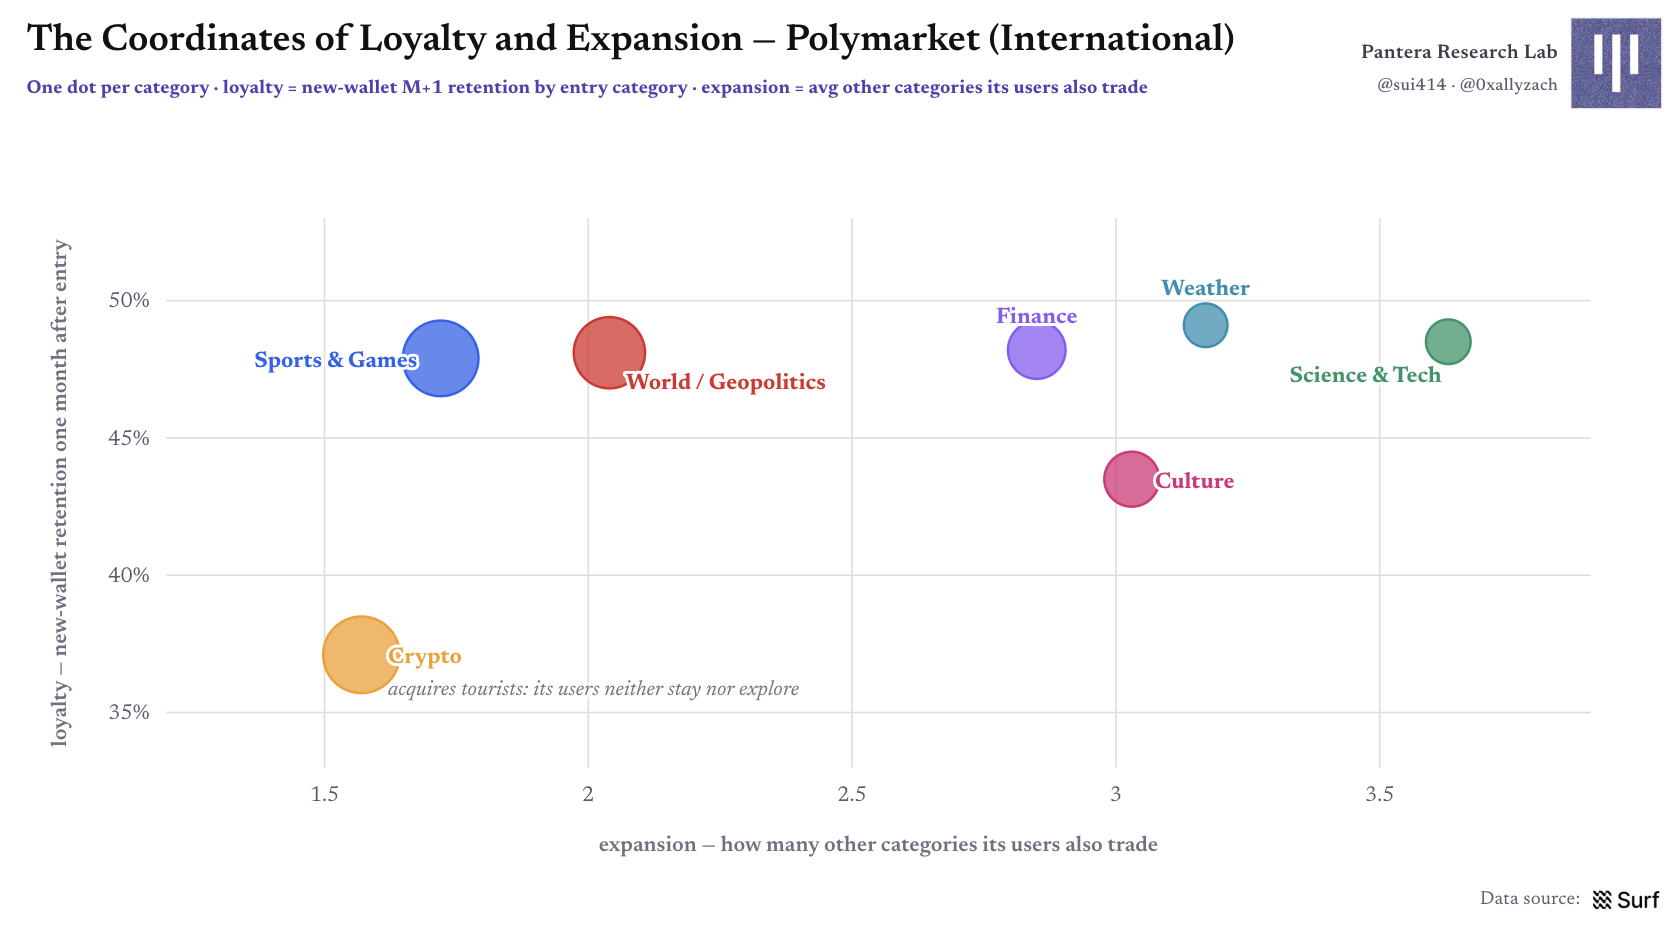
Figure 15 | Coordinates of each category in "Loyalty × Expansion"
Part Three: Market Microstructure: User Profiles, Entry Timing, and Profitability
Distribution of User Profiles: Market Category Breadth and Frequency Linked to Trading Scale
We depict users from three perspectives: how many categories they cover, the size of individual transactions, and how frequently they trade. The broader the category coverage, the higher the average transaction volume; wallets covering all seven categories account for only about 1%, but have an average taker trading volume of about $59,000 in the first half, which is seven times that of pure single category wallets at $8,300.
The frequency dimension presents a typical 80/20: about 6% of "high-frequency users" contribute 79% of trading volume, while wallets that only trade once account for about 8% of the user base.
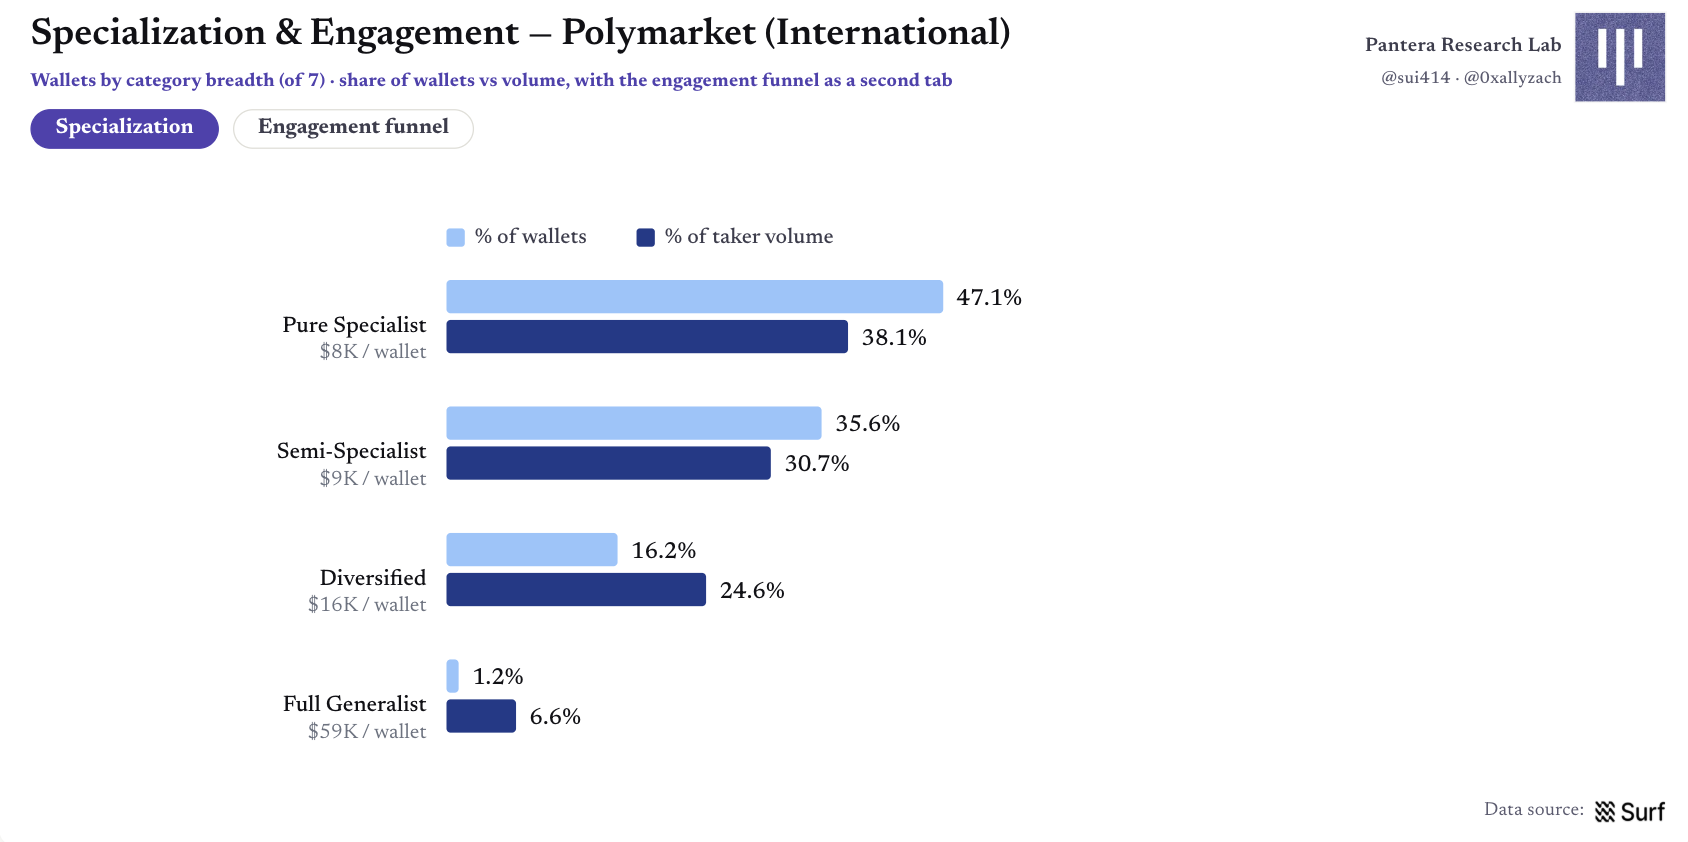
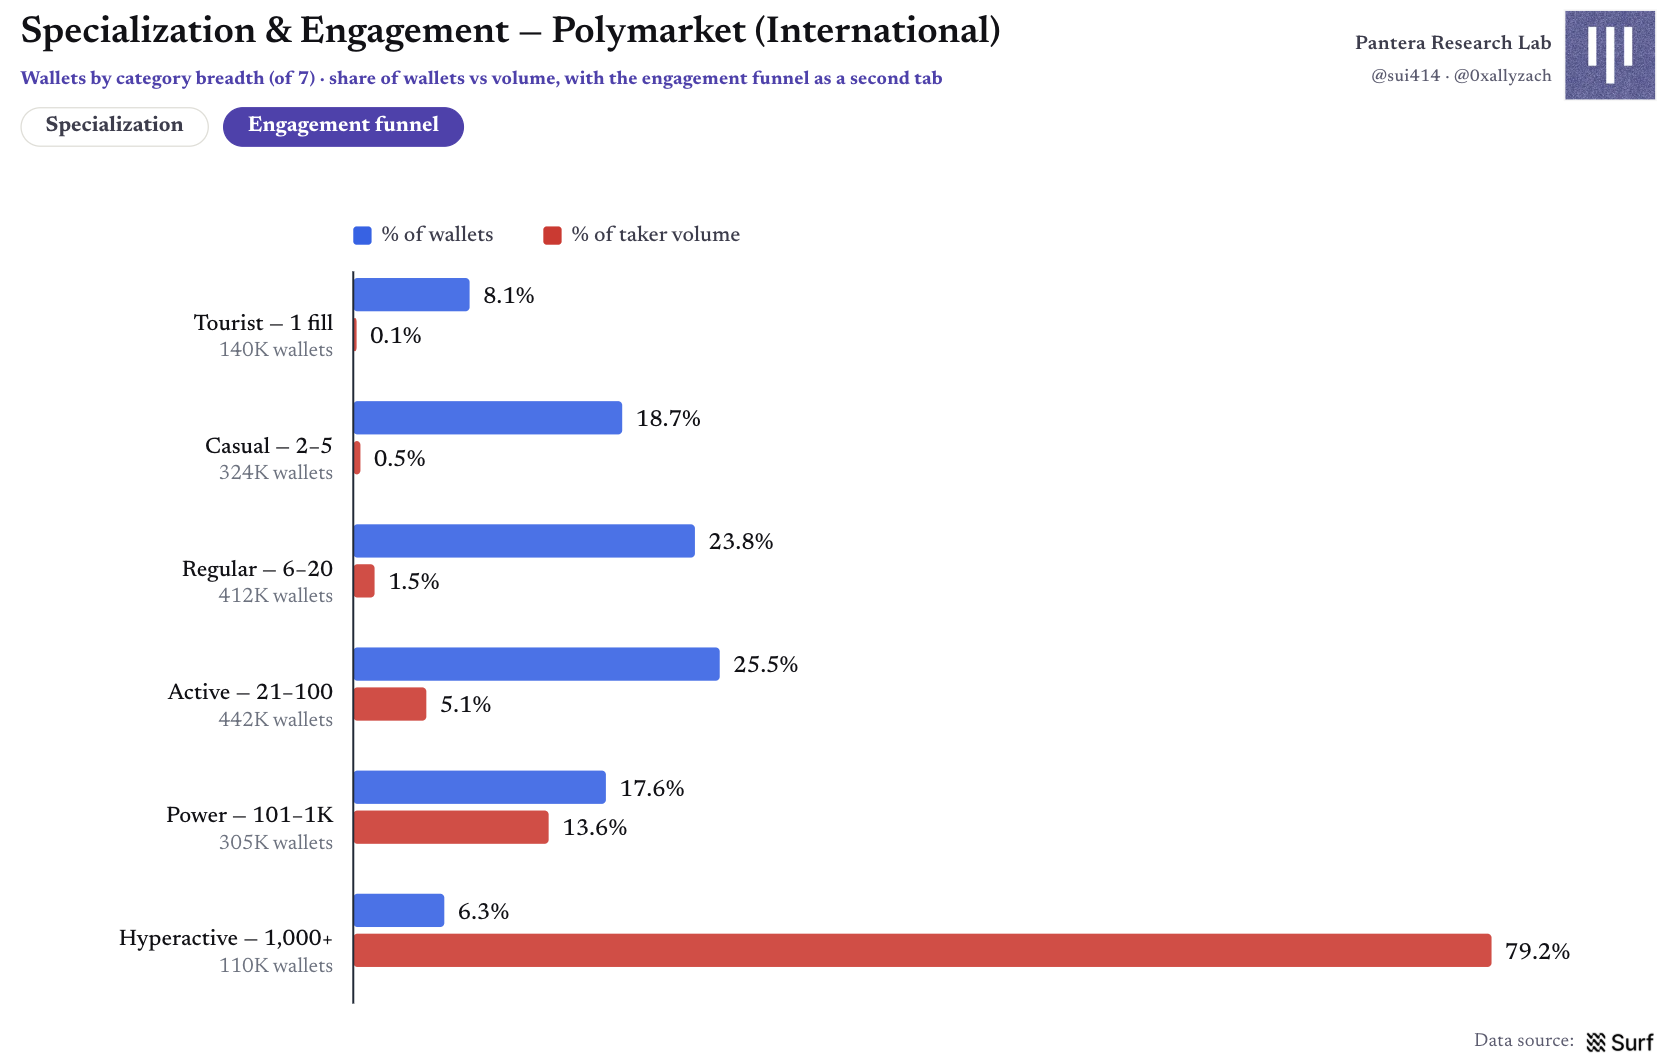
Figure 16 | Specialization and Engagement: Category Breadth, Wallet Share, and Trading Volume
In most categories, the relationship between wallets and individual markets leans towards one to two transactions; the proportion for sports has the highest single transaction share at 46%. In contrast, world/geopolitical events show only 20% of relationships are single transactions, indicating that users return to the same market repeatedly as news develops.
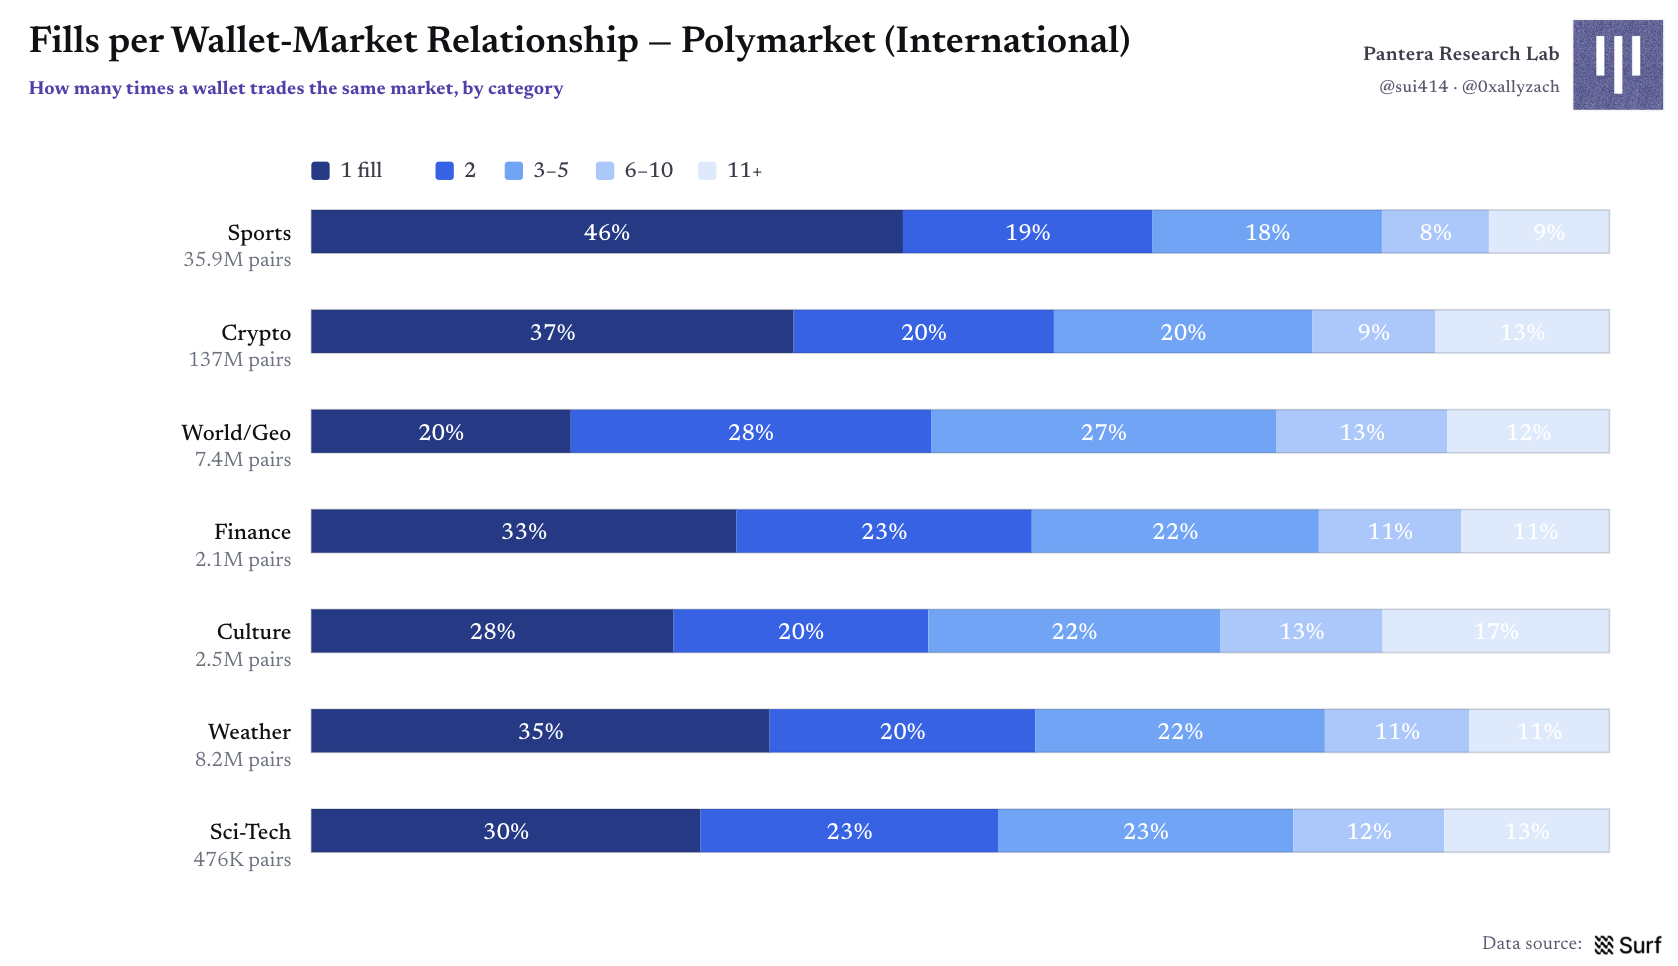
Figure 17 | Number of transactions per wallet-market relationship
Three Types of Participants: Robots, Professional Users, and Retail Users
We use signals of trading frequency, consistency of order amounts, breadth of coverage, and average ticket size for heuristic classification. The classification does not serve as a definitive judgment of true identities; threshold variations will also affect the distributions; it is more suited to answer "who is trading in what ways" rather than "who exactly is who."
Robot-like wallets account for about 5.9% of users but complete roughly two-thirds of the trading volume: approximately 102,000 wallets contributed $11.9 billion in trades and 89% of trading events; about 1.54 million retail wallets contributed $4.1 billion. Professional/informed users account for about 5%, contributing 6.6% of taker trading volume, consistent with their providing more liquidity and taking fewer active orders.
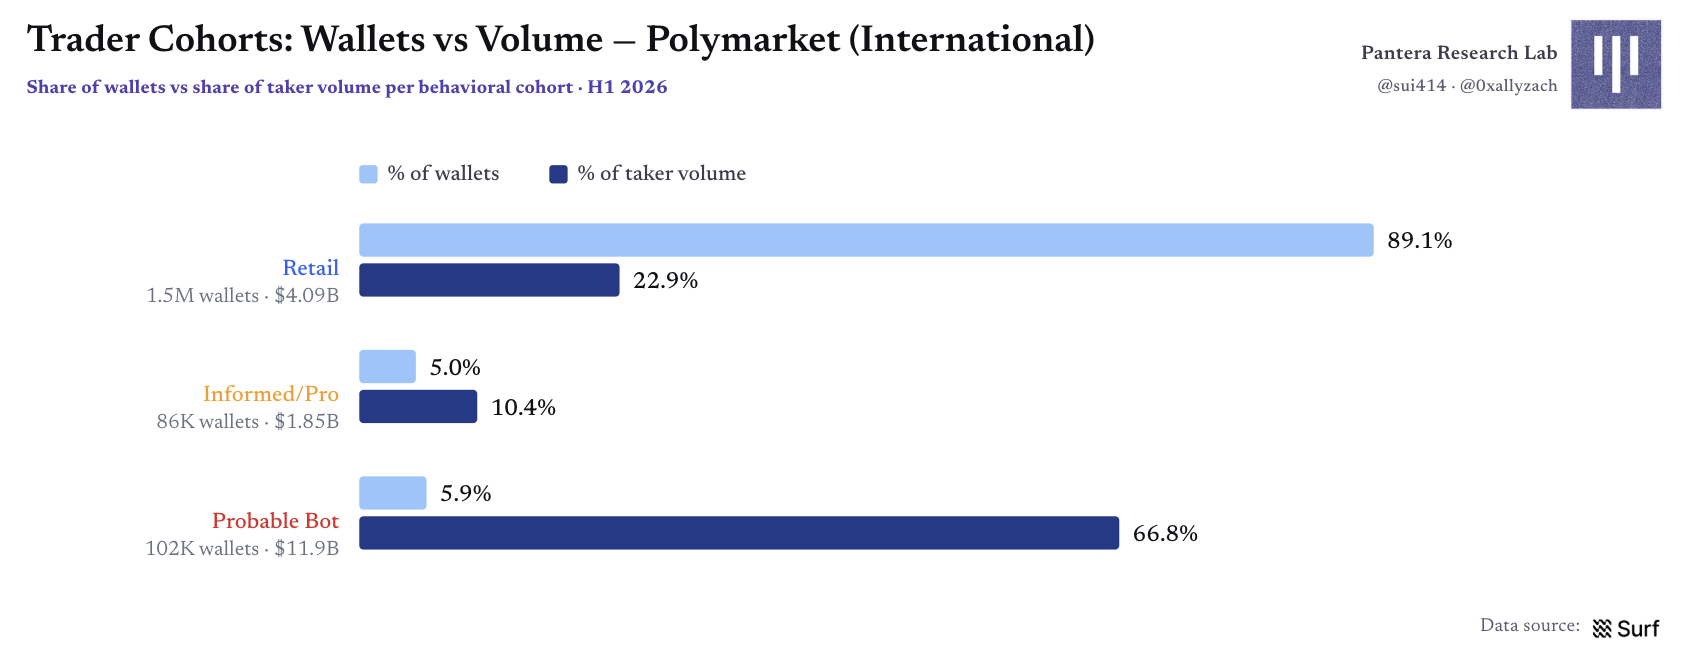
Figure 18 | Trader Groups: Discrepancy between Wallet Numbers and Trading Volumes
By category, robots almost entirely dominate the crypto and sports markets, capturing about 80% and 72% of trading volumes, respectively; in the mixed area where humans still influence prices—geopolitics, finance, culture—the shares of the three groups are closer to parity.
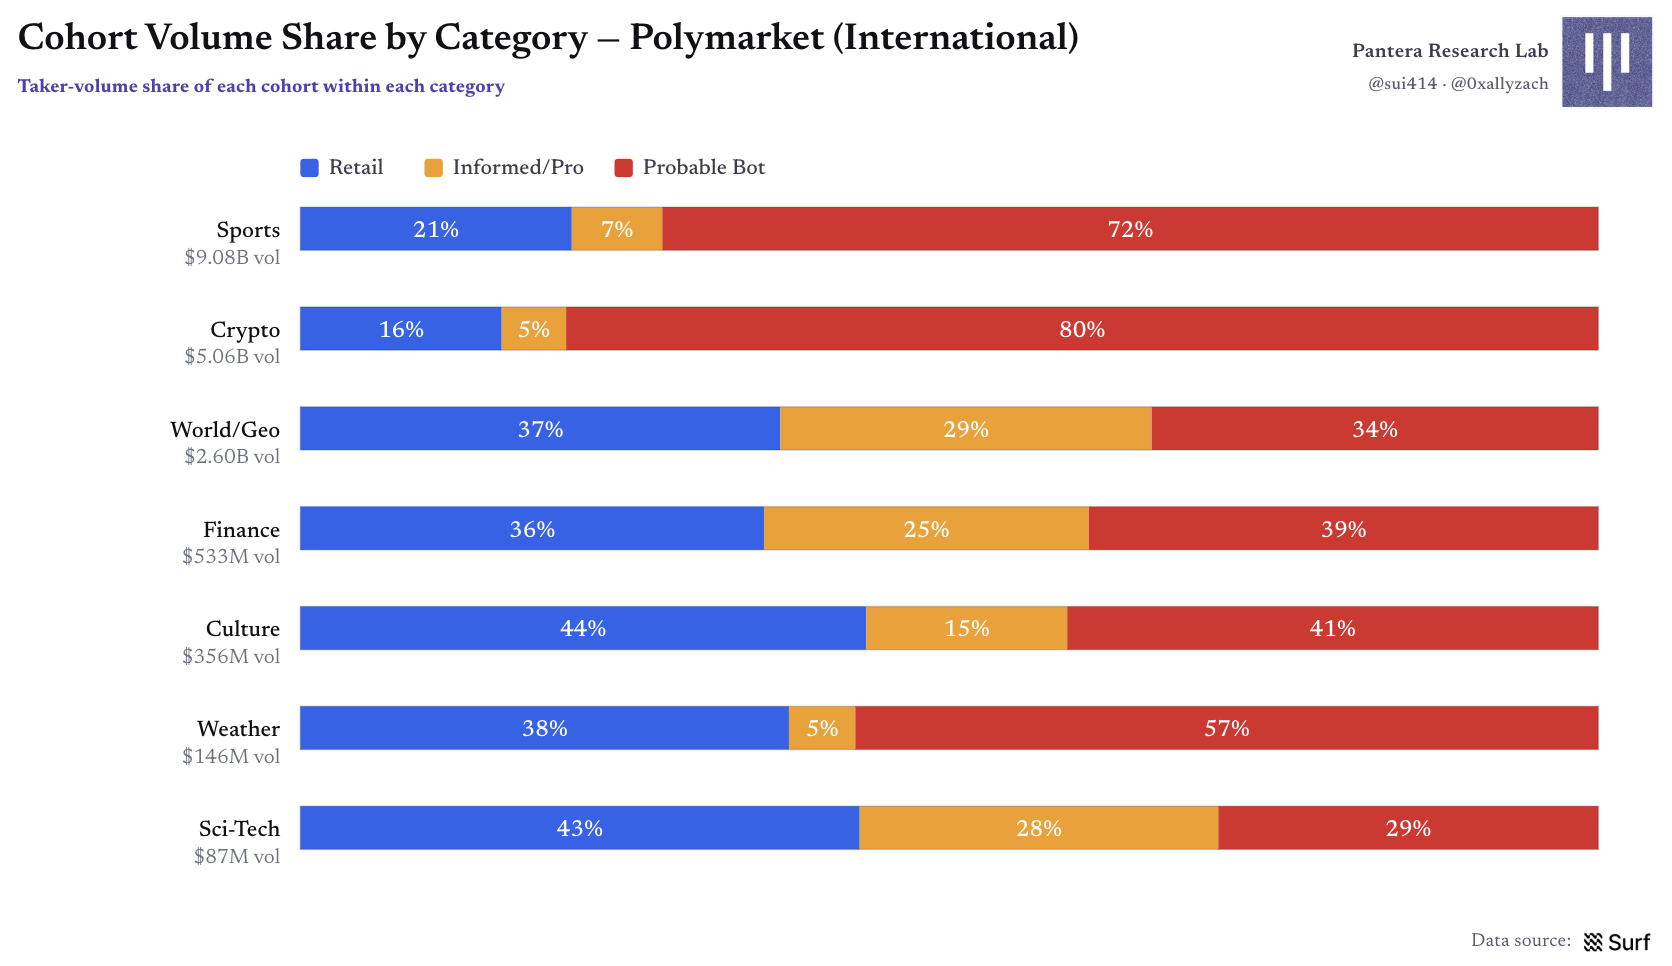
Figure 19 | Group Trading Volume Shares by Category
However, trading volume advantages arise from a very thin layer of robots. In terms of wallet count, each category is still overwhelmingly occupied by retail users; automated behavior has a significantly higher share in crypto and weather markets, with about 5% of the population share being replaced by automation.
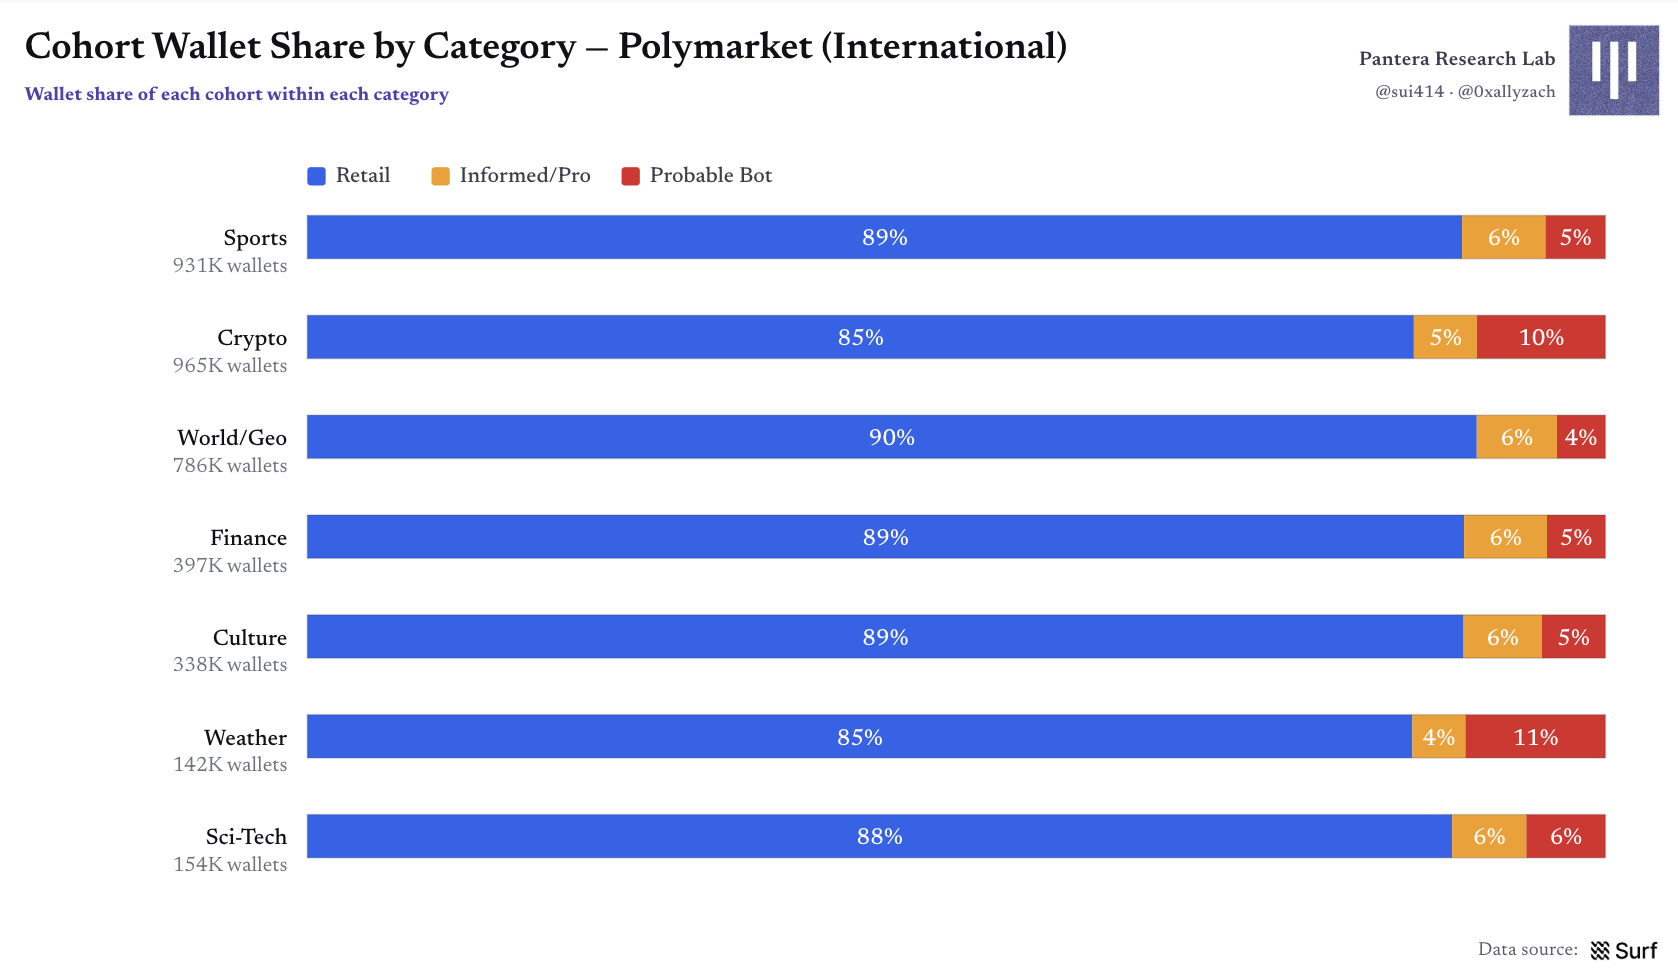
Figure 20 | Wallet Group Shares by Category
Are Prediction Market Users Sensitive to Fees?
Different categories activated fees at different times, creating a natural experiment; the zero-fee world/geopolitical category can serve as a control group. Results show that after fees were introduced, the composition of trading volume significantly changed, especially in the crypto, cultural, and weather markets: the share of trading volume from professional/informed users rapidly declined, while retail and robot shares remained relatively stable, indicating stronger insensitivity to fees.
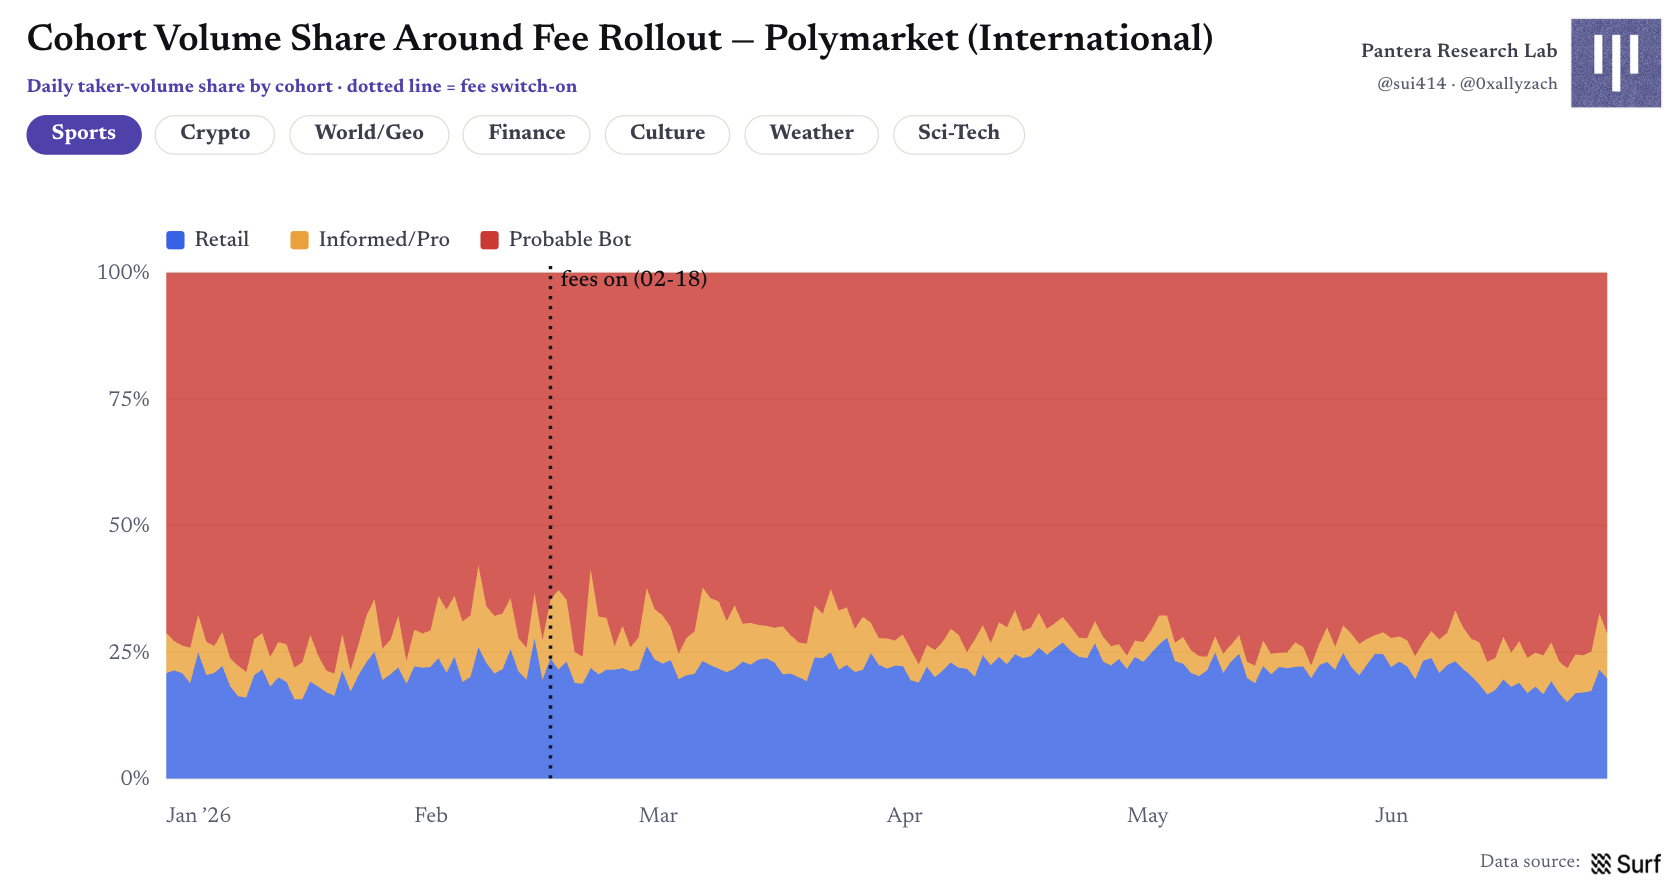
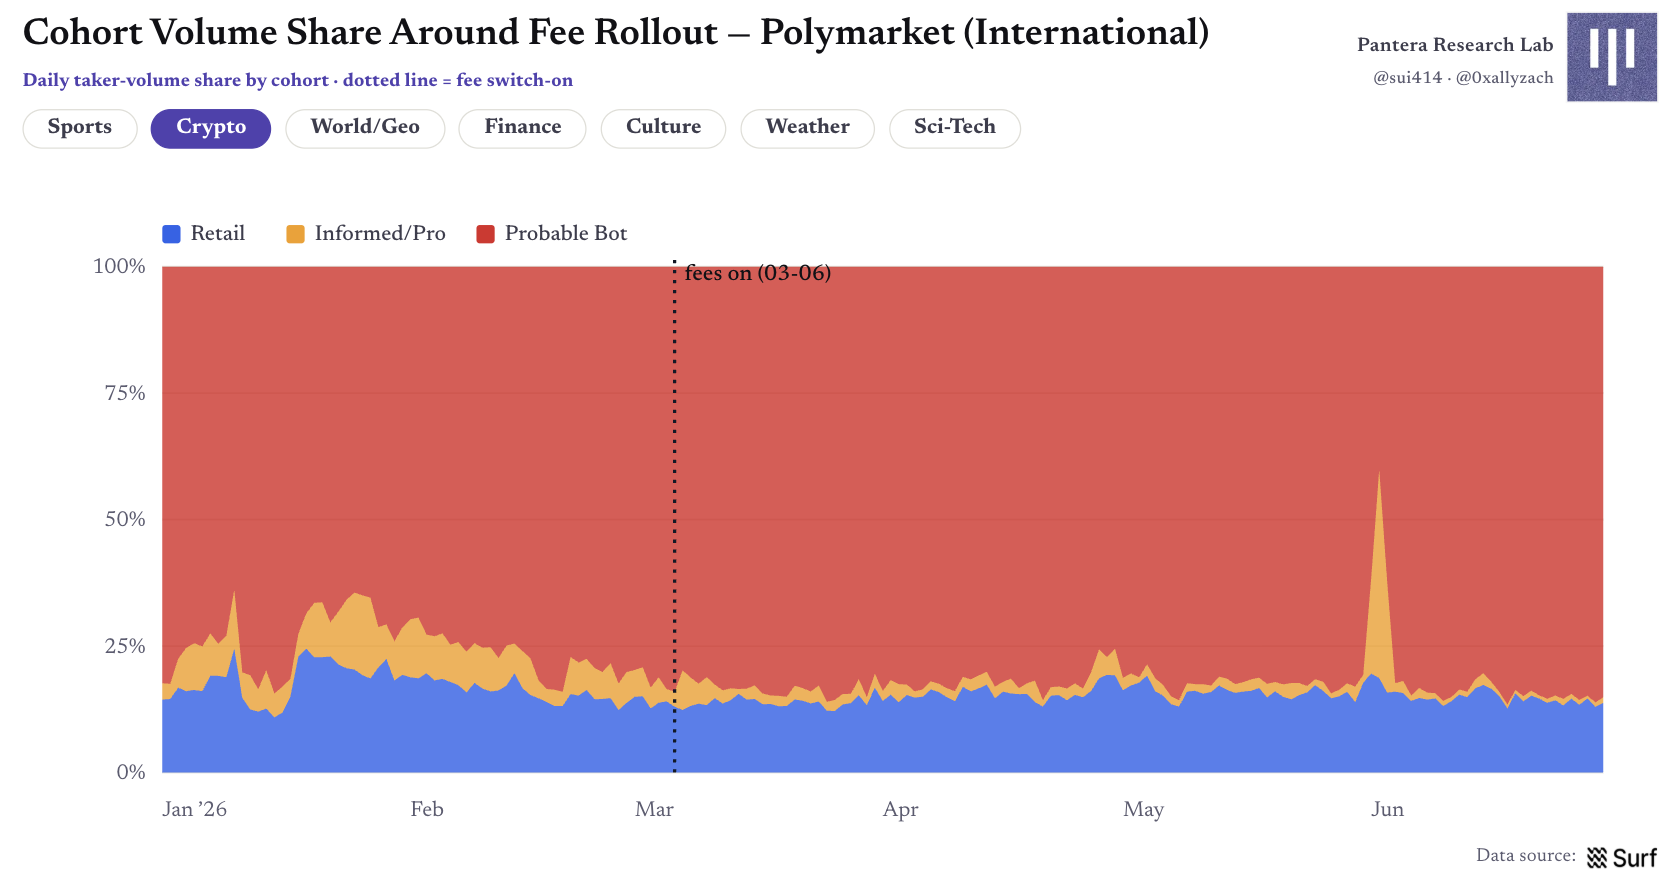
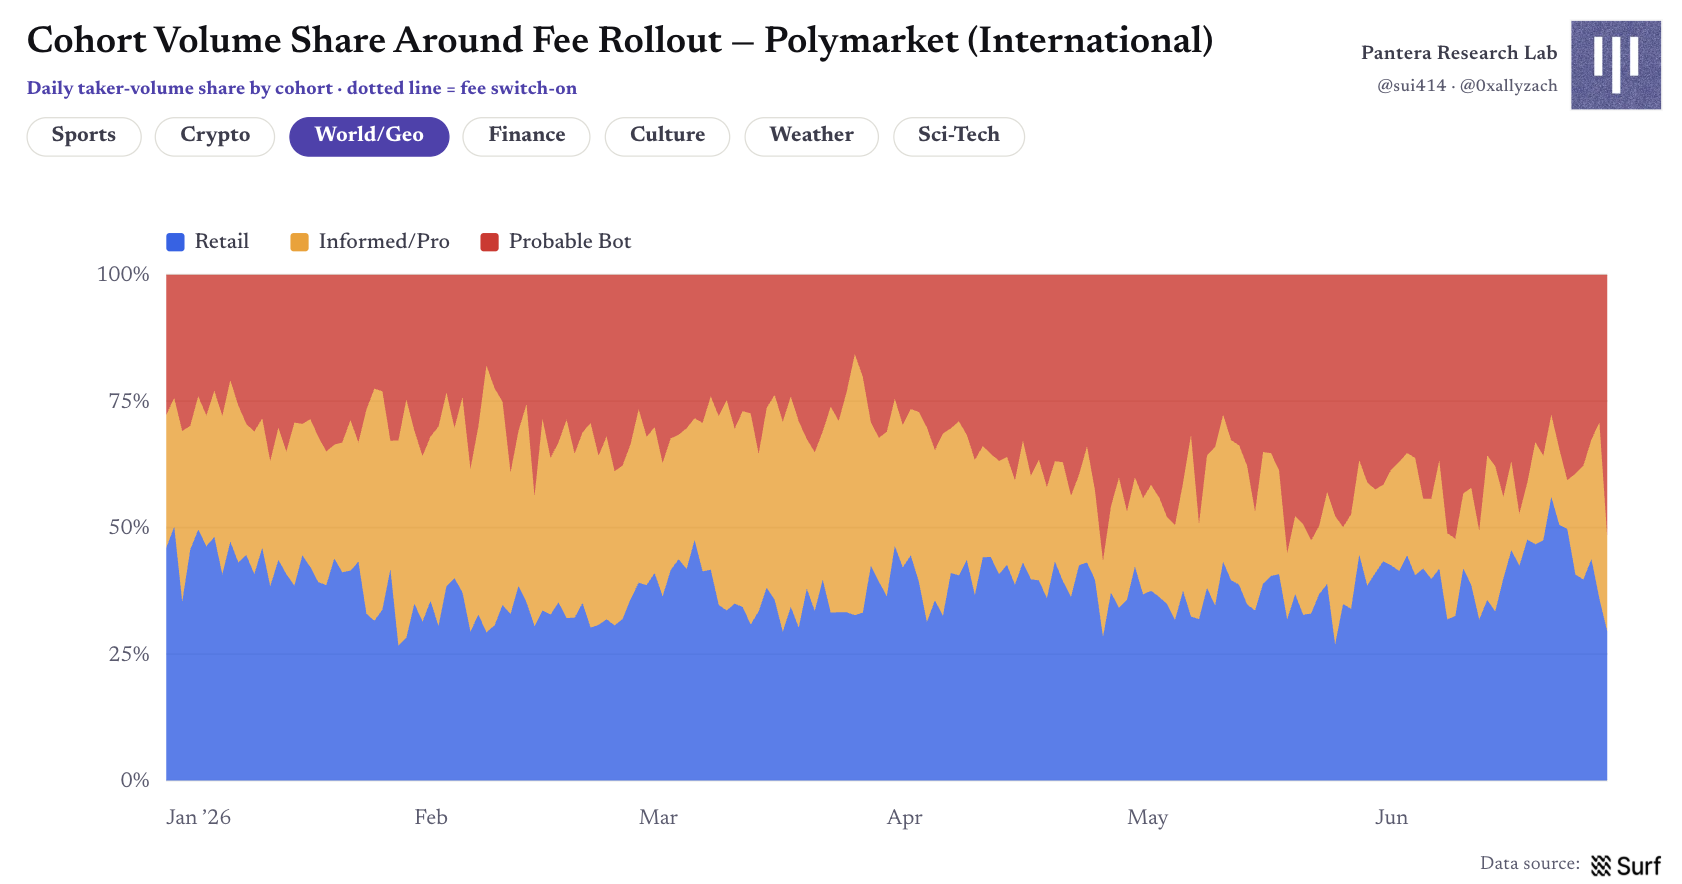
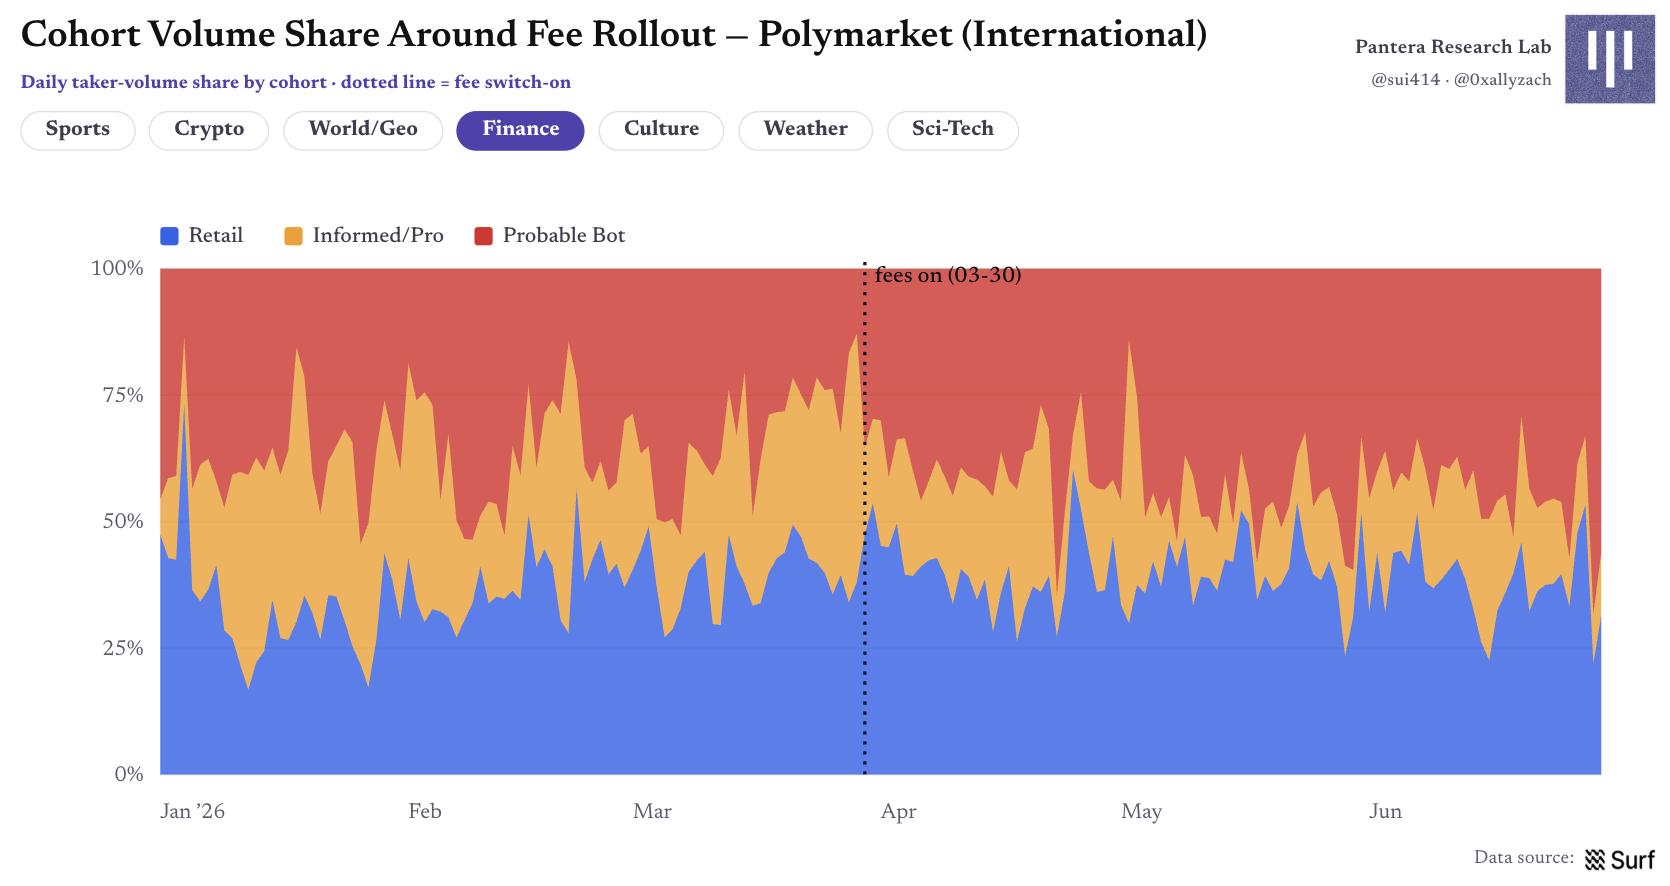
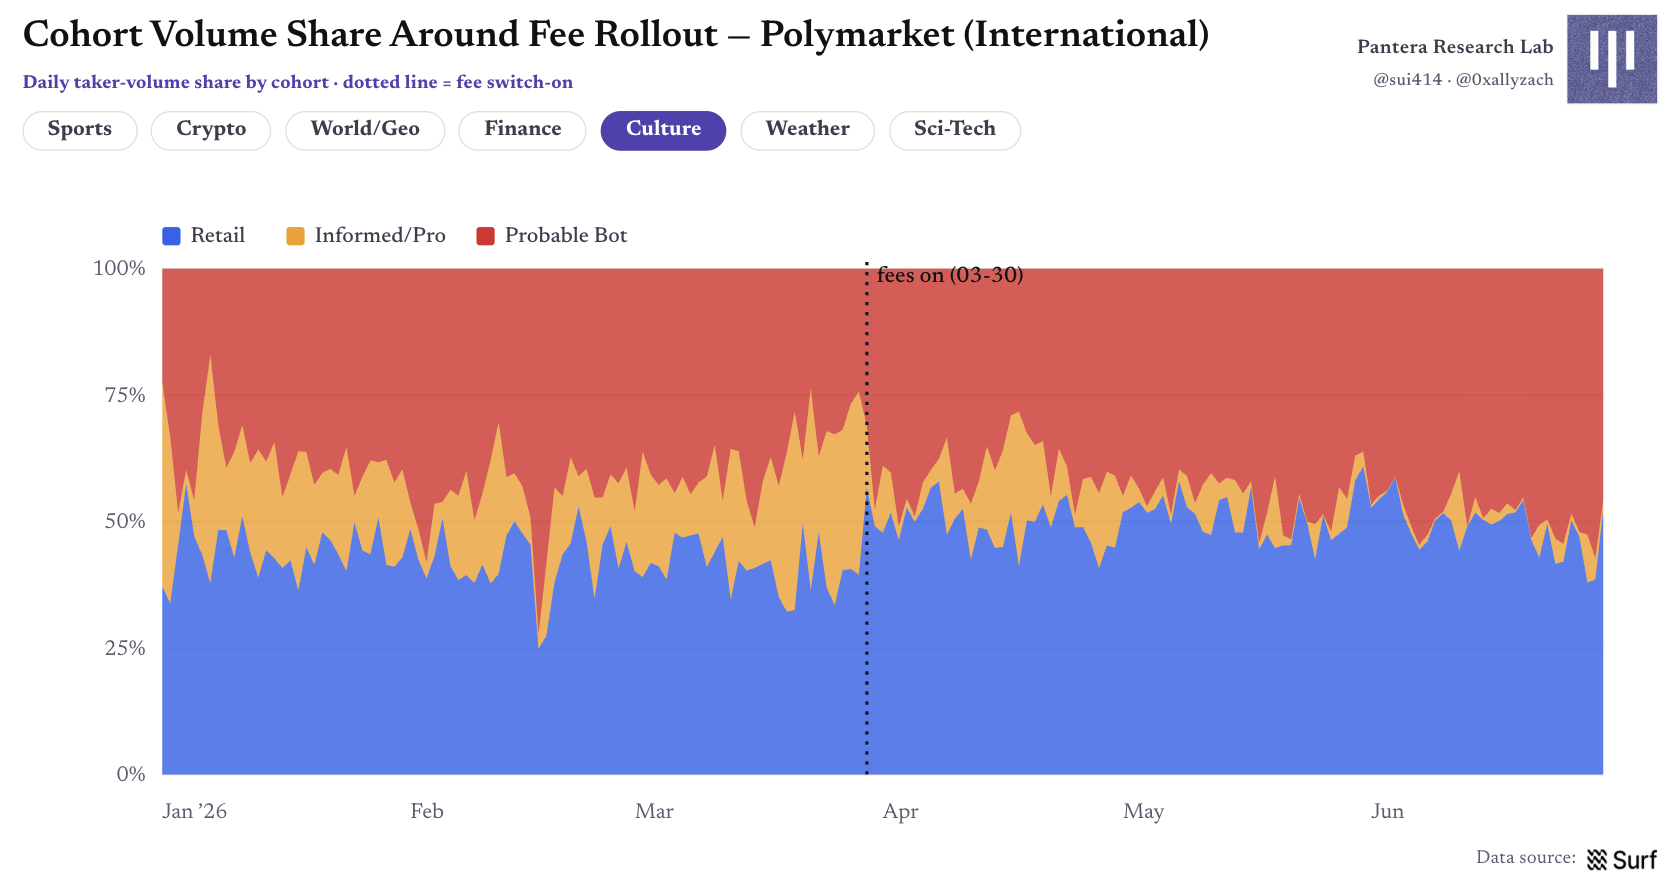
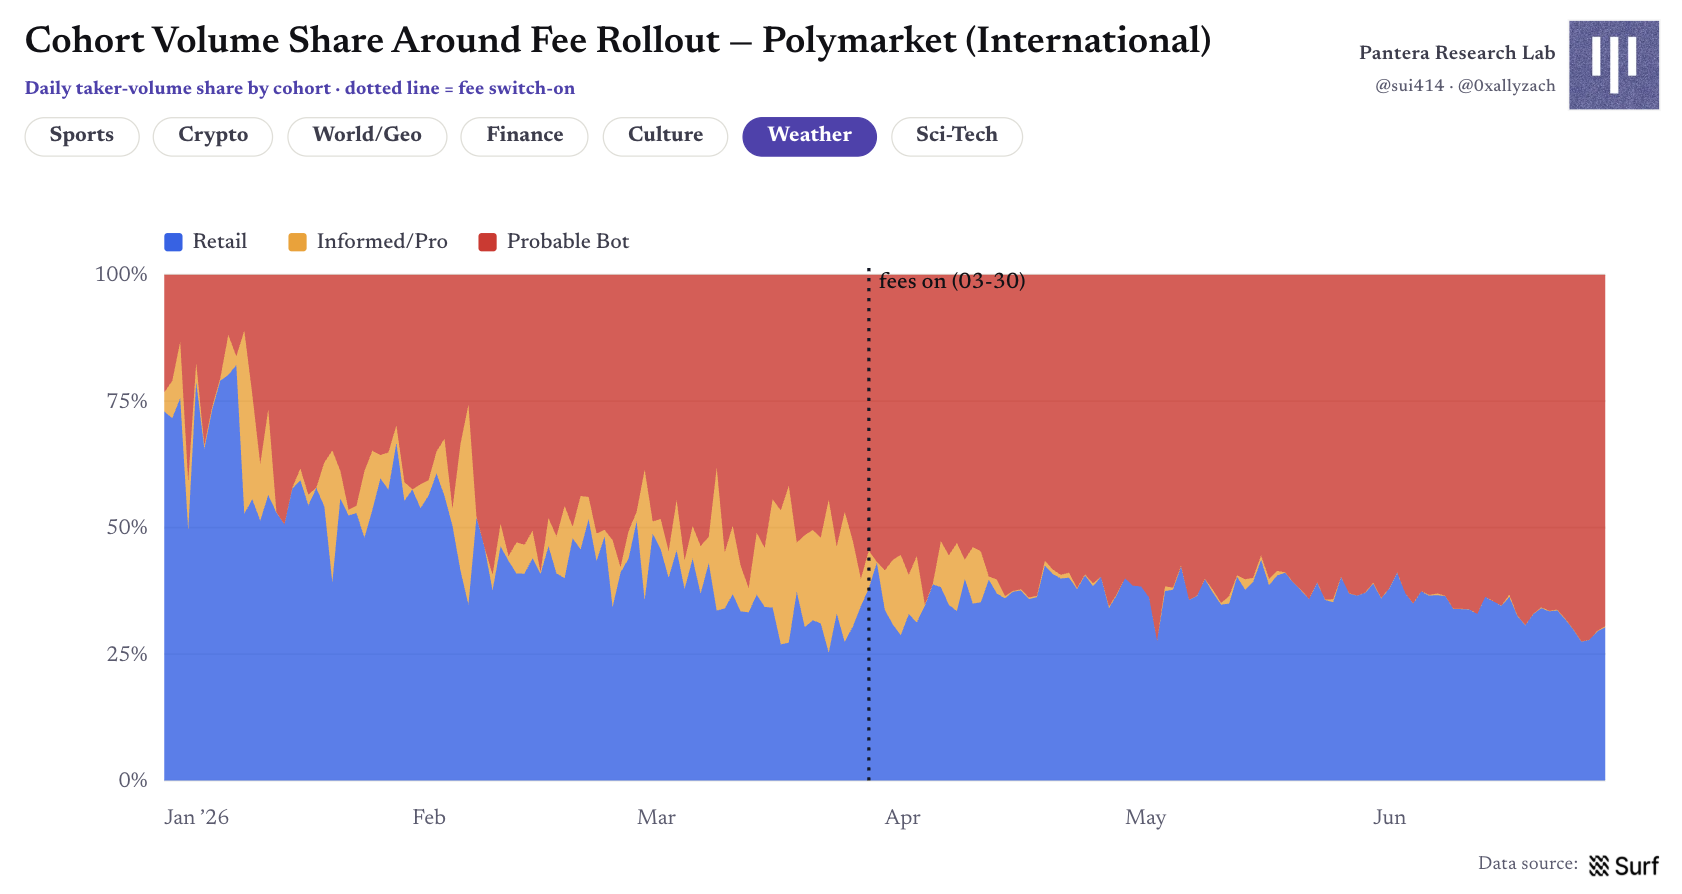
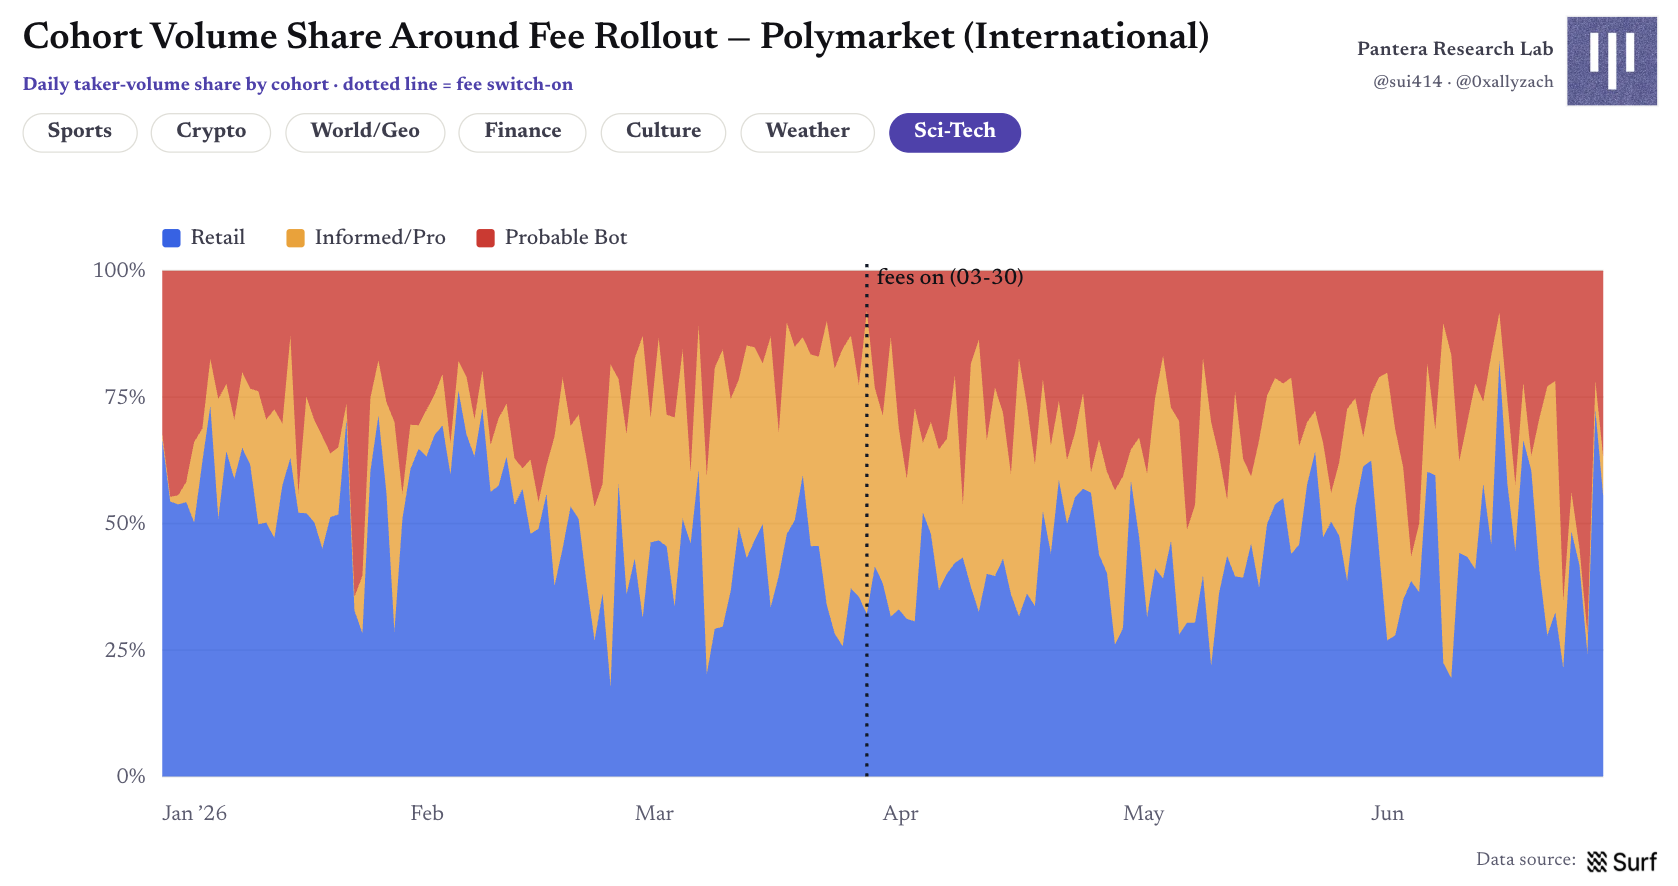
Figure 21 | Volume share of each group before and after fees were introduced
The change in wallet shares is vastly smaller than in trading volume shares, but the patterns are consistent: the loss of professional/informed wallets across these three categories is the most pronounced. Fees change "who is increasing their bets," but don’t necessarily immediately change "who is still in the market."
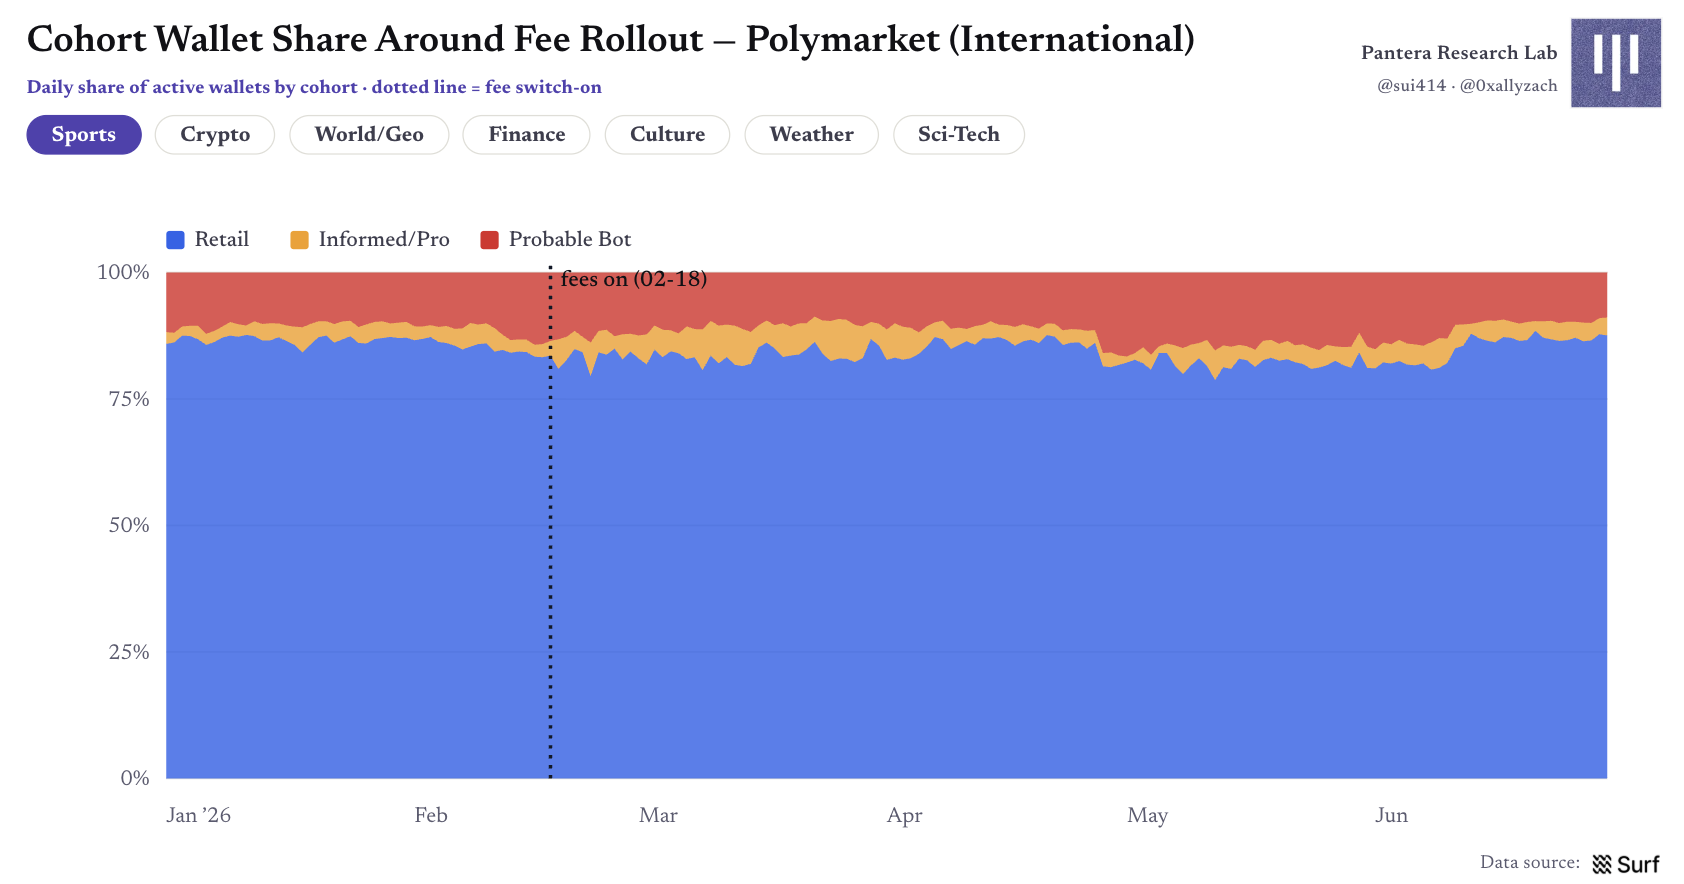
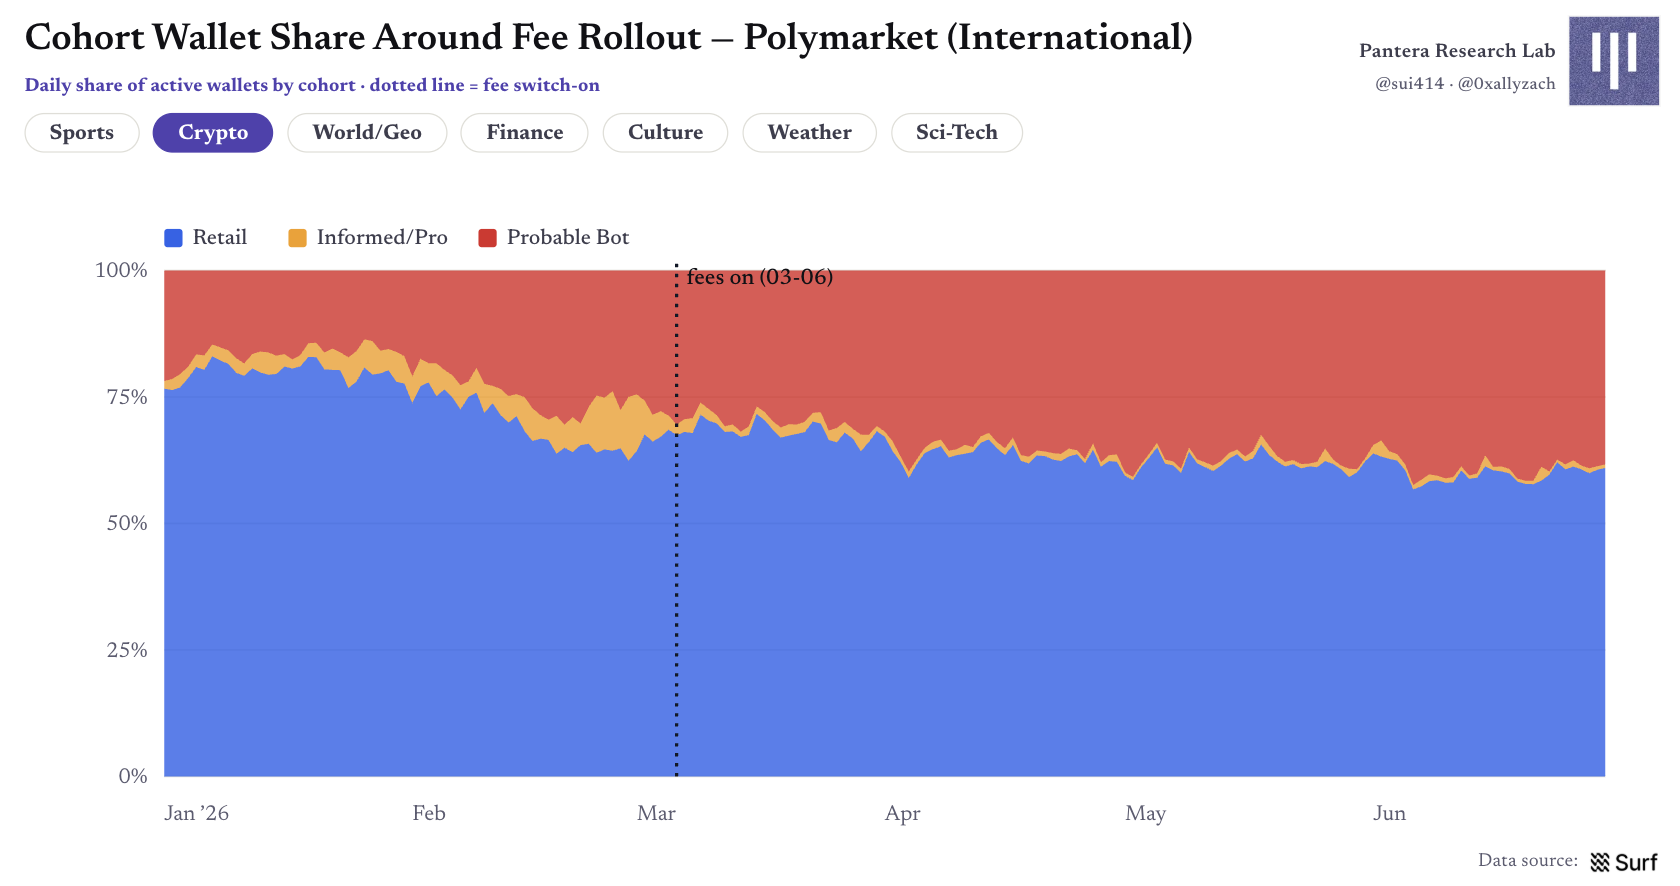
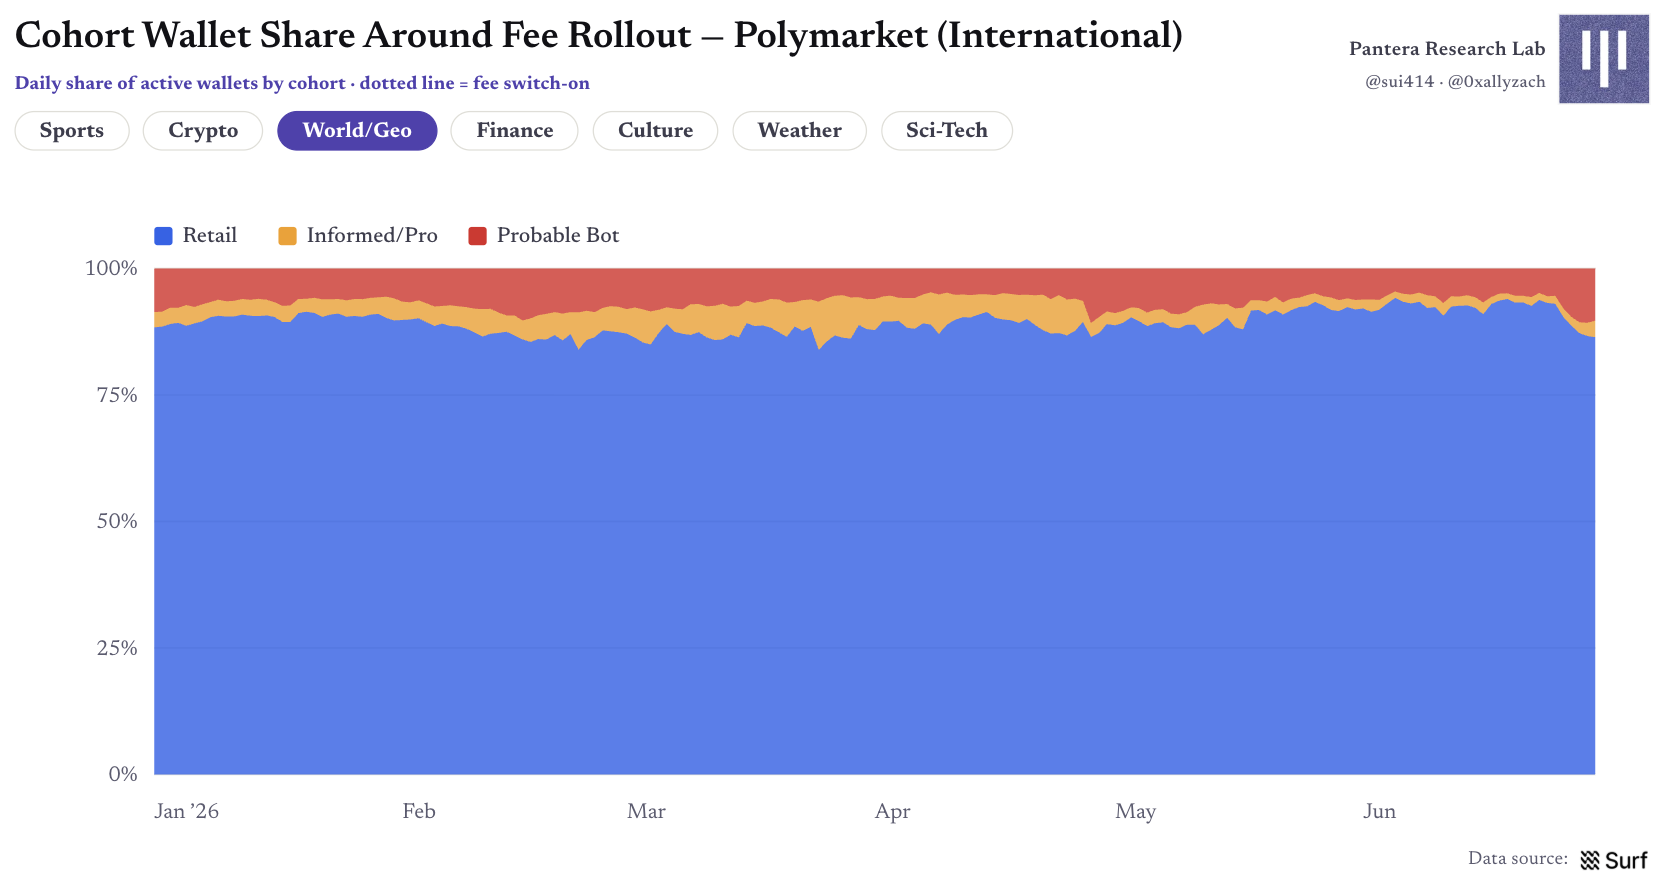
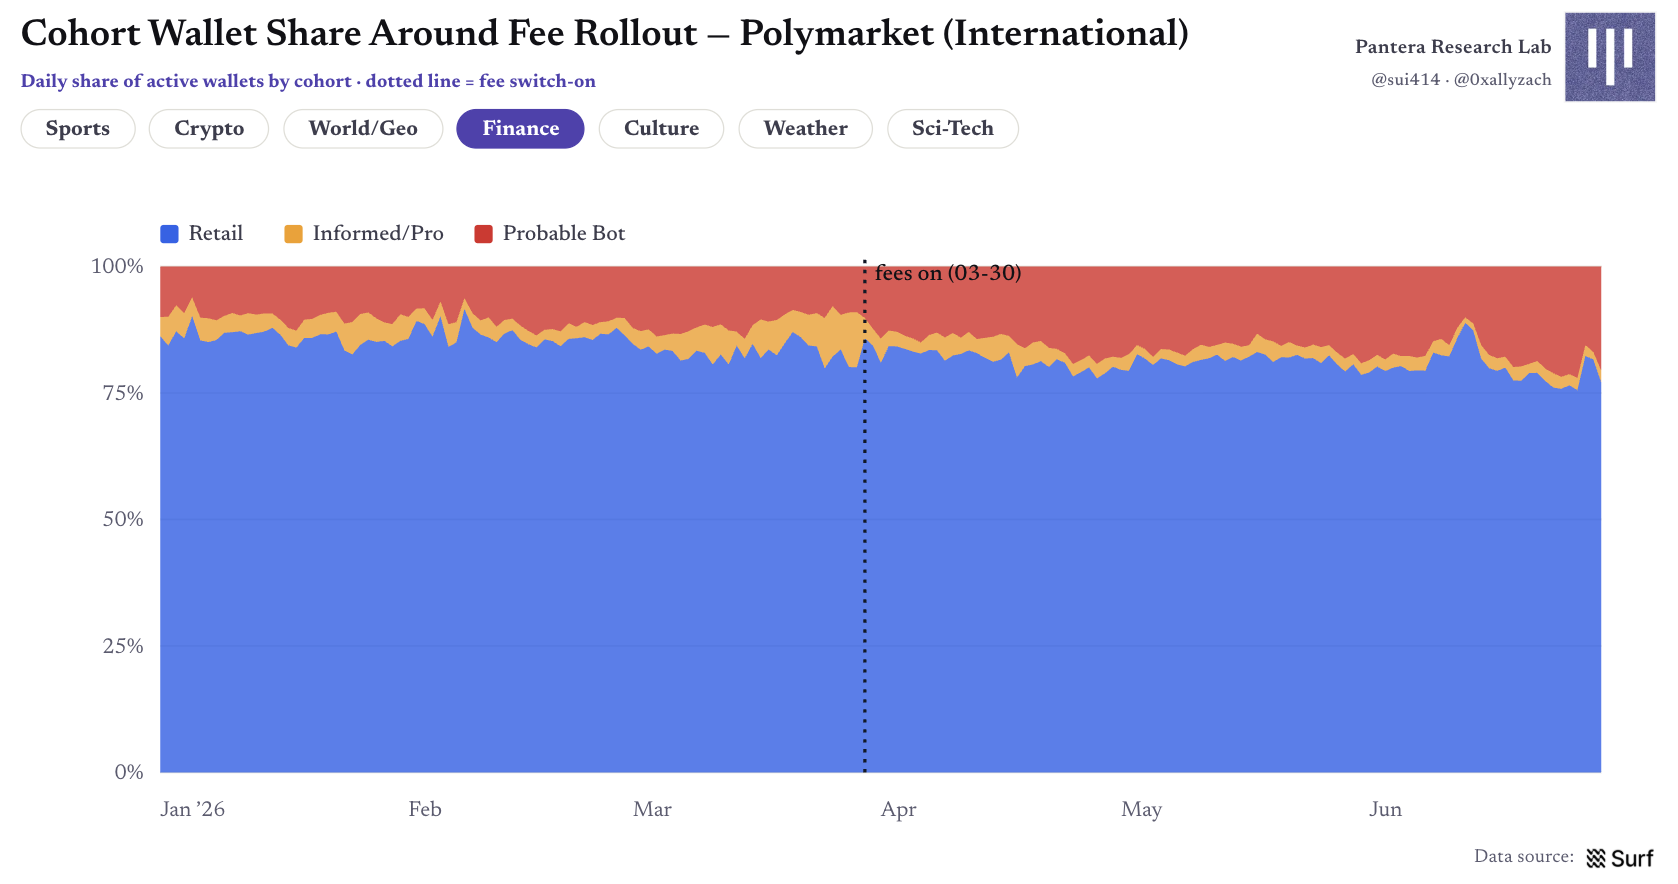
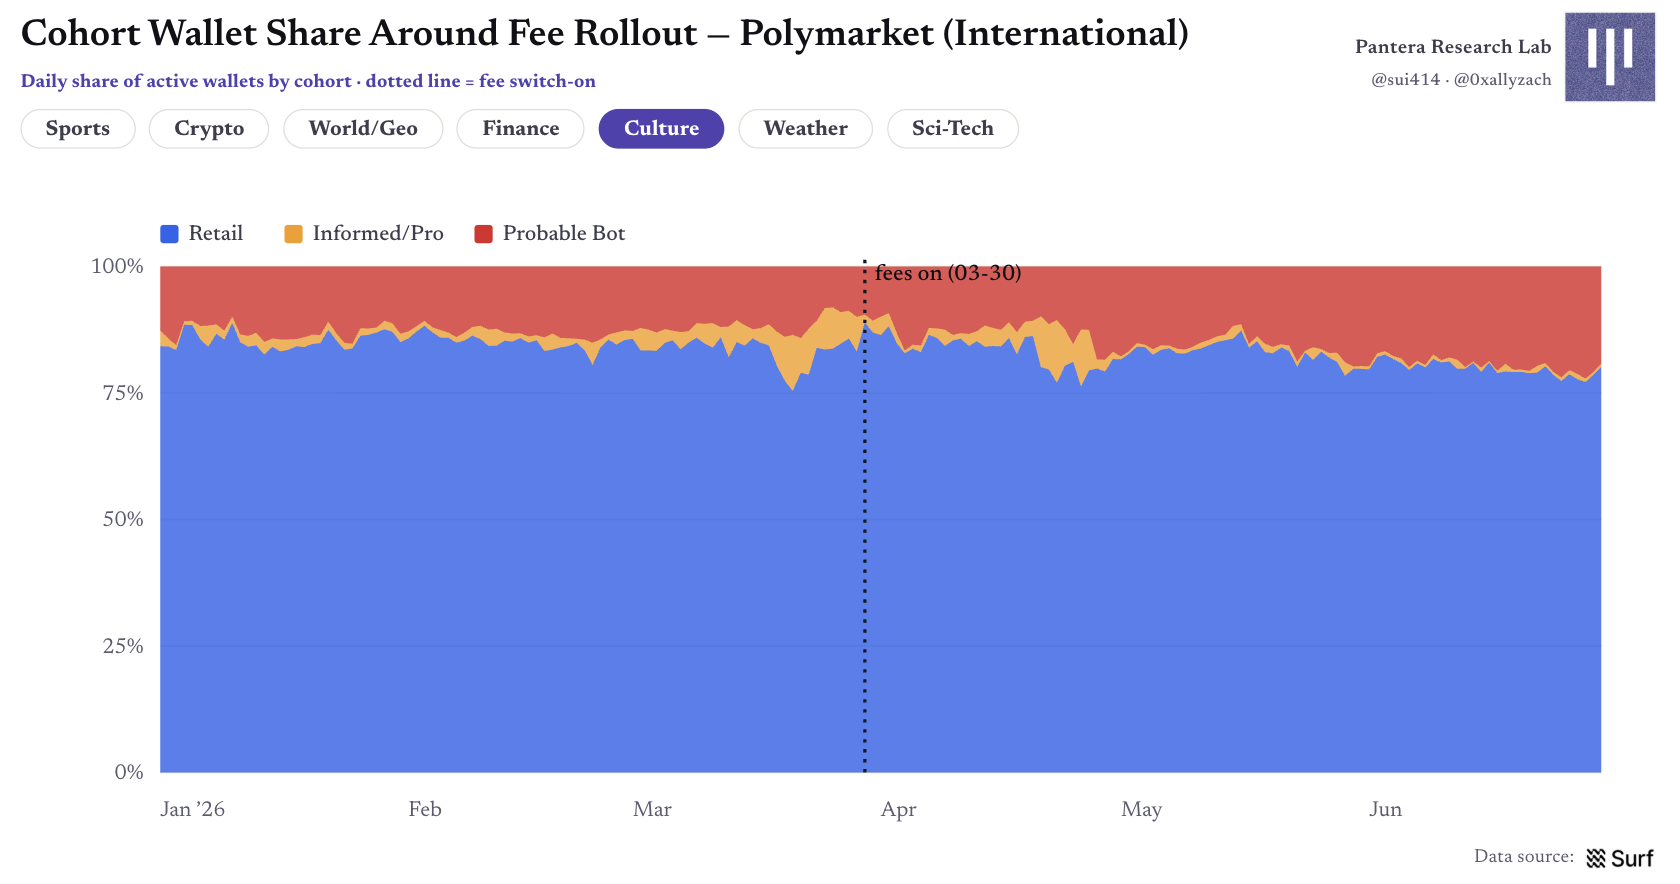
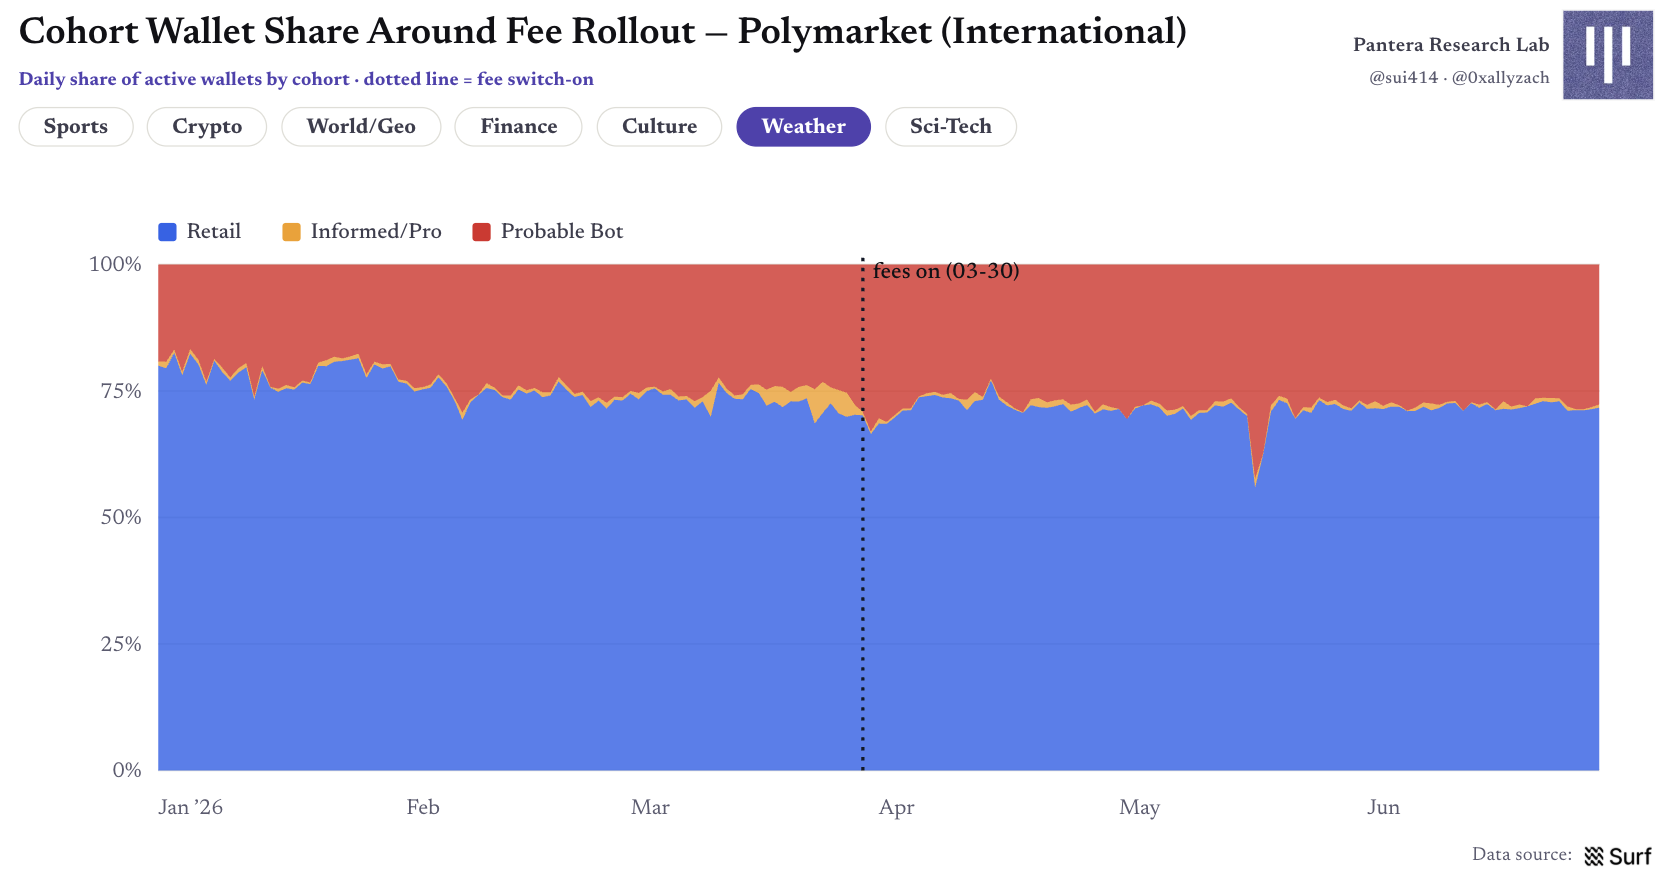
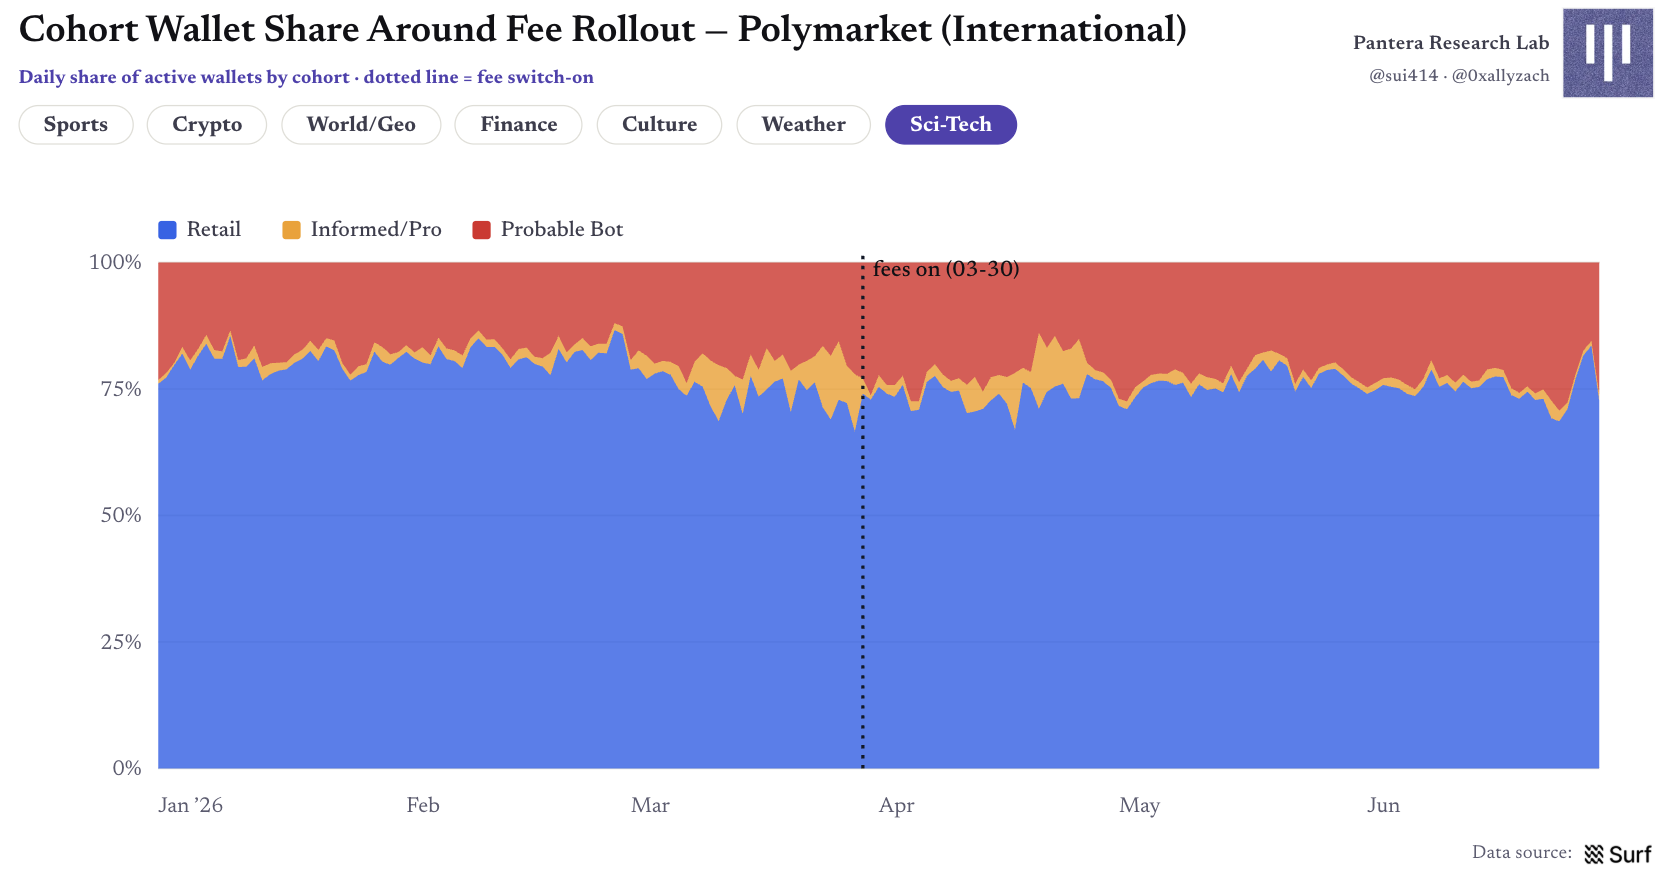
Figure 22 | Wallet share of each group before and after fees were introduced
Entry Timing: Most People Joined Late
In the lifecycle of a market, late entry is the norm, but the degree of lateness varies across different information games. Sports and crypto are most competitive regarding delays: the median entry time for all groups falls within the 92%—95% range of the market lifecycle, creating significant adverse selection pressure for retail users. Culture is about 85%—90%; in contrast, weather enters the earliest, with retail median at about 61% and robots at about 51%, consistent with the outcomes of markets where models can price early. The weather market also has the latest entry for professional users, with a median around 83%.
The entry timing analysis only includes markets with a fully visible lifecycle: those settled in the first half of the year and tracked wallets from the first transaction onward, including positions that had entered before 2026.
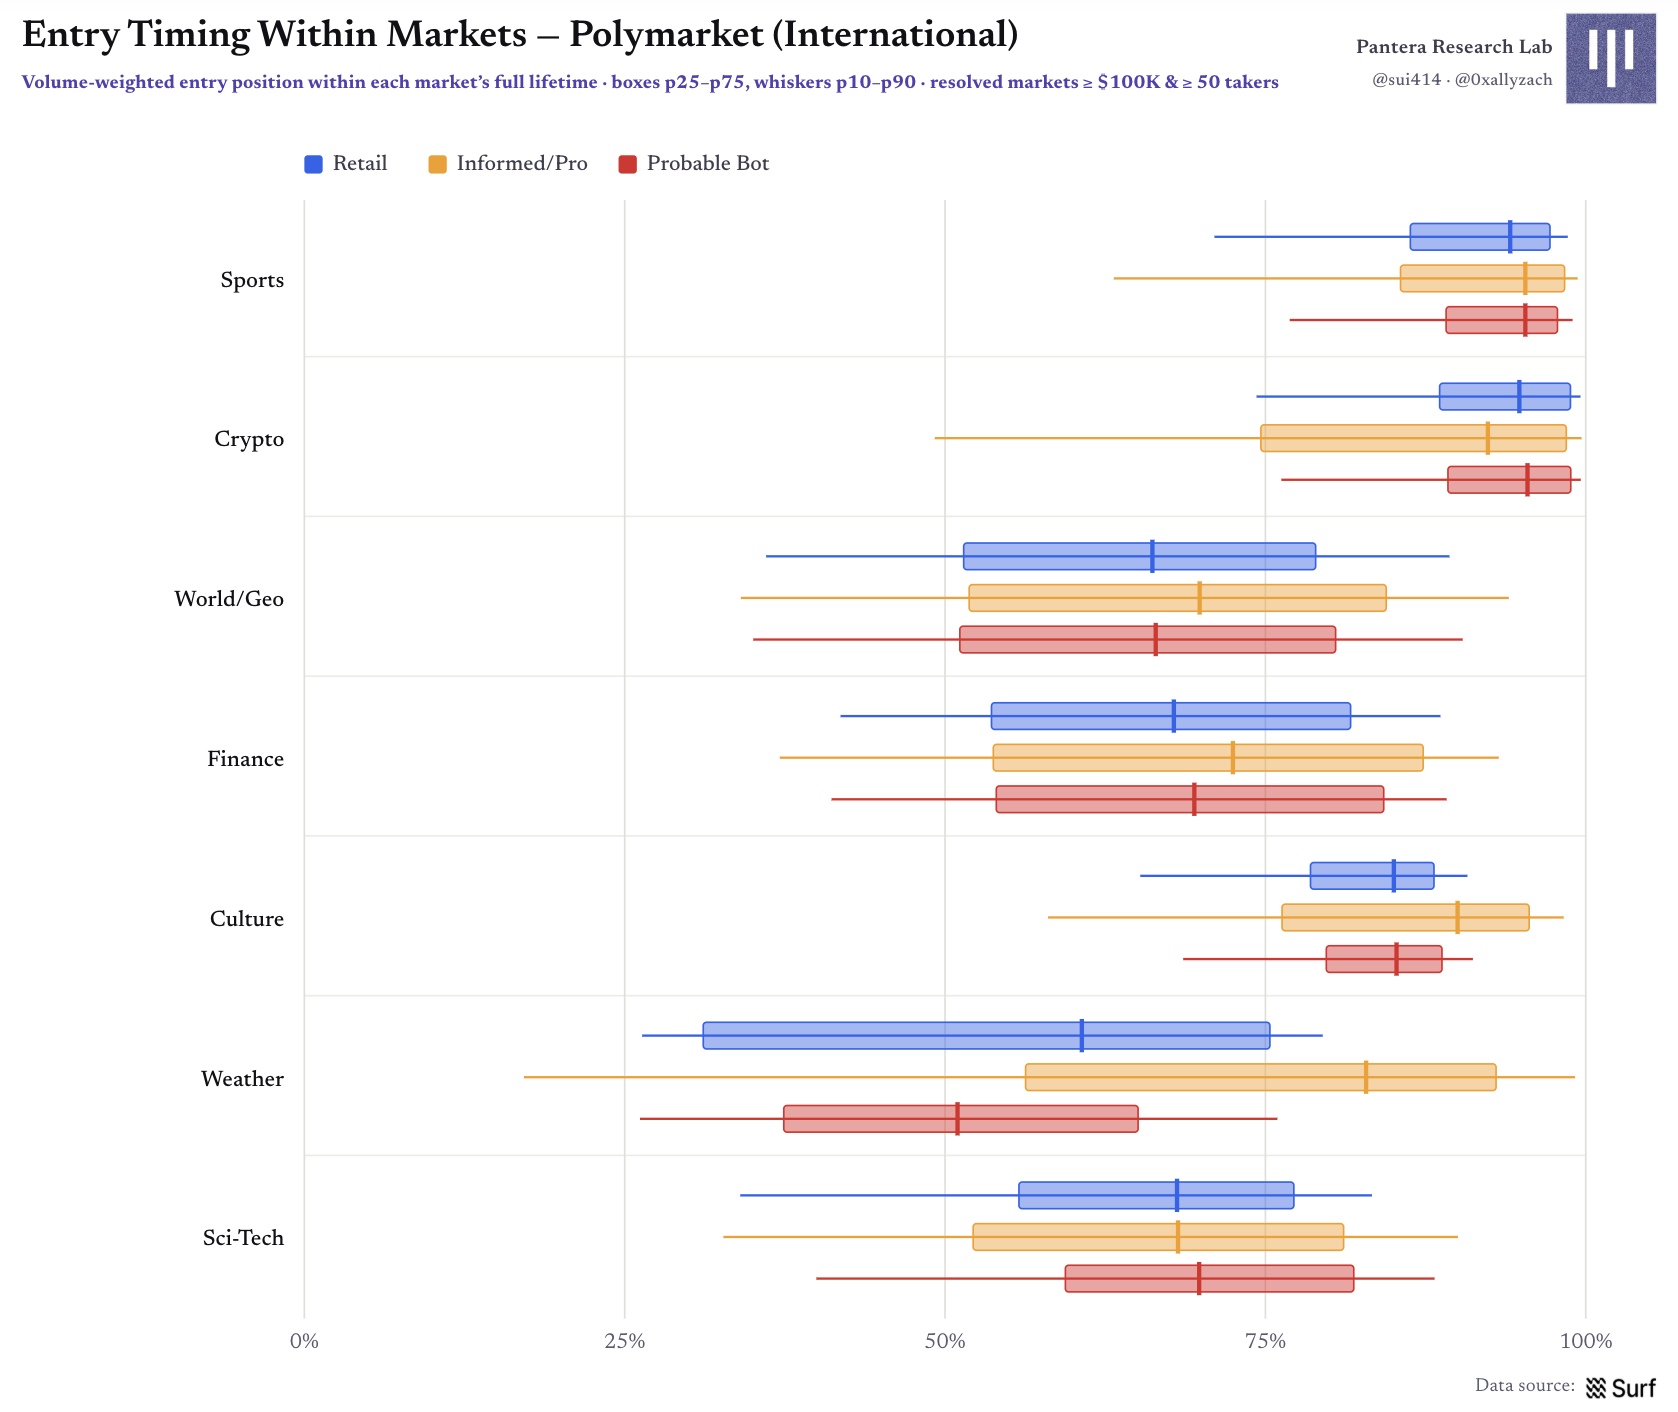
Figure 23 | Weighted entry positions of each group in the market lifecycle
The largest markets by trading volume in each category exhibit a more intuitive intraday rhythm: retail user trading often spans the entire market cycle; professional/informed users and robots are more likely to suddenly increase volume when information arrives, or to concentrate their bets close to settlement.
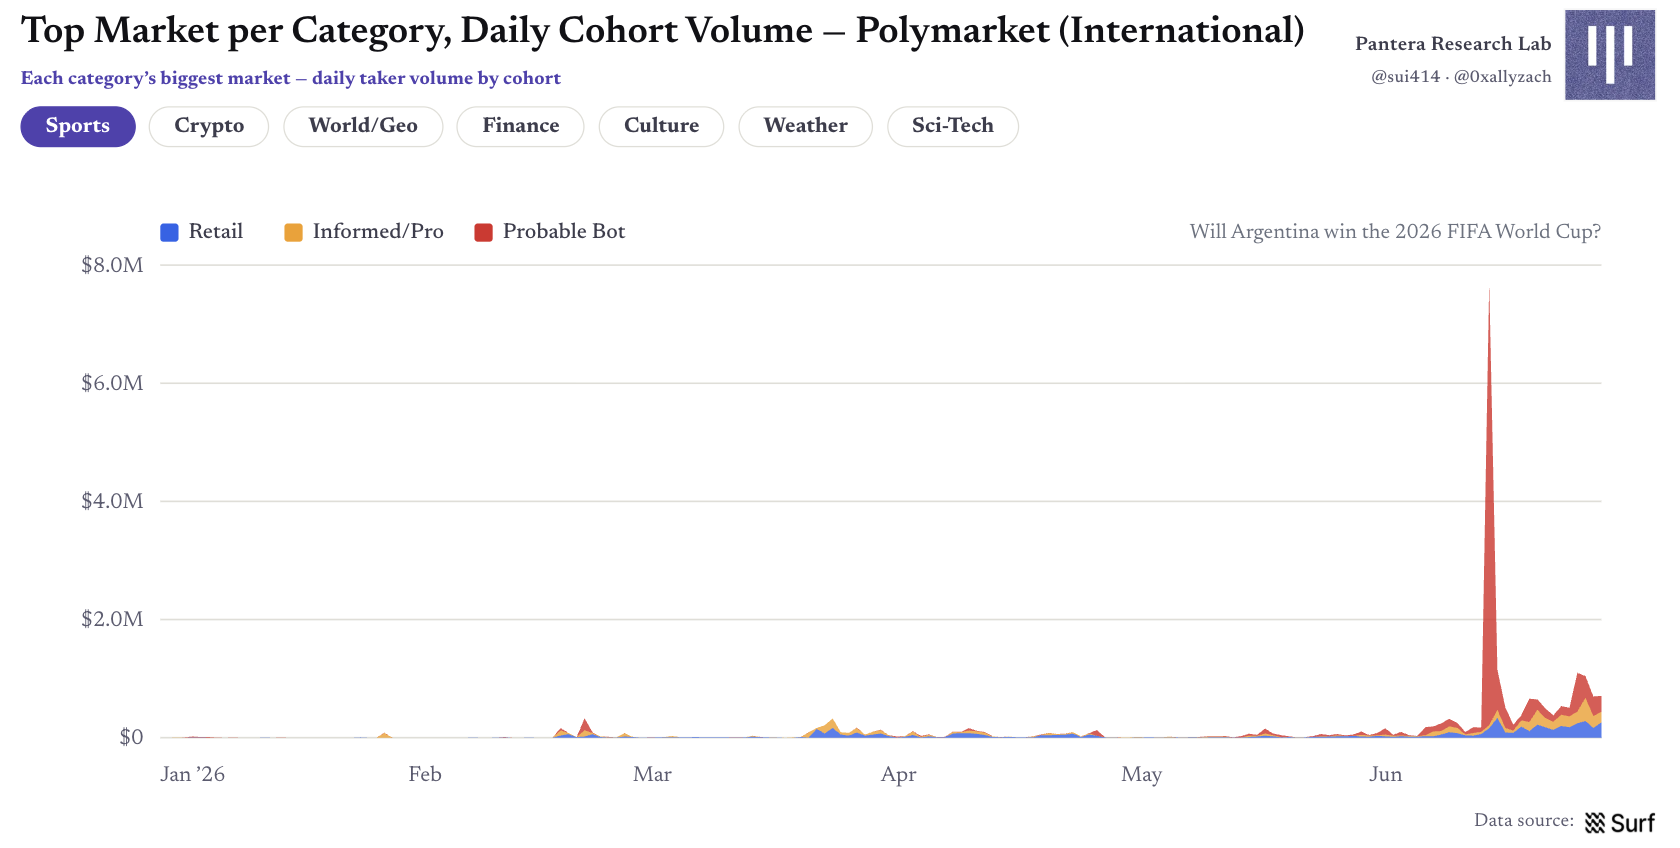
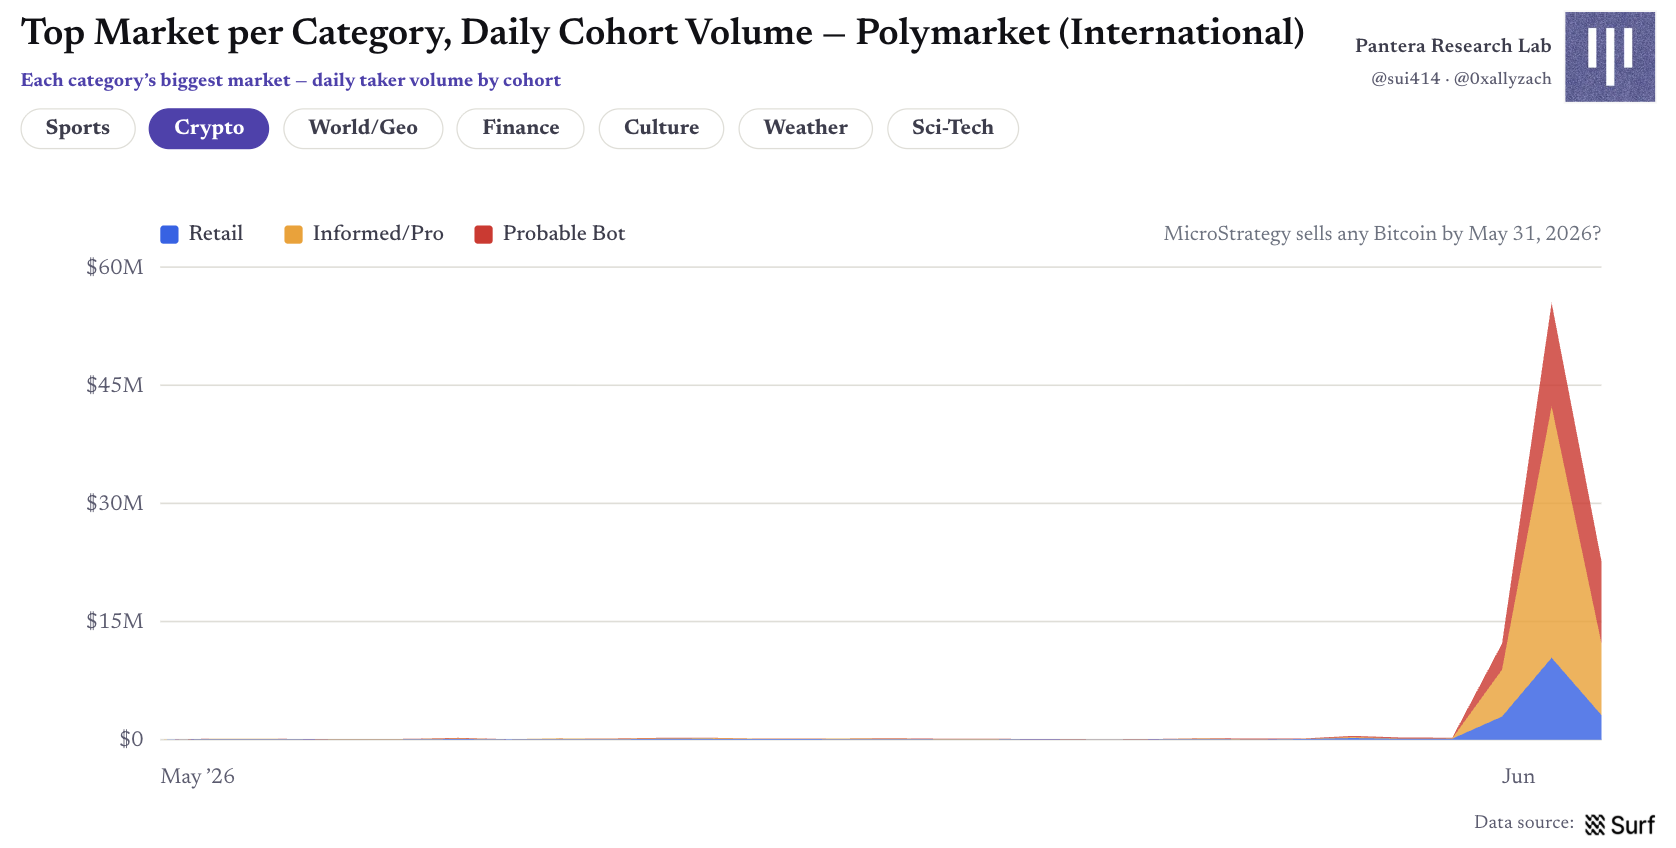
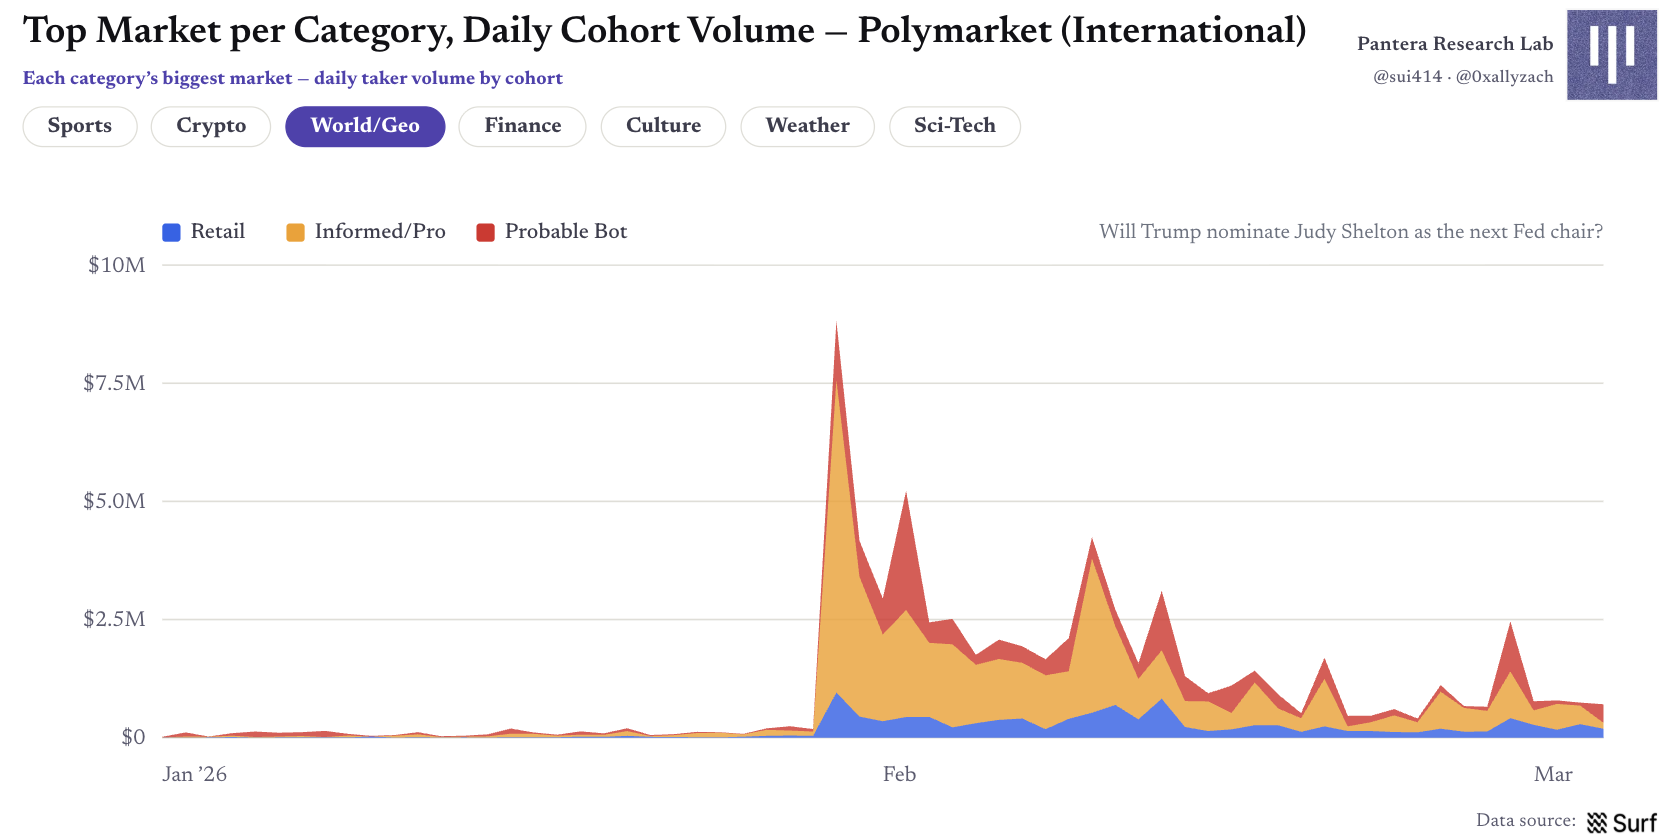
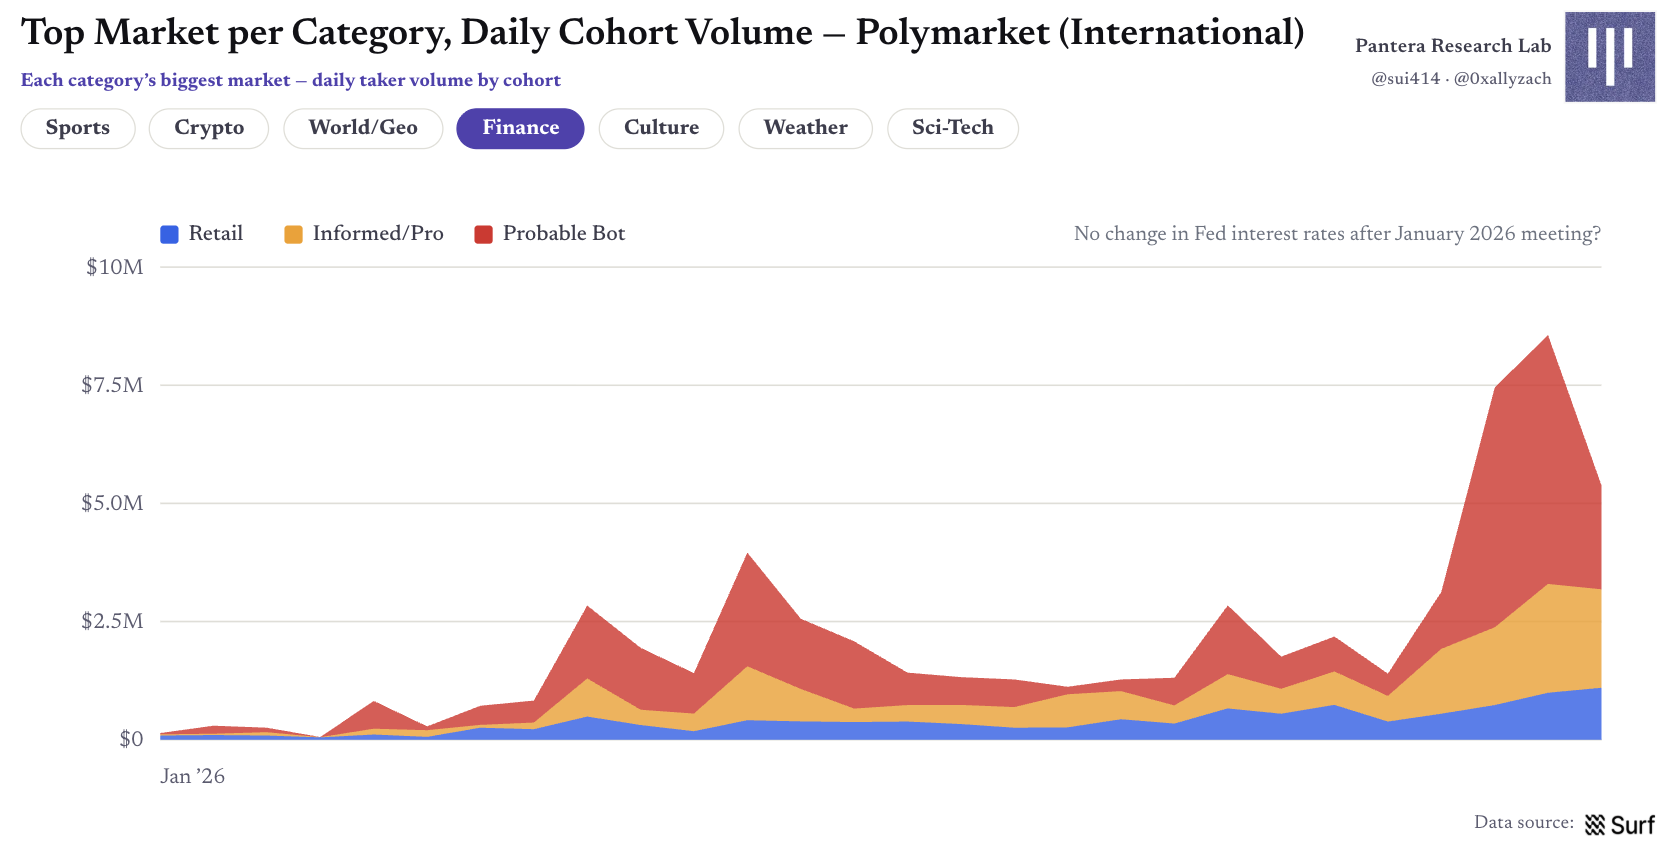
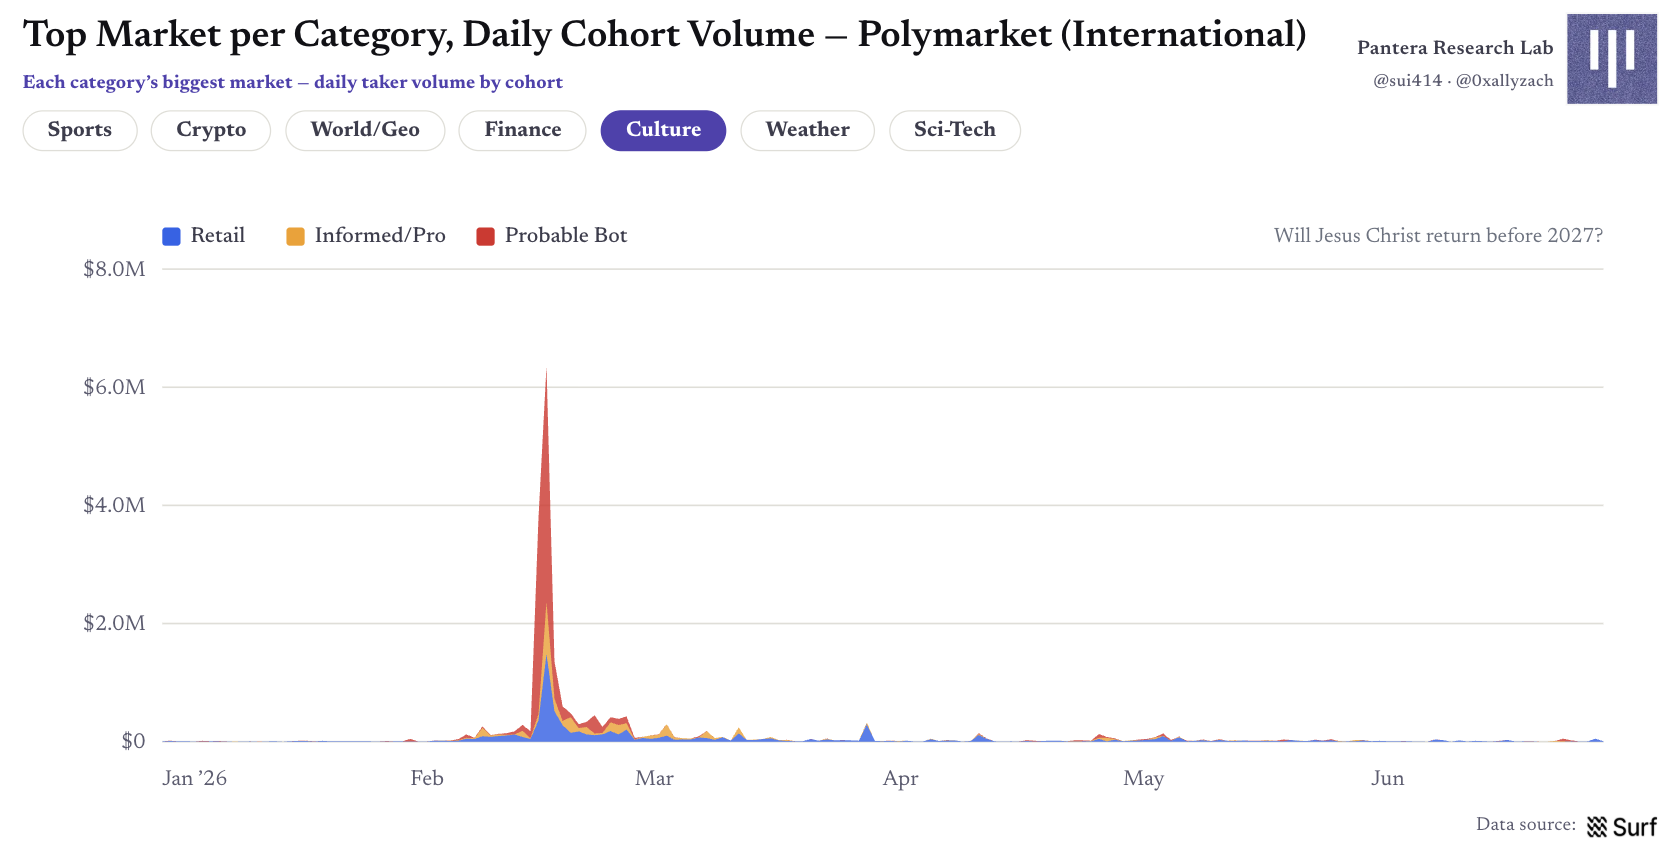
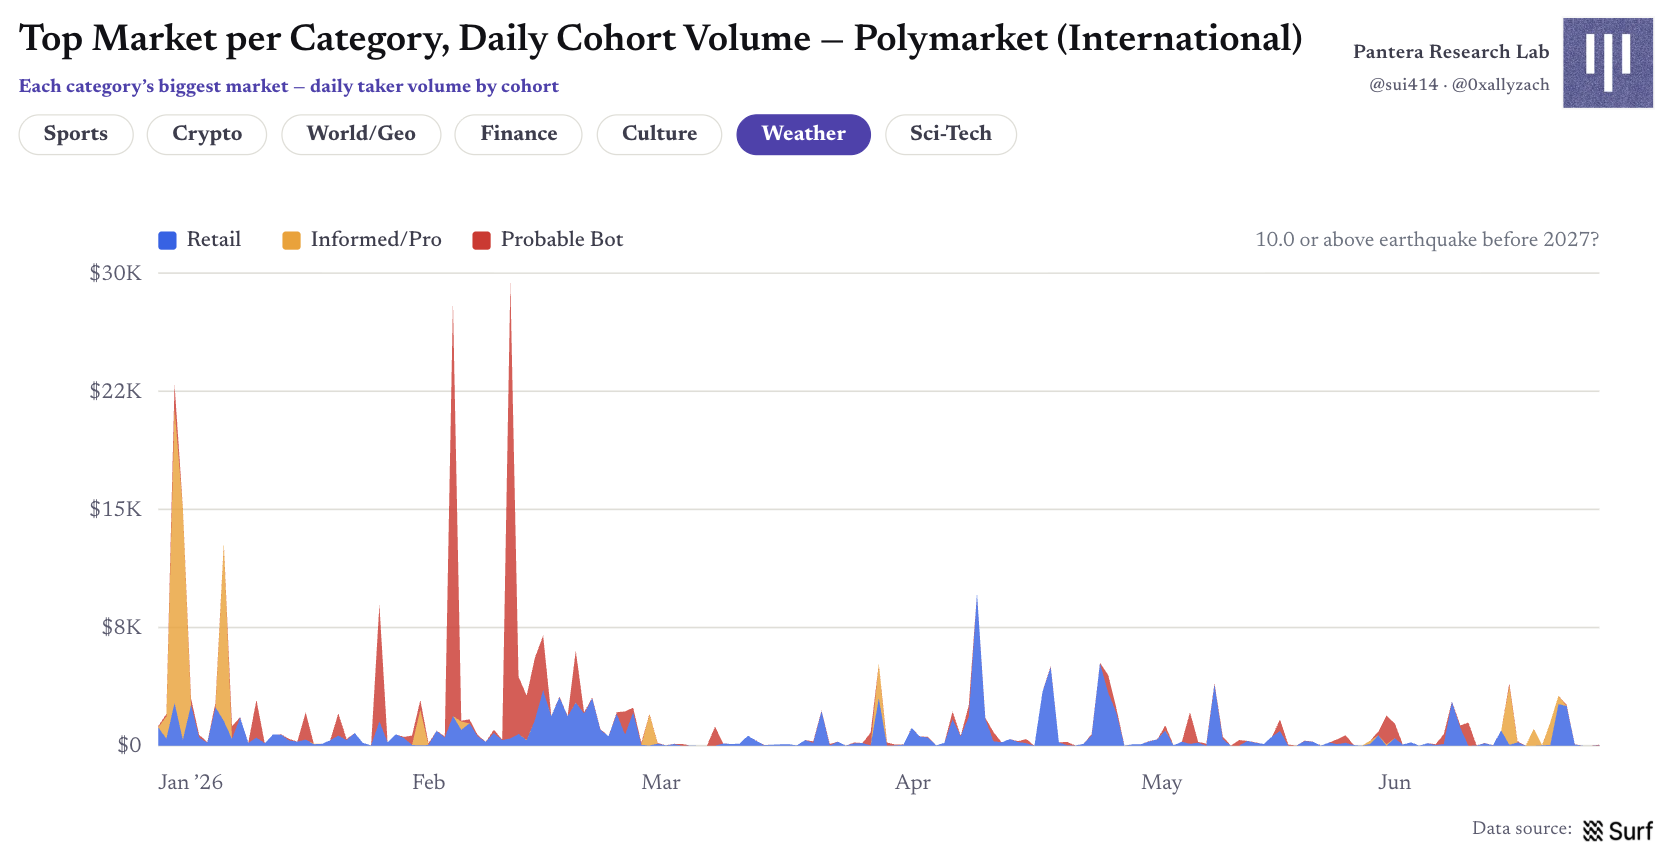
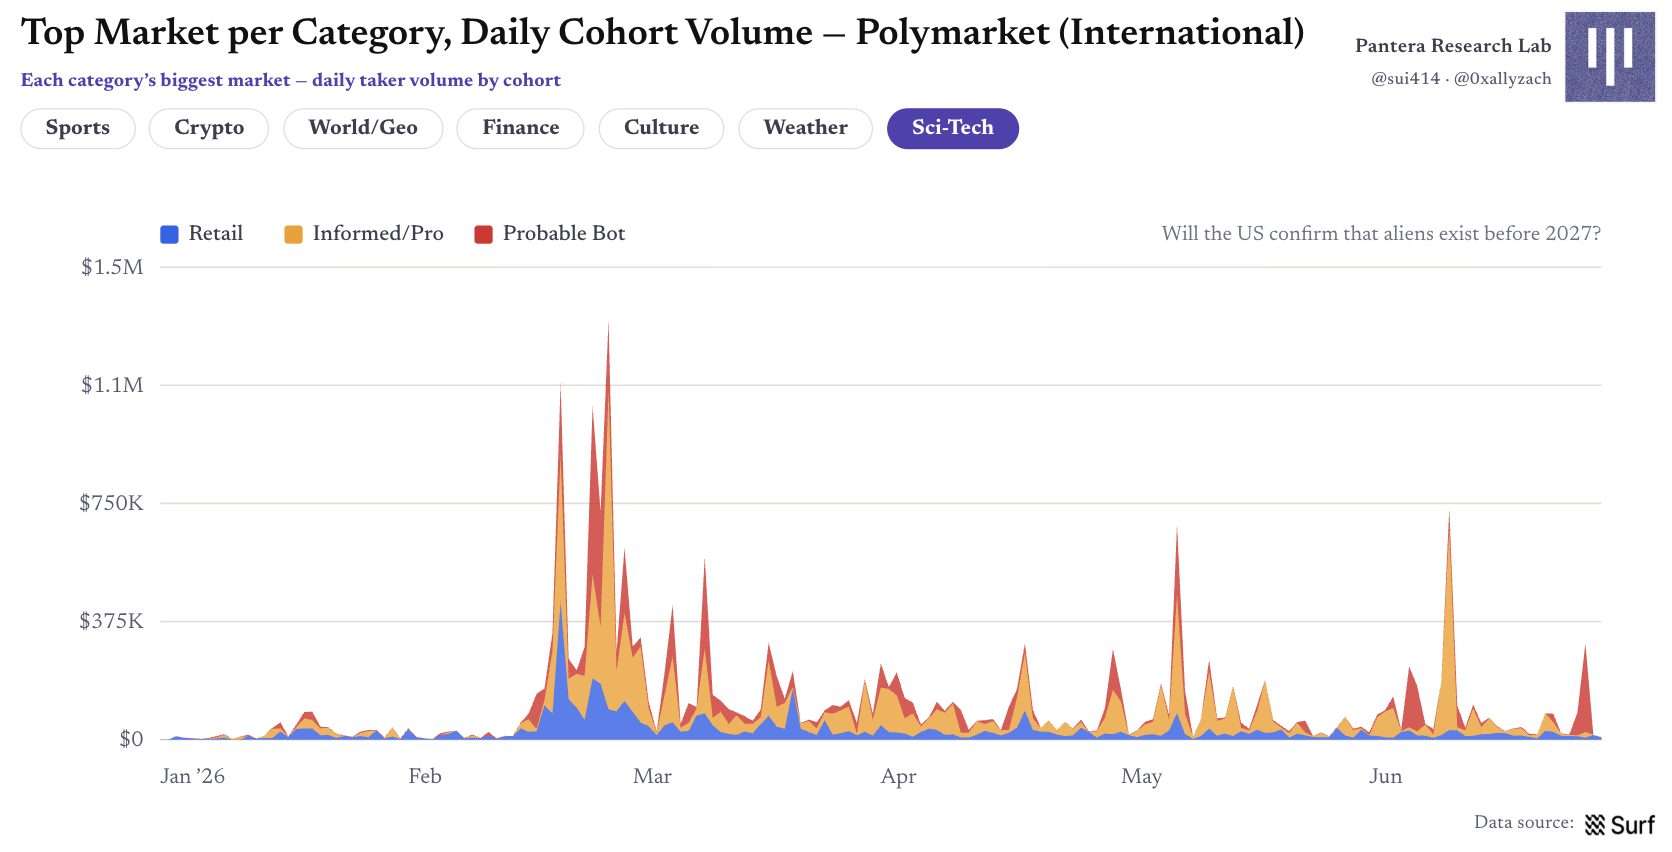
Figure 24 | Daily group trading volume in leading markets by category
Who Is Actually Making Money?
Summing up the cash flows from all positions settled in the first half, the pre-fee ledger approaches zero: of the approximately 1.97 million wallets with settled positions, 34% ended up positive. Big winners totaled approximately +$666 million, while big losers totaled approximately −$530 million, with all groups' net results near zero. This verifies that the calculated results represent the gross PnL before fees; subtracting around $184 million in fees in the first half would yield a negative aggregation.
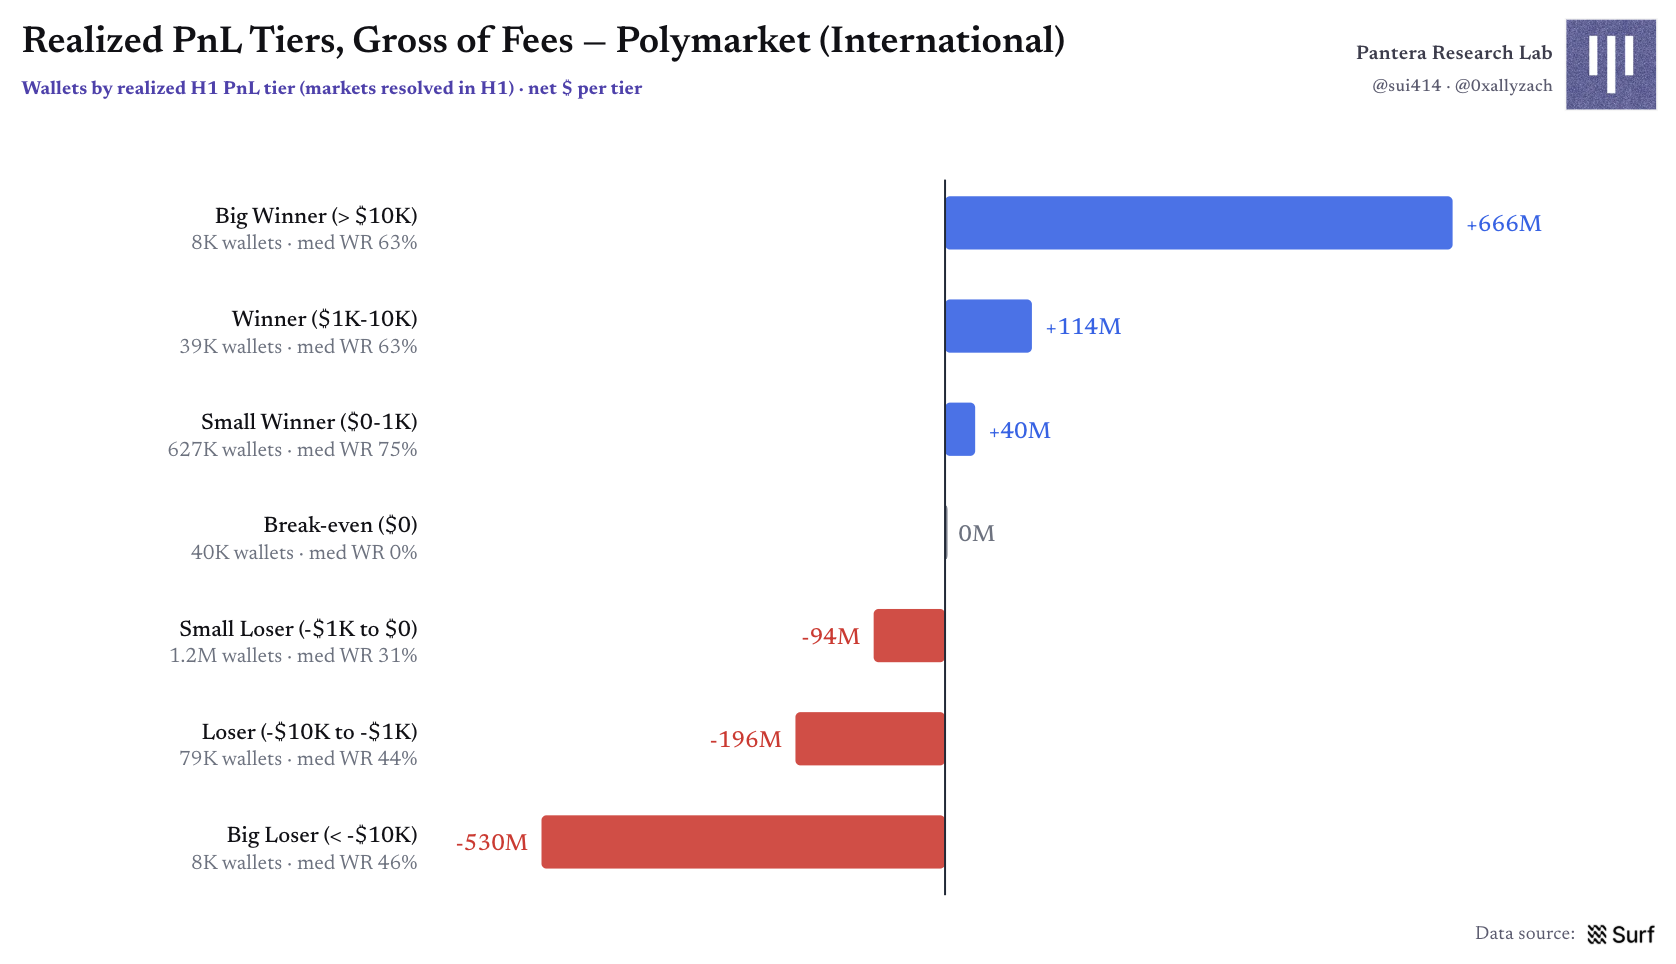
Figure 25 | Layered realized PnL before fees
Divided by groups, funding flows are quite clear: retail and professional users provide the counterparty for the positive earnings of the robot group. Robots are the only group overall net profitable, totaling approximately +$108 million, but only 27% of robot wallets are making money, and the median robot wallet is still at a loss. Profits are carried by a few large-scale operations, and sustained profitability is extremely rare.
Professional users have the highest hit rate for profitability, with about 42% of wallets being positive; retail around 35%, robots around 27%. However, professional users still overall face losses of about $26 million. Because this does not account for various incentives and rebates, we cannot definitively assert that professional users have a negative final net yield. The retail group collectively faces approximately −$74 million.
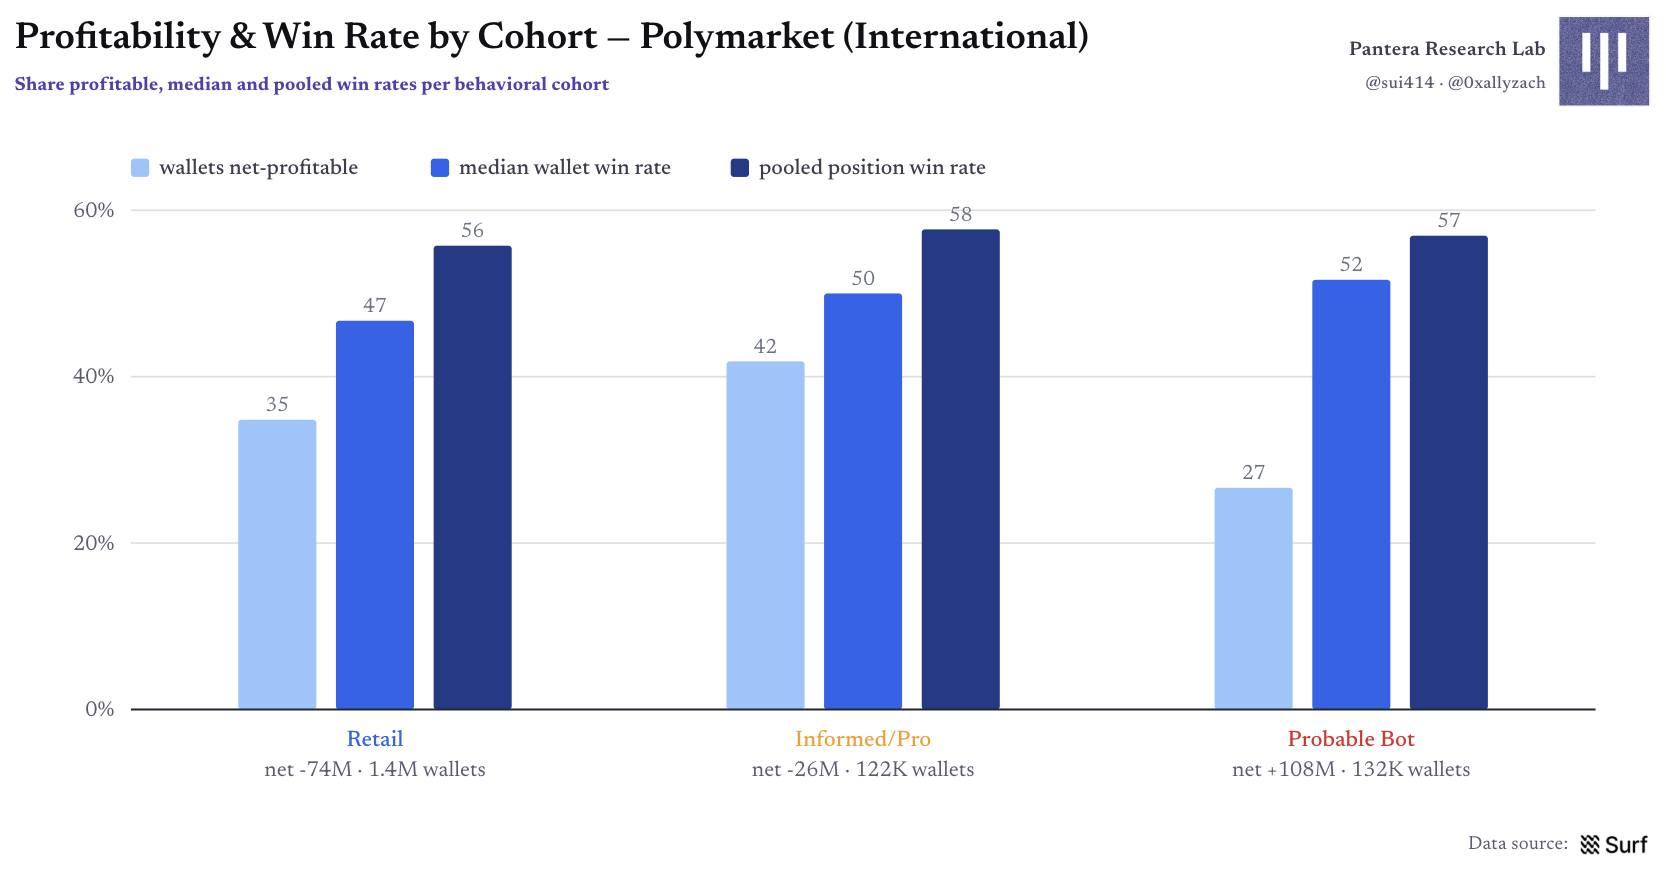
Figure 26 | Profit ratio and win rate by group
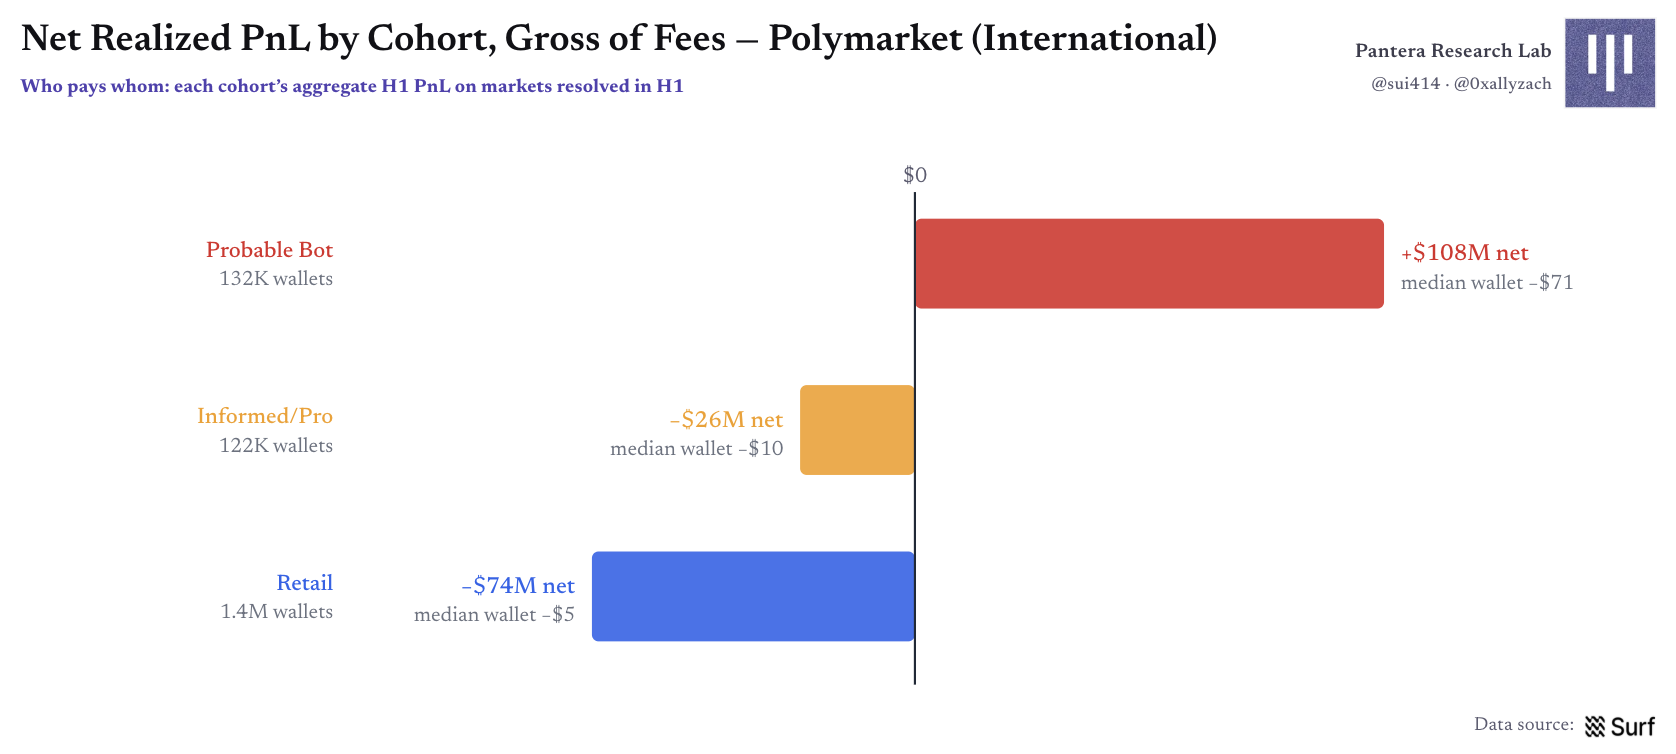
Figure 27 | Net realized PnL by group: who is paying, who is receiving
Of about 1.75 million wallets, only 146 wallets maintained positive cash flow for six consecutive months; even among wallets that had previously been profitable, more than 90% of profits were concentrated in a single month. Profitability in prediction markets resembles sporadic spikes rather than stable income flows.
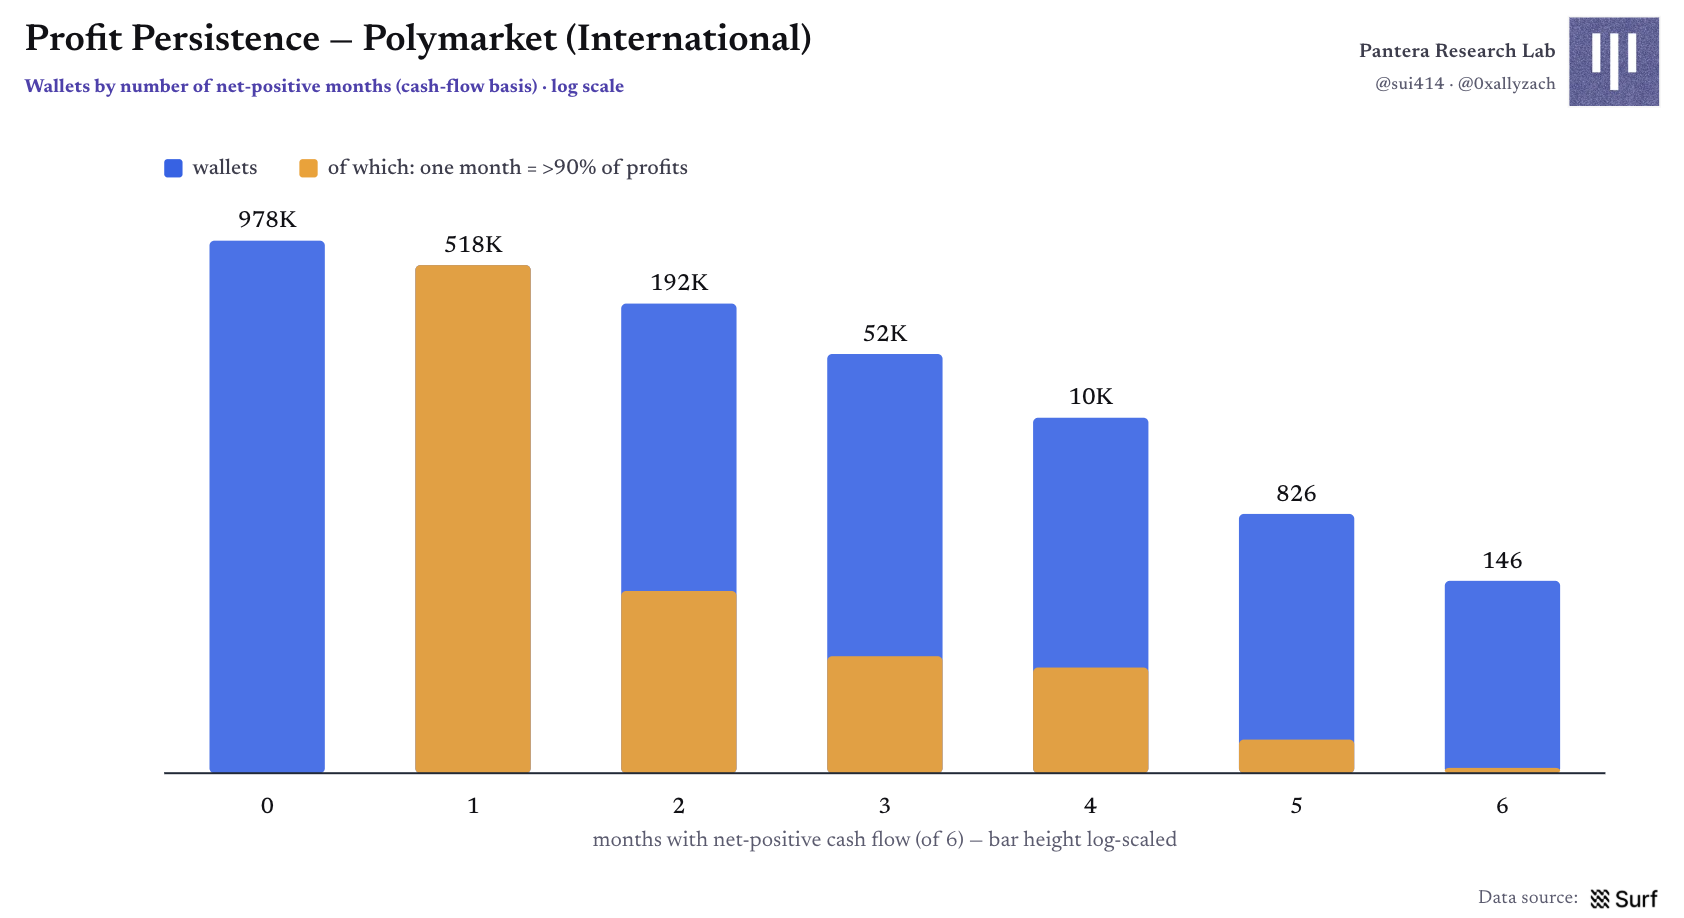
Figure 28 | Profitability Sustainability: Distribution of Consecutive Positive Cash Flow Months
Methods and Criteria:
Data for this article is calculated by Surf AI. PnL only accounts for markets settled in the first half of 2026 and calculates realized results before fees based on wallet cash flows in these markets; it does not include maker rebates, promotional incentives, and other planned subsidies in gross PnL. Group labels are heuristic classifications used for comparing trading styles and should not be interpreted as definitive identification of actual wallet owners.
免责声明:本文章仅代表作者个人观点,不代表本平台的立场和观点。本文章仅供信息分享,不构成对任何人的任何投资建议。用户与作者之间的任何争议,与本平台无关。如网页中刊载的文章或图片涉及侵权,请提供相关的权利证明和身份证明发送邮件到support@aicoin.com,本平台相关工作人员将会进行核查。


