What are the positions and strategies of the top 20?
Written by: KarenZ, Foresight News
If we view the fomo profit leaderboard as a performance table, looking only at the final numbers reveals who earned more, but it does not show whether these profits come from frequent trading or from a few large positions.
By putting together the number of trades, average positions, and profits per token of the top 20, we can see three different paths: Some gain hundredfold returns through early purchases, some use large capital to obtain absolute returns when the tokens have already attained high market values, and some look for opportunities through high-frequency trading, but ultimately, the account rankings are determined by one or two core positions.
As of the time of writing on September 4, the total PnL for the top 20 amounts to $82.3781 million, averaging $4.1189 million per person, with a median of $2.9120 million.
The top spot, Unipcs (Bonk Guy), earned $14.26 million, nearly 100 million RMB, accounting for 17.3% of the total PnL of the top 20.
Overview of the Top 20 in the fomo Profit Leaderboard
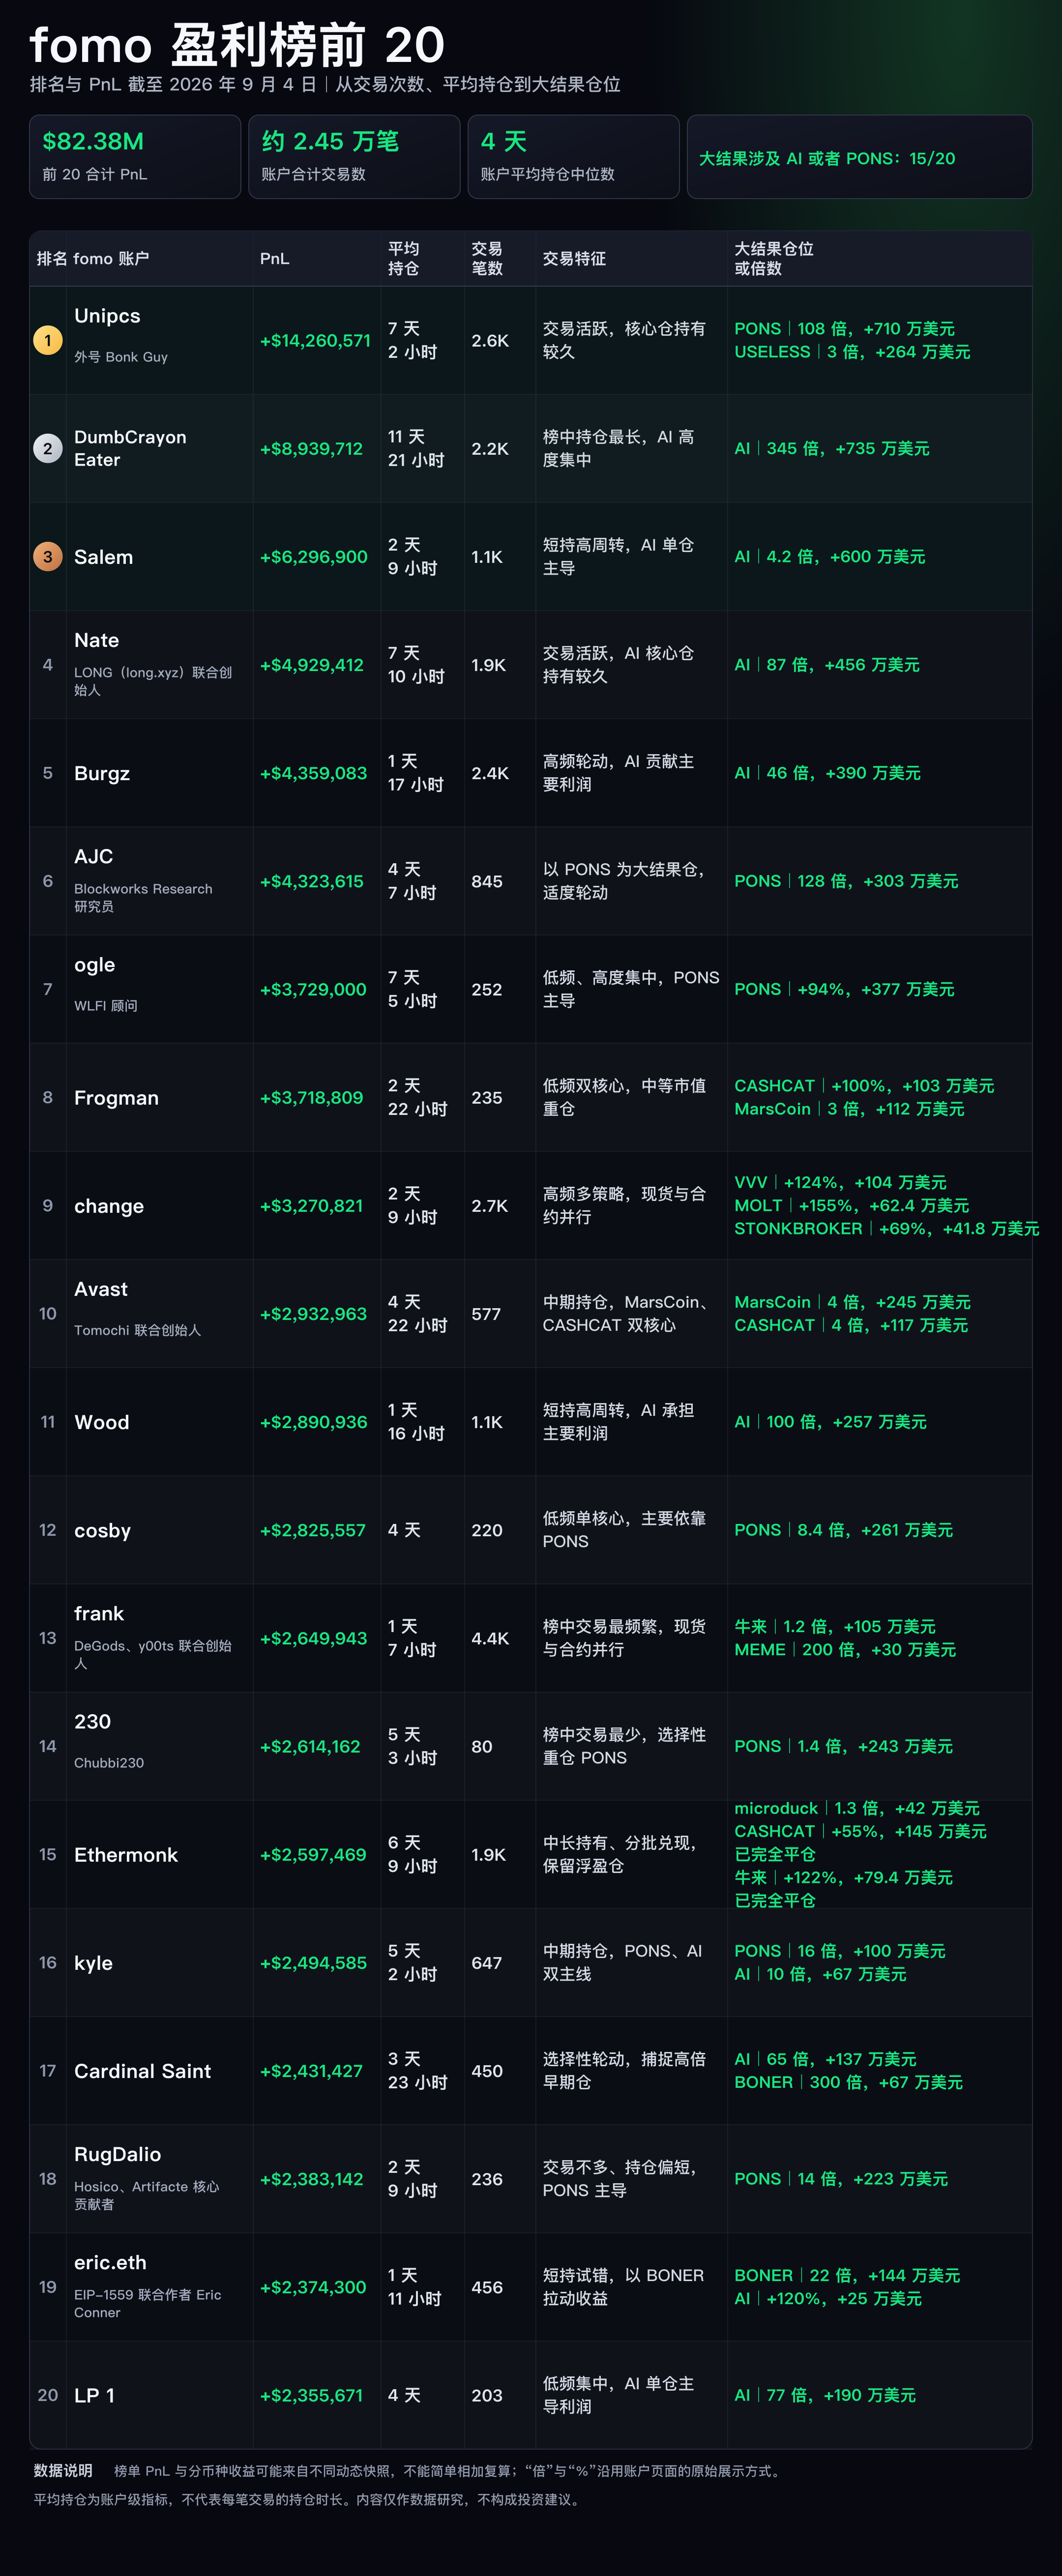
The 20 accounts collectively completed approximately 24,500 trades, with an average of about 1,225 trades per account, and the median number of trades is about 746. A simple average of the "average holding period" of each account results in about 4 days and 9 hours, with a median of 4 days. Here, we are reporting the account-level average, not weighted by the capital scale of each trade.
Commonality One: The leaderboard is propelled by a few "super positions"
The most typical case is Unipcs (Bonk Guy).
From July 15 to 17, Unipcs purchased approximately $67,495 worth of PONS in three transactions, with an average purchase market value of about $6.1 million. As of the time of writing, this portion of PONS is worth about $7.43 million, with a book profit of about 108 times. Just this core position explains why he has been in the top spot for a long time.
Besides PONS, Unipcs has a book profit of over 10 times on DELTA and microduck; positions in USELESS, MarsCoin, Basecat, and BOW (Longbow) also recorded about 1 to 3 times book profit. The characteristic is not to bet on just one token but to continue seeking secondary opportunities that can amplify returns beyond a super position.
Unipcs's average holding period still reaches 7 days and 2 hours, indicating that "more trades" and "core positions held longer" can coexist.
DumbCrayonEater is closer to the idea of "one position changing fate," with a total profit of $8.93 million. Among them, the AI position gained about 345 times, with profits of $7.35 million; the average holding period of the account reached 11 days and 21 hours, the longest among the top 20. Although its total number of trades also reached about 2,200, the decisive factor for the account's scale remains the AI, not the averaged distribution of profits over thousands of trades.
This concentration of profits is not an exception: the AI profit contribution for third-ranked Salem is about $6 million; for fourth-ranked Nate (co-founder of LONG), the AI profit contribution is about $4.56 million; Burgz has an AI contribution of about $3.90 million; Blockworks Research analyst AJC's PONS position achieved a profit multiple of 128 times, contributing $3.03 million in book profit; Wood's AI contribution is about $2.57 million; RugDalio's PONS contribution is about $2.23 million; LP 1's AI contribution is about $1.90 million. A rough comparison of the total PnL on the leaderboard shows that these core positions usually explain over 80% to 90% of the profits.
Salem's total PnL is $6.2969 million. He invested $9,913 when the AI's market value was about $370,000 and made multiple transactions early on; subsequently, even as the AI's market value rose to several million, tens of millions, and up to about $200 million, he continued to increase his position. After further adding to his holdings, his average purchase market value was raised to about $16.2 million, but AI still contributed about $6 million in profit, accounting for about 95% of his total PnL.
Nate's main profits also came from AI. Nate made his first purchase of about $773 when the AI's market value was less than $100,000; later, he accumulated multiple tokens during the period when the AI's market value rose to millions and tens of millions of dollars. The fomo account data indicates that he pooled around $50,000, with an average purchase market value of about $2.7 million, and the AI position's unrealized profit is about $4.56 million, accounting for about 92% of his total PnL.
WLFI consultant ogle ranks seventh. On July 14, he made his first purchase of $4,974 when PONS's market value was about $470,000, followed by transfers, receptions, capital increases, and reductions. Due to subsequent trading volumes far exceeding the initial purchase, his pooled investment is about $3.72 million, with an average purchase market value of about $15.7 million; as of the time of writing, PONS contributed about $3.77 million profit, accounting for over 99% of his total PnL.
Among the top 20, there are also those who accumulated results relying on multiple medium-leverage positions. Frogman's CASHCAT and MarsCoin contributed about $1.03 million (doubling) and $1.12 million book profit (3 times), respectively; Avast's MarsCoin and CASHCAT contributed about $2.45 million and $1.17 million (4 times), respectively; change contributed profits from VVV (124%), MOLT (155%), STONKBROKER (69%), and contract positions.
This set of differences indicates that "super positions" do not necessarily mean buying just one token. Its more accurate meaning is that most of the account's profits ultimately concentrate on one to three positions that significantly outperform other trades, rather than being averaged across all transactions.
Commonality Two: They are betting not just on tokens, but on ecosystem launch windows
Based on the major result positions in the table, at least 15 of the top 20 have substantial profits involving AI or PONS: AI appears in the major result positions of 9 accounts, while PONS appears in 7 accounts.
PONS, AI, and narratives like Robinhood Chain, launchpads, tokenized asset pairings, and trading fee backflow are closely related. Positions like CASHCAT, MarsCoin, and "Cattle Coming" represent traders' bets on the new narrative's popularity.
They may not belong to the same chain but share similar temporal characteristics: they are all in the phase of new ecosystems rapidly attracting funds and attention.
The leaderboard includes those who gained hundredfold returns through very early purchases and those who made large investments only after the tokens reached medium or even high market values. Unipcs, DumbCrayonEater, AJC, Wood, and Cardinal Saint further highlight the "high multiples from early pricing"; Frogman, Avast, cosby, and "230" stress more on "exchanging large capital for absolute returns after increased certainty."
Therefore, "early" does not necessarily mean buying in the first minute or the first day. More importantly, it involves completing research and establishing positions that match judgment when ecosystem liquidity, users, and attention have not been fully released. Extremely early buying increases potential multiples, while heavier later positions increase absolute profits, both of which might enter the leaderboard, but the risk structures are completely different.
Commonality Three: High frequency and long holding are not contradictory
When looking at the top 20 by trade number and average holding time, it becomes clear that "trade frequency" and "holding patience" are not on the same axis.
Frank is the most typical high-frequency account: about 4,400 trades, with an average holding time of only 1 day and 7 hours; change has about 2,700 trades, with an average holding period of 2 days and 9 hours; Burgz has about 2,400 trades, averaging 1 day and 17 hours. These accounts do exhibit fast rotation characteristics.
However, having many trades does not mean the core positions are necessarily held short. Unipcs has about 2,600 trades, yet the average holding time reaches 7 days and 2 hours; DumbCrayonEater has about 2,200 trades, with an average holding period even reaching 11 days and 21 hours; Nate has about 1,900 trades, with an average holding time of 7 days and 10 hours. They likely maintain core positions with real confidence while executing many peripheral trades.
On the other end are selective accounts. "230" has only 80 trades, while cosby, LP 1, Frogman, RugDalio, and ogle have approximately 220, 203, 235, 236, and 252 trades, respectively. Low frequency does not necessarily mean long-term holding: RugDalio's average holding time is only 2 days and 9 hours, while ogle reaches 7 days and 5 hours. The number of trades, average holding time, and position concentration must be considered together.
Therefore, the existing data can support descriptions such as "high-frequency rotation," "low-frequency concentration," and "core positions held long," but cannot directly prove that someone can consistently high sell low buy.
High frequency serves as a tool for them to look for opportunities or manage risks, while the major outcome positions are the core determining factor for rankings.
Commonality Four: Most significant results still remain on paper
Based on the currently confirmed position statuses, most of the significant results on the leaderboard still comprise unrealized gains and have not been fully cashed out.
Ethermonk is one of the few cases where redemption actions can be clearly observed. His CASHCAT has realized profits of about $1.45 million, with a return rate of about 55%; "Cattle Coming" has realized profits of approximately $794,000, with a return rate of about 122%, both positions have been completely closed. Meanwhile, he still holds a microduck position with unrealized profits of about $420,000, roughly 1.3 times.
This represents a more complete position management: closed positions are responsible for locking in profits, while open positions retain the potential for continued appreciation. Compared to looking solely at total PnL, this breakdown better reflects how much price risk the account still bears.
What does this leaderboard really teach us?
First, look at whether the ecosystem can continue to generate new value before examining specific tokens. When starting a new ecosystem, narratives and attention can bring the first batch of funds, but whether the heat can be sustained depends on observing actual income, trading volume, liquidity, and user growth. Only when these metrics are sustained can the logic of token value capture be further validated.
Second, valuations can be compared with similar projects. Looking at whether a token is valued at $10 million or $100 million, it is difficult to judge if it is expensive. A more effective method is to compare similar launchpads, meme leaders, or ecosystem tokens on other chains to see if there is any undervaluation.
Third, significant results require both low costs and sufficient positions. High multiples typically come from earlier buying positions, while high profits also depend on the invested scale.
Fourth, being optimistic does not mean never selling. It is possible to retain core positions that can determine account limits while also taking profits in stages during price increases to recover the principal. Ethermonk's completely closed CASHCAT and "Cattle Coming," contrasted with the still-held microduck, carry two different types of risk.
Fifth, the concentration of positions among top accounts reflects the formation of basic consensus. The top 20 often establish large positions around the same one or two tokens in succession, indicating that narratives and attention are indeed important clues for discovering opportunities; however, once this concentration appears on the leaderboard, the buying costs, potential multiples, and exit liquidity for later entrants may be completely different.
Finally, be aware of the survivor bias behind the leaderboard. Early buying, concentrated holdings, and long-term maintenance can produce hundredfold returns but may also lead to near-zero losses. The profit leaderboard only showcases accounts that succeed and remain at the forefront and cannot reliably infer that others employing the same strategies are universally profitable.
免责声明:本文章仅代表作者个人观点,不代表本平台的立场和观点。本文章仅供信息分享,不构成对任何人的任何投资建议。用户与作者之间的任何争议,与本平台无关。如网页中刊载的文章或图片涉及侵权,请提供相关的权利证明和身份证明发送邮件到[email protected],本平台相关工作人员将会进行核查。
