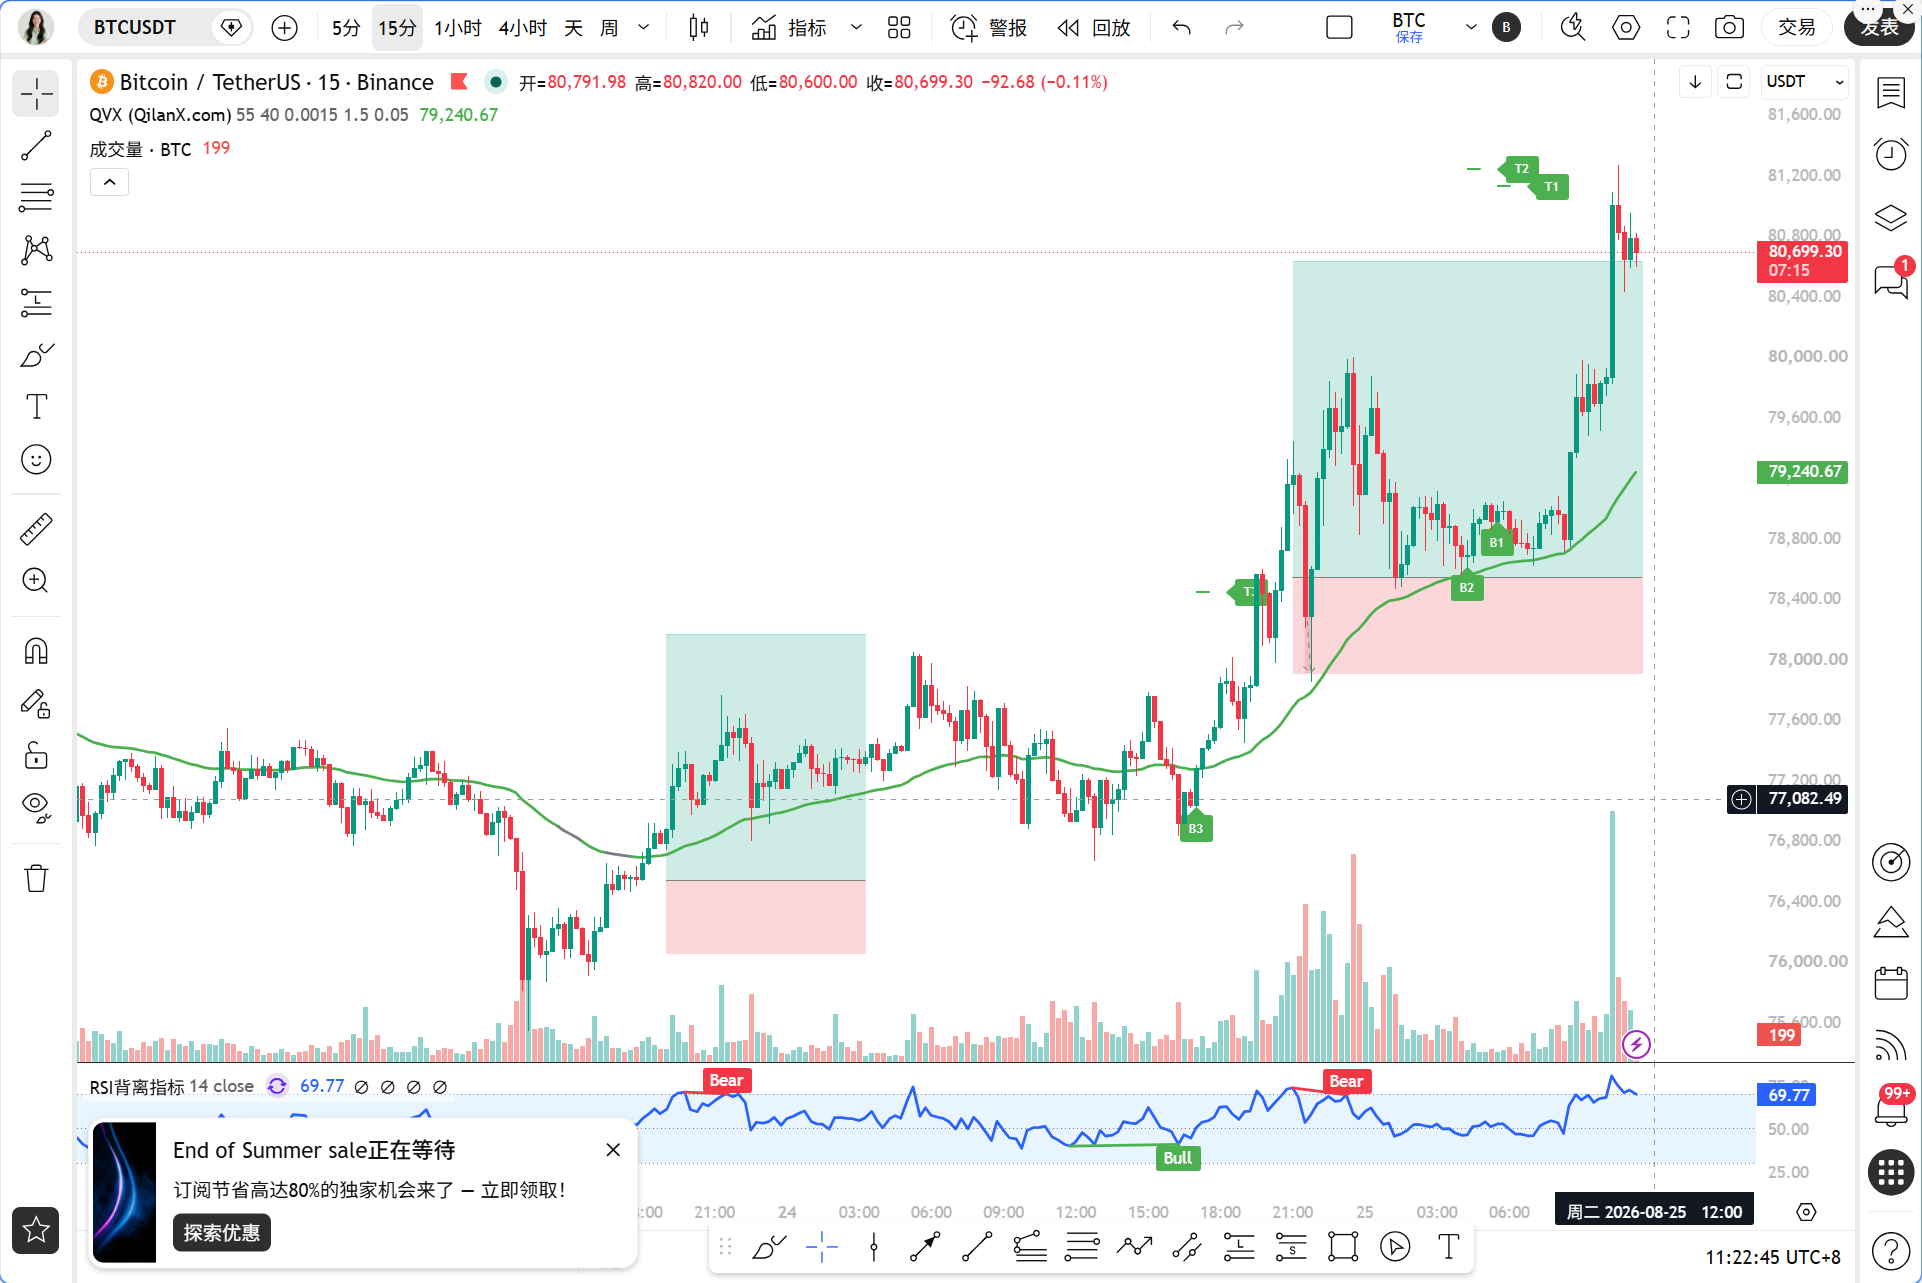
Dear teammates, the market this morning can be described in one sentence: those left out feel like they’ve broken their legs, and those chasing highs feel anxious. Bitcoin has finally climbed back above the critical psychological level of 80,000 USDT after a hiatus of 101 days, with the latest quote around 80,706 USDT. The core catalyst driving this wave of increase is the news about the trillion-dollar US Treasury bond repurchase plan. The market directly interprets it as a liquidity easing expectation similar to QE, leading capital to pour into risk assets like sharks smelling blood, pushing both gold and Bitcoin higher simultaneously. Meanwhile, cryptocurrency-related stocks in the US markets are also collectively buzzing, with BitMine leading the increase of over 7%. This situation of stock-coin correlation indeed verifies that market enthusiasm has returned.
However, the more this is the case, the more I want to remind everyone to stay calm. Because behind this wave of frenzy, the total liquidation amount across the network in 24 hours reached a staggering 378 million USD, with the largest single loss in ETH hitting 6.86 million USD. What does this indicate? It indicates that leveraged funds in the market are extremely excited, and any slight movement could trigger severe volatility. Moreover, regarding the US Treasury bond repurchase, some voices point out that the actual available funds in the TGA account are only 200 billion, which may face liquidity withdrawal risks later. Therefore, whether this wave of increase is a trend reversal or an emotional impulse, we need to analyze it carefully with data.
Current Price and Time
It is now August 25th at 11:23 AM, BTC is quoted at 80,706 USDT, with a 24-hour increase of 4.73%. The Fear and Greed Index has reached 74, indicating a clear greedy zone. BTC’s market share remains at 59.33%, showing that this wave of market activity is still led by BTC, but ETH's unusual movements are worth our close attention.
Multi-Cycle Status Overview
First, let’s look at the long-term cycle. On the daily level, the MACD bullish momentum remains strong, with DIF at 3901, DEA at 2215, and the red histogram still expanding, while the moving average system shows a perfect bullish arrangement. However, the RSI has skyrocketed to 90.46, which is an extremely overbought signal; historically, this position often indicates that a technical pullback could occur any time soon, but the extent and duration of the pullback will depend on whether subsequent funds continue to flow in.
Next, looking at the 4-hour level, the situation becomes a bit subtle. Although the price has hit a new high, the MACD histogram is negative, with DIF at 1893, DEA at 1991, indicating a clear bearish divergence structure. This suggests that the upward momentum on the 4-hour level is actually waning; the price is at a new high while the indicators have not followed suit, which is a typical warning signal of stagnation. The RSI is at 68.88, which still has some space compared to the daily level, but it’s also not cheap anymore.
At the 1-hour level, we currently have standard strong characteristics. The MACD dual lines are operating above the zero axis, with DIF at 669, DEA at 514, and the red histogram is gently expanding. RSI is at 73.76, although relatively high, is not at an extreme value yet. EMA55 is at 78,212, and the price is already diverged by 3.19% from this moving average, indicating a considerable amount of short-term profit taking.
At the 15-minute level, the RSI has reached 75.05, indicating a need for short-term pullback. MA5 is at 80,797, MA10 at 80,285, and MA30 at 79,386. The short-term moving average system is still in a bullish arrangement, but there is short-term pressure around the 80,800 price area.
TPV Signal Verification
Now let’s use the Qinglan TPV system to verify the current long and short status. First, let's look at trend positioning; the current price is 80,706, which is far above the 1-hour EMA55 at 78,212, and the closing prices of the past eight 1-hour candlesticks have all been above the EMA55, with crossing occurrences of 0. According to the system rules, this clearly does not meet the conditions for oscillation and belongs to an unmistakable unidirectional bullish trend area.
So, are the conditions for going long satisfied? First, the price has stabilized above EMA55, with two consecutive 1-hour candlestick closes above EMA55; this condition is fully met. Second, support is stabilizing; currently, the price is in a unidirectional rising phase without any significant pullback actions, so this condition has not yet been triggered and is in a chasing high state. Third, the downward momentum is weak; the condition for the MACD histogram to shorten over two periods is currently not met, as the red histogram is still expanding and the RSI has not experienced a recovery process from a low position.
Therefore, the TPV system's conclusion is very clear: the trend is bullish, but the current situation is not a standard entry point for buying in the system. Because the system requests a buying opportunity after a stabilizing pullback rather than chasing highs. If you enter now, it constitutes an emotional trade, which is not within the system rules. My advice is to prefer missing out rather than making mistakes, wait for pullback confirmation before entering, as the win rate will be much higher.
On-chain Funding Situation
On the funding front, the quasi-QE expectation from the US Treasury bond repurchase is the core driver of this wave of market activity, but we need to be clear that this expectation has the risk of being falsified. The actual available funds in the TGA account are only 200 billion, and if future liquidity injections fall short of expectations, the logic behind this rally will be shaken. In addition, BitMine has increased its holdings by 32,000 ETH in a week, with total holdings approaching 5.85 million, indicating that institutions have a clear long-term confidence in ETH. Tom Lee has also declared that an ETH weekly increase of 30% is a historic initiation signal, suggesting a potential further increase of 170%. Yi Li Hua has publicly shown optimism, stating that the rebound strength of ETH will exceed that of BTC. These combined signals indicate that funds are flowing from BTC to ETH, meaning that the altcoin season may be on the way.
Key Support and Resistance Levels
The first resistance level above is at 81,000 USDT, which is the lower edge of a previously dense trading area; a breakthrough will target 82,500 USDT. The first support level below is at 79,500 USDT, which is near the 1-hour MA10, and is also the division point for short-term bulls and bears. The second support level is at 78,200 USDT, corresponding to the 1-hour EMA55. As long as this level does not break, the bullish trend remains valid. If it breaks below 78,200, then this wave of increase will need to be reassessed.
Trading Strategy
The direction is mainly to buy on pullbacks, but do not chase highs.
Entry Conditions: Wait for the price to pull back to the 79,500 to 79,000 range, and simultaneously a long lower shadow on the hourly level or a bottoming structure appears, and the MACD histogram begins to shorten; only when these three conditions are met, then enter. If the price directly breaks above 81,000 and stabilizes, a small position can be taken to chase long, but the stop-loss needs to be tightened.
Stop-Loss Setting: If making a pullback buy order, set the stop loss below 78,200, which is below EMA55, around 78,000. If making a breakthrough buy order, set the stop loss below the key level of 80,000.
Target Levels: The first target is at 82,500, the second target is at 84,500. If ETH experiences a compensatory rally, consider buying ETH to hedge against BTC’s risk, or switch directly to long ETH positions due to ETH's greater elasticity.
Position Management: It is recommended to control the risk of a single transaction to be within 2% of the total account capital; do not blindly leverage just because the market is good. Remember, living longer is more important than making money quickly.
Risk Warning
The current daily RSI 90 overbought state and 4-hour top divergence structure imply that a big bearish candle may appear at any time to correct the indicators; the risk of chasing highs is extremely high, so position control is essential.
Follow Qinglan's Crypto Classroom to grasp more trading opportunities! Welcome to visit the official website www.qinglan.org
📊 Qinglan TPV Trading Strategy Backtest Reference
🕒 Last Backtest Time 08-25 07:00:02
Total Analysis: 3688 Backtests: 3685 Accuracy: 79.8% (2939/3685)
免责声明:本文章仅代表作者个人观点,不代表本平台的立场和观点。本文章仅供信息分享,不构成对任何人的任何投资建议。用户与作者之间的任何争议,与本平台无关。如网页中刊载的文章或图片涉及侵权,请提供相关的权利证明和身份证明发送邮件到support@aicoin.com,本平台相关工作人员将会进行核查。