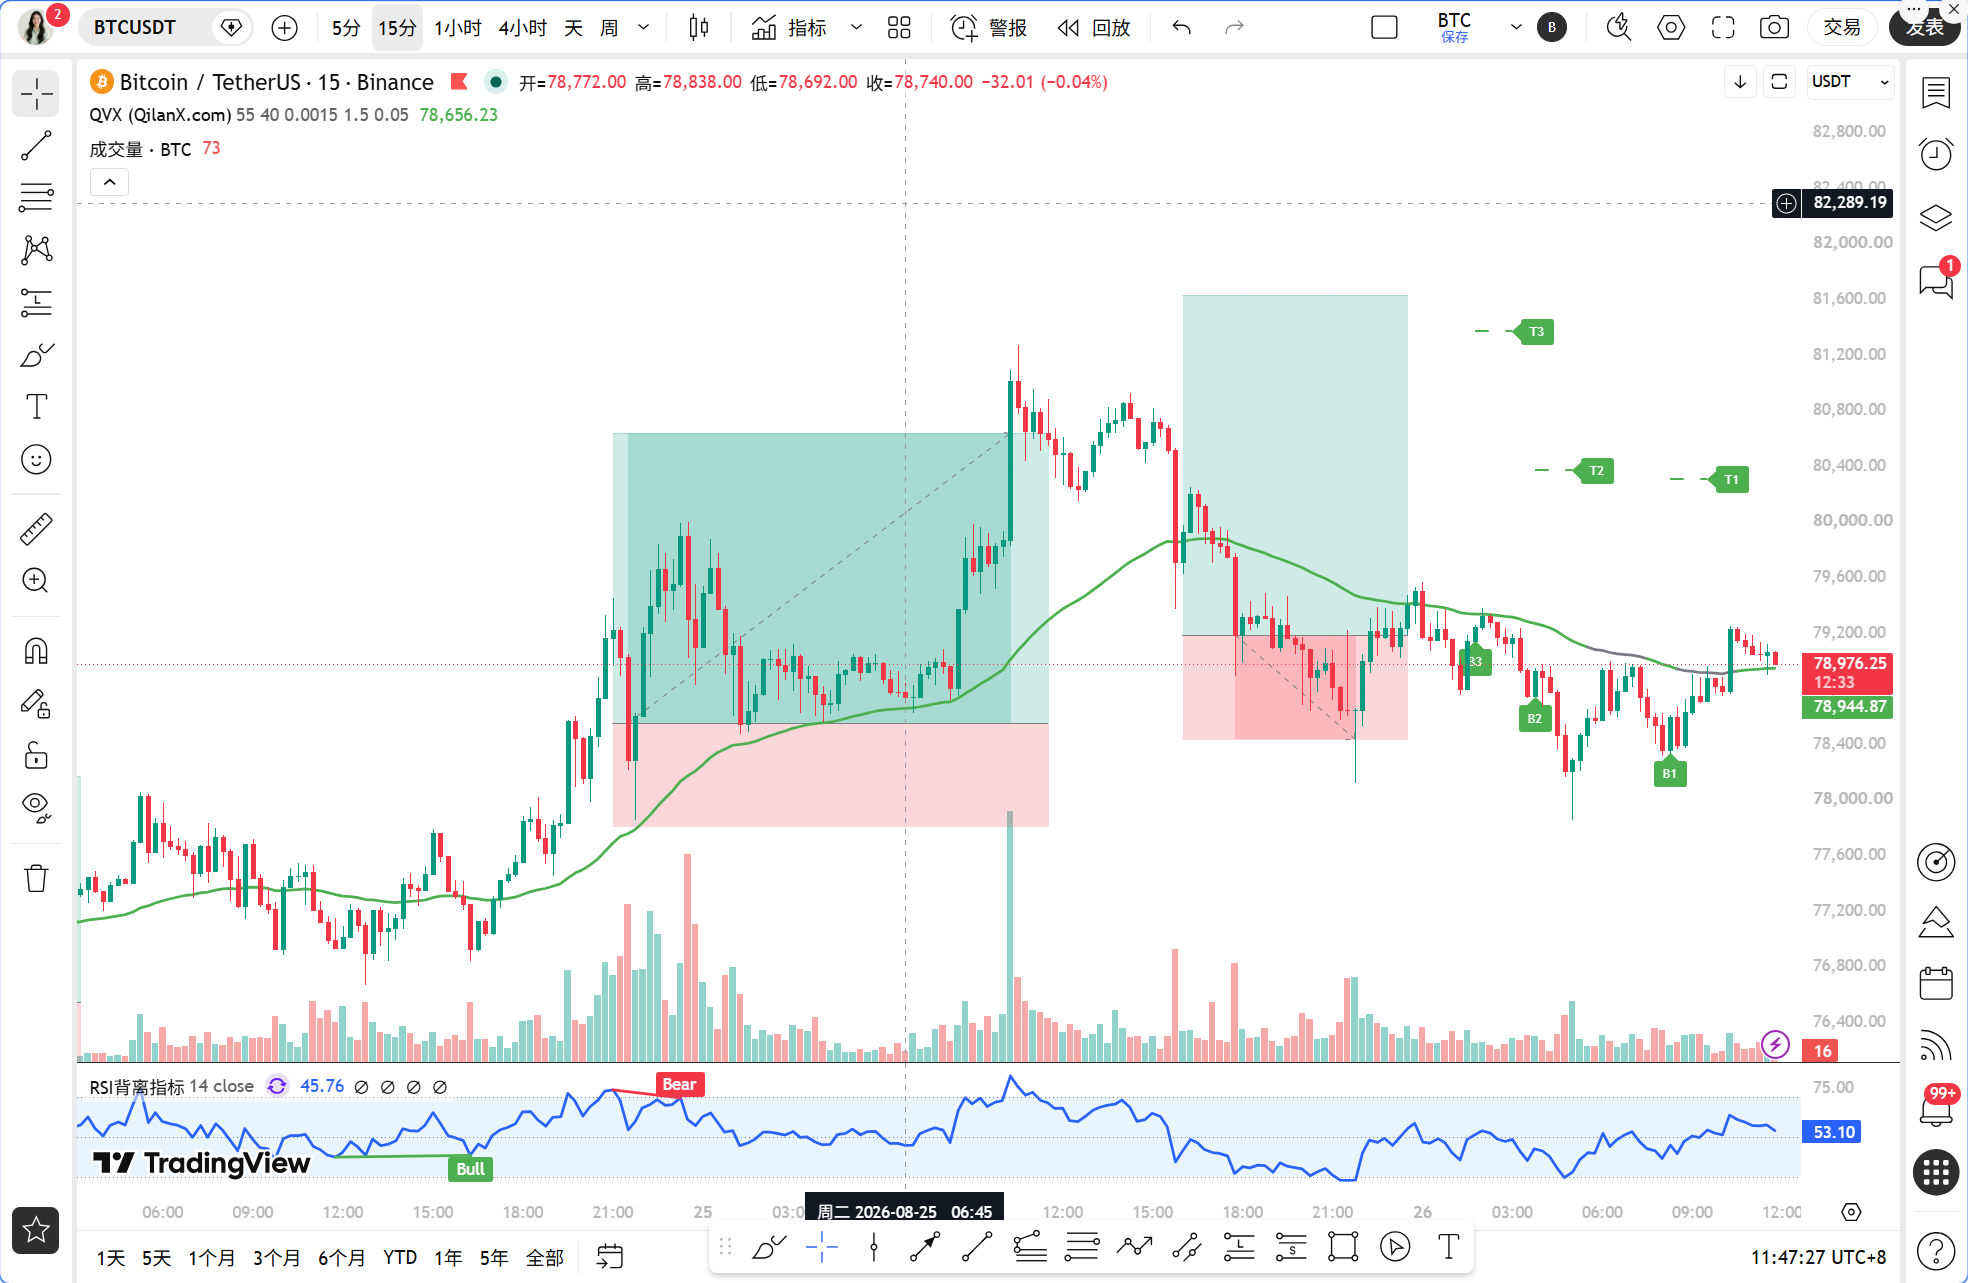
Good morning, teammates. Today, there is a very interesting signal in the market. After the account of Big Brother Maji surged by 200 times, he spent 113 million US dollars to long BTC and ETH at the same time, which is a clear bullish signal. On the other hand, the US M2 growth rate for July reached a two-year high, and liquidity expectations are improving. However, the BTC price has retreated from above 80,000, currently quoted at 78,962 USDT, with a 24-hour decline of 2.07%. The divergence between this giant whale's bullish sentiment and the price pullback raises the question of whether this is a golden pit or a downward continuation; let’s look directly at the data.
Currently, BTC is quoted at 78,962 USDT, time: August 26, 11:47. First, look at the larger cycle; the MACD histogram at the daily level is 1,402.15, showing that bullish momentum remains strong, but the RSI has climbed to 88.36, which is a typical overbought area where historically, the cost-effectiveness of chasing long is extremely low. The MACD histogram at the 4-hour level is -302.46, showing that momentum has weakened, with the price operating below the MA5 and MA10, indicating that short-term adjustment pressure has not been fully released. At the 1-hour level, the MACD histogram is -33.05, bearish momentum still exists, but the RSI 53.86 has returned to a neutral range, limiting the downward force. The 15-minute MACD histogram is 36.26, indicating short-term rebound signs, but the MA30 is at 78,737.98, and support still needs confirmation.
Next, let's verify the signal using the Qinglan TPV system. Currently, the 1-hour EMA55 is at 78,724.93, with the current price at 78,962 USDT, placing the price above the EMA55 but only at a distance of 0.30%. According to the oscillation determination auxiliary data, in the past 8 1-hour candlesticks, the closing price was greater than EMA55 four times and crossed it three times, entirely aligning with the oscillation market determination standards. According to the TPV system rules, in an oscillation market, do not actively long or short, only provide the range. So now is not the time to chase orders but to wait for clarity in direction. In terms of formation, the 1-hour level has not seen two consecutive candlesticks stabilize above EMA55 for a bullish confirmation, nor have there been two consecutive candlesticks drop below EMA55 for a bearish confirmation, while the MACD histogram at the 1-hour level, though shortened, has not yet shown clear reversal signals like bullish engulfing or bearish engulfing. Overall, the TPV system currently gives a wait-and-see signal, awaiting a breakthrough.
In terms of on-chain data, the fear and greed index is at 65, indicating a market sentiment leaning towards greed but not yet at the extreme greed peak area. BTC market share is at 59.28%, still maintaining a high level, indicating that funds are rotating within BTC without a large-scale flow into altcoins. The market value of stablecoins is 6.888 billion USD, approaching historical peaks, which is potential buying ammunition. However, the news of El Salvador's Bitcoin payment scenario depletion negatively impacts BTC's narrative of value, as the real payment contraction will weaken the long-term consensus. On the macro level, the ceasefire agreement between the US and Iran is nearing, with oil prices breaking below 80 dollars, supporting risk appetite. Japan plans to establish a blockchain settlement system, which is a long-term positive. The biggest short-term variables are still Nvidia's earnings report and the policy framework statement from Waller on Friday, both of which could trigger significant market volatility.
From the perspective of key support and resistance levels, the first pressure level above is around 79,300, above the 1-hour EMA55, which is at the position of the 1-hour MA30, with stronger pressure at the 4-hour MA10 of 79,209 and MA5 of 79,009. This area is the dividing line for short-term bulls and bears. If the price can break through and stabilize above 79,300, the short-term will re-test the 80,000 mark. The first support below is around 78,700, which is at the EMA55 position; if this position is broken, the next support looks at the 15-minute MA30 at 78,737 and the 1-hour MA5 at 78,811, with strong support at the 4-hour MA30 at 77,905. The daily MA5 is at 78,260, and this position is the last line of defense for bulls.
For trading strategies, I offer three options. First, for aggressive players, short sell high and buy low within the range of 78,700 to 79,300 with light positions, setting stop-loss below 78,500, and targeting 79,500 to 80,000. Second, for conservative players, wait for the price to break through 79,300 and stabilize above with a 1-hour closing price before considering a long; set stop-loss at 78,900, and target 80,000 to 80,500. Third, for defensive players, if the price breaks below 78,500, do not rush to short; wait for a rebound to the 78,800 to 79,000 range to consider light short positions, with stop-loss at 79,300 and targeting 77,900. Remember, we are currently in an oscillation area, and position control should be within 30% of usual; do not heavily bet on directions.
Risk warning: Daily RSI at 88.36 is severely overbought; any realization of good news may trigger a concentrated escape of profit-taking, so be careful with leverage.
Follow Qinglan Crypto Classroom to seize more trading opportunities! Welcome to visit the official website www.qinglan.org
📊 Qinglan TPV trading strategy backtest reference
🕒 Last backtest time 08-26 07:00:02
Total analysis: 3704 Backtest: 3698 Accuracy: 79.7% (2949/3698)
免责声明:本文章仅代表作者个人观点,不代表本平台的立场和观点。本文章仅供信息分享,不构成对任何人的任何投资建议。用户与作者之间的任何争议,与本平台无关。如网页中刊载的文章或图片涉及侵权,请提供相关的权利证明和身份证明发送邮件到support@aicoin.com,本平台相关工作人员将会进行核查。