NVIDIA's earnings report exploded, BlackRock raised 312 million USD in ten hours, and whales switched positions from short to long with a hefty investment of 43.72 million USD. With these three major positive factors hitting the market simultaneously, BTC should logically soar. However, the market is surprisingly calm, with BTC lingering around 78,862 USDT, only a 0.34% increase over 24 hours. More strikingly, a Bitcoin wallet dormant for over ten years suddenly awakened, transferring 553 BTC worth 40.15 million USD in ten days. The movement of this old coin has stirred concern in the market. Additionally, the South Korean central bank raised interest rates by 25 basis points, there was a storm over the dismissal of a Federal Reserve board member, Brent crude oil broke 90 USD, and inflation expectations warmed up. These negative factors are surging beneath the surface like an undercurrent. With bullish and bearish forces clashing, where will BTC go?
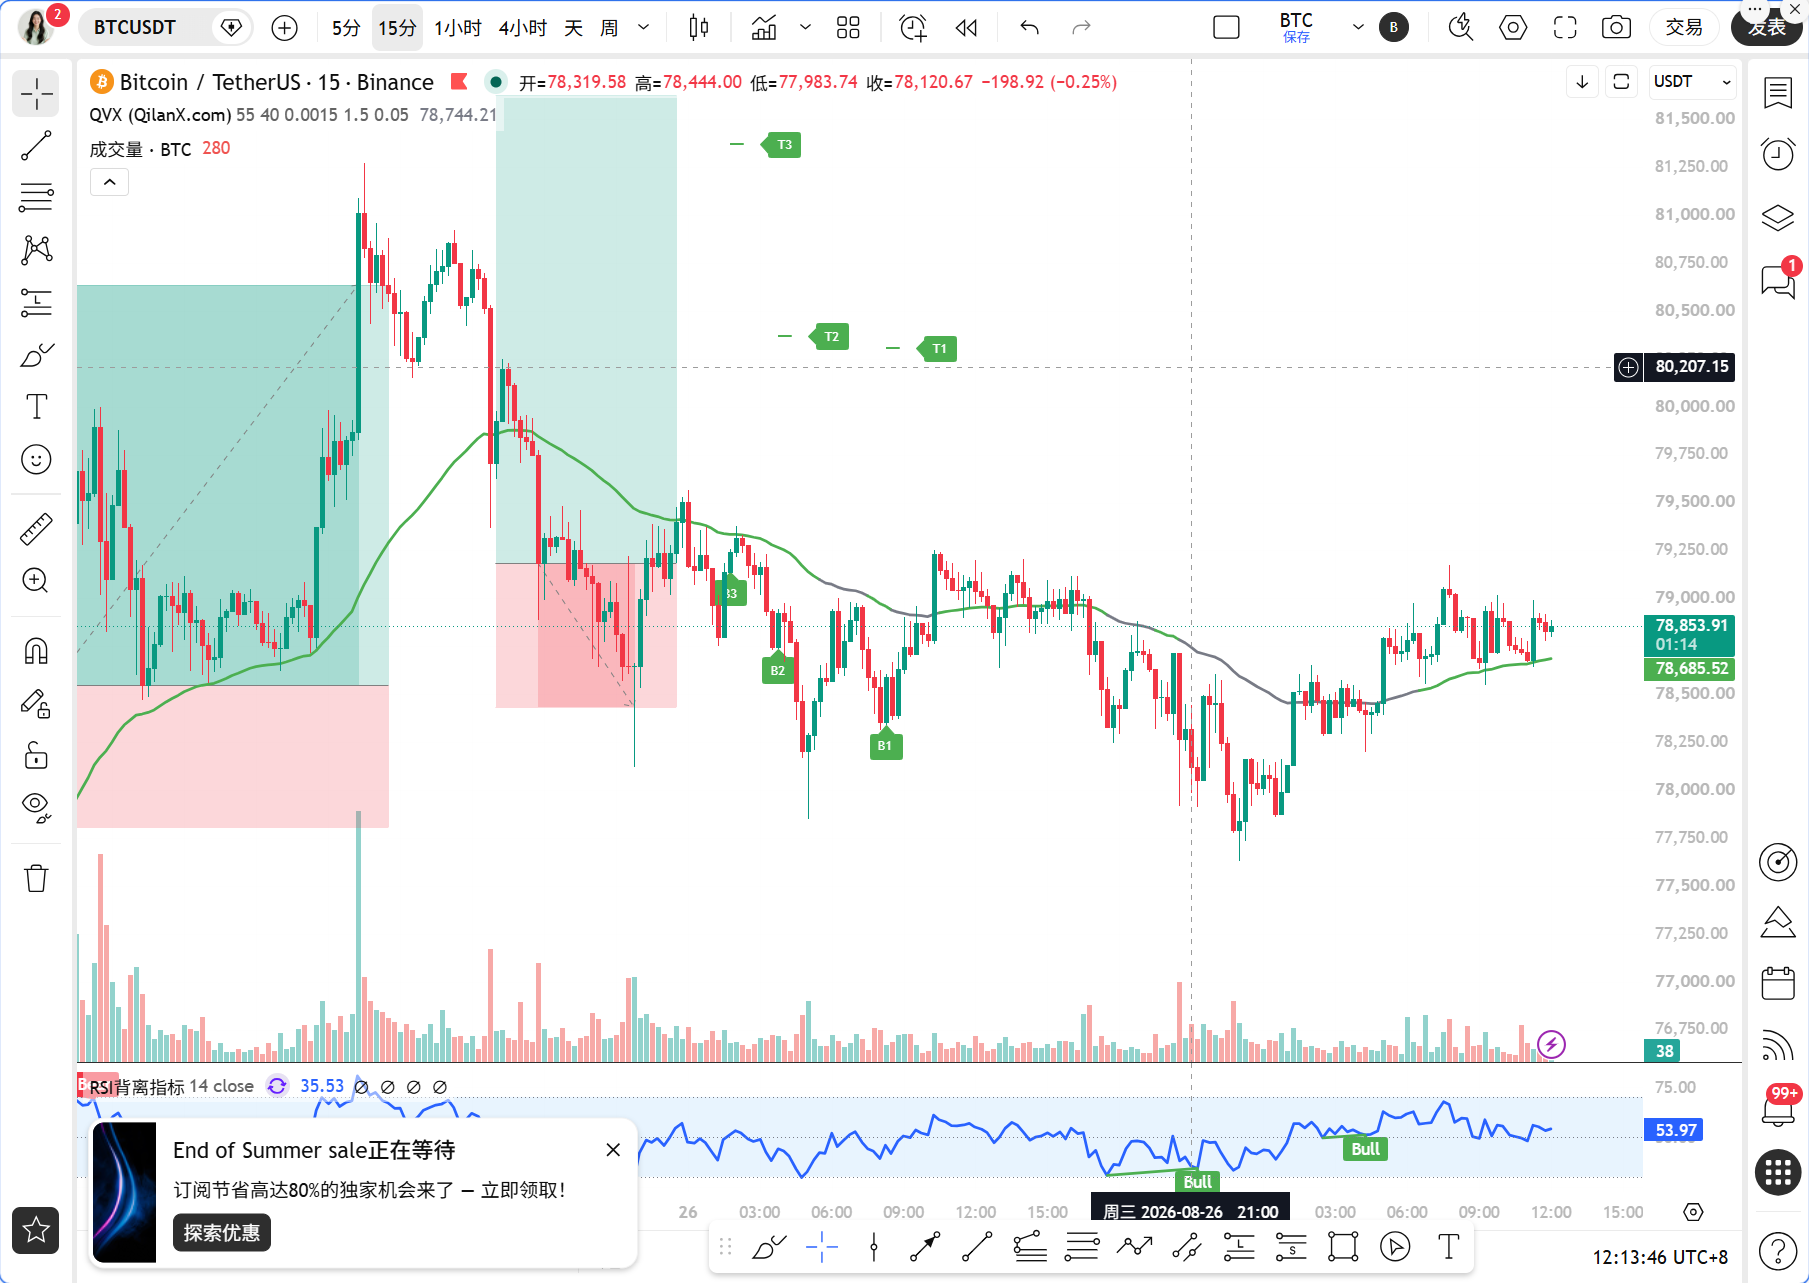
The current time is August 27, 12:14 PM, with BTC priced at 78,862 USDT. This position is very delicate, sitting just above the 1-hour EMA55 at 78,696.55 USDT, a mere 0.21% away, typical of line-bound fluctuations. This position tests human nature the most; a slight poke upwards signals a new high, while a downward push breaks support, and neither side dares to make the first move.
First, let’s look at the longer timeframe. The daily MACD histogram is at 1,209.07, indicating strong bullish momentum, but the RSI has surged to 87.69, severely overbought. This is akin to a sports car with plenty of fuel but an overheated engine. The MA5 is at 78,630.42, the MA10 at 75,565.04, with moving averages in a bullish arrangement, but the price has exceeded the MA10 by over 4%, suggesting a short-term pullback is needed. The 4-hour MACD histogram is negative at -290.22, with both DIF and DEA in a dead cross at high levels, indicating diminishing upward momentum on the 4-hour chart. The RSI has retreated to 49.08, right around the mid-axis, making the direction unclear. The 1-hour MACD histogram is at 66.79, with DIF crossing above DEA forming a golden cross, and the RSI at 73.96, suggesting a short-term strength but already entering overbought territory. The 15-minute MACD histogram is at -9.16, with DIF and DEA merging, and the RSI at 48.76, indicating short-term consolidation.
Let's validate this with the Qinglan TPV system. The 1-hour EMA55 is at 78,696.55; the current price is 78,862, above EMA55. In the last 8 1-hour candles, the closing price was greater than EMA55 7 times, with 2 crossings; according to the rules, this does not meet the oscillation threshold, theoretically placing it in a bullish trend area. However, note that the absolute distance from EMA55 is only 0.21%, less than the 0.3% line-bound standard, suggesting increased oscillation probability. This exemplifies the typical battle between trends and oscillations. For long conditions, standing firmly above EMA55, with two consecutive 1-hour closing prices above EMA55, this condition is met. However, for a solid support formation, I have not observed any significant long lower shadows or bottom formations, and the 15-minute MACD histogram is still shortening, with downward momentum not completely exhausted. For short conditions, the price is above EMA55, thus the first condition is not met. Therefore, the conclusion from the TPV system is that the direction leans towards bullish but lacks sufficient momentum, making it inadvisable to chase highs; wait for a pullback confirmation.
On-chain data shows the fear and greed index at 71, indicating a state of greed in the market. Many people are chasing highs at this position, but historically, when the greed index exceeds 70, the probability of a short-term pullback significantly increases. BTC's market share is at 59.14%, indicating that funds are still revolving within BTC, with no large-scale flow into altcoins. BlackRock's ETF withdrew 312 million USD in BTC and ETH in ten hours, which can be interpreted in two ways: first, institutional long-term holding confidence has strengthened; second, liquidity on exchanges is decreasing, potentially pushing prices higher. Whales have switched from short to long, investing 43.72 million USD with 12x leverage in BTC, which is a clear short-term bullish signal. However, the transfer of 553 BTC, worth 40.15 million USD, from a wallet that had been dormant for ten years is real selling pressure once these old coins flow into exchanges.
The key support and resistance levels indicate the first pressure point above at the rounded number of 79,000 USDT. This position is a psychological barrier and the recent rebound high point area; upon breakthrough, look for 79,500 to 80,000 USDT. The first support level below is at 78,696 USDT, equivalent to the 1-hour EMA55 level; if this level is lost, the second support looks to be in the 78,300 to 78,500 USDT range, where the 4-hour MA5 and MA10 cluster. Further down, watch the 78,000 USDT rounded figure, this level is the short-term bull-bear divide, and if breached, the trend changes.
Trading strategy: the direction is bullish but do not chase highs. Entry conditions include waiting for a pullback in the 78,500 to 78,696 USDT range, that is, near the 1-hour EMA55; look for a 1-hour bottom formation or long lower shadow, while the 15-minute MACD histogram turns positive. At this point, a small long position can be taken. Set a stop loss below 78,000 USDT; if this position is breached, it indicates the EMA55 support is invalidated, the bullish trend is damaged, and one must exit. The first target looks to be 79,500 USDT, the second target at the rounded number of 80,000 USDT. If the price breaks out and stabilizes above 79,000 USDT, it can also be chased, but the position should be halved, as the risks of chasing highs are significant. If the price drops below 78,000 USDT, do not catch falling knives; wait for a 4-hour chart to show a stop-loss signal before considering.
Risk warning: RSI daily at 87.69 is seriously overbought, greed index at 71, movement of ten-year-old coins increases selling pressure, South Korean central bank's interest hike tightens liquidity; any of these factors could trigger a short-term sharp drop.
Follow Qinglan Crypto Class to grasp more trading opportunities! Welcome to visit the official website www.qinglan.org
📊 Qinglan TPV trading strategy backtesting reference
🕒 Last backtest time 08-27 07:00:02
Total analysis: 3717 Backtest: 3711 Accuracy: 79.7% (2957/3711)
免责声明:本文章仅代表作者个人观点,不代表本平台的立场和观点。本文章仅供信息分享,不构成对任何人的任何投资建议。用户与作者之间的任何争议,与本平台无关。如网页中刊载的文章或图片涉及侵权,请提供相关的权利证明和身份证明发送邮件到support@aicoin.com,本平台相关工作人员将会进行核查。