Written by: Glassnode
Translated by: AididiaoJP, Foresight News
The trigger has been pulled
Bitcoin is stuck between two cost baselines, unable to move. Spot trading volume has fallen to its lowest since 2019. Sellers are exhausting, buyers are waiting on the sidelines, but leveraged funds have preemptively pulled the recovery trigger—only the data has not caught up yet.
Core Summary
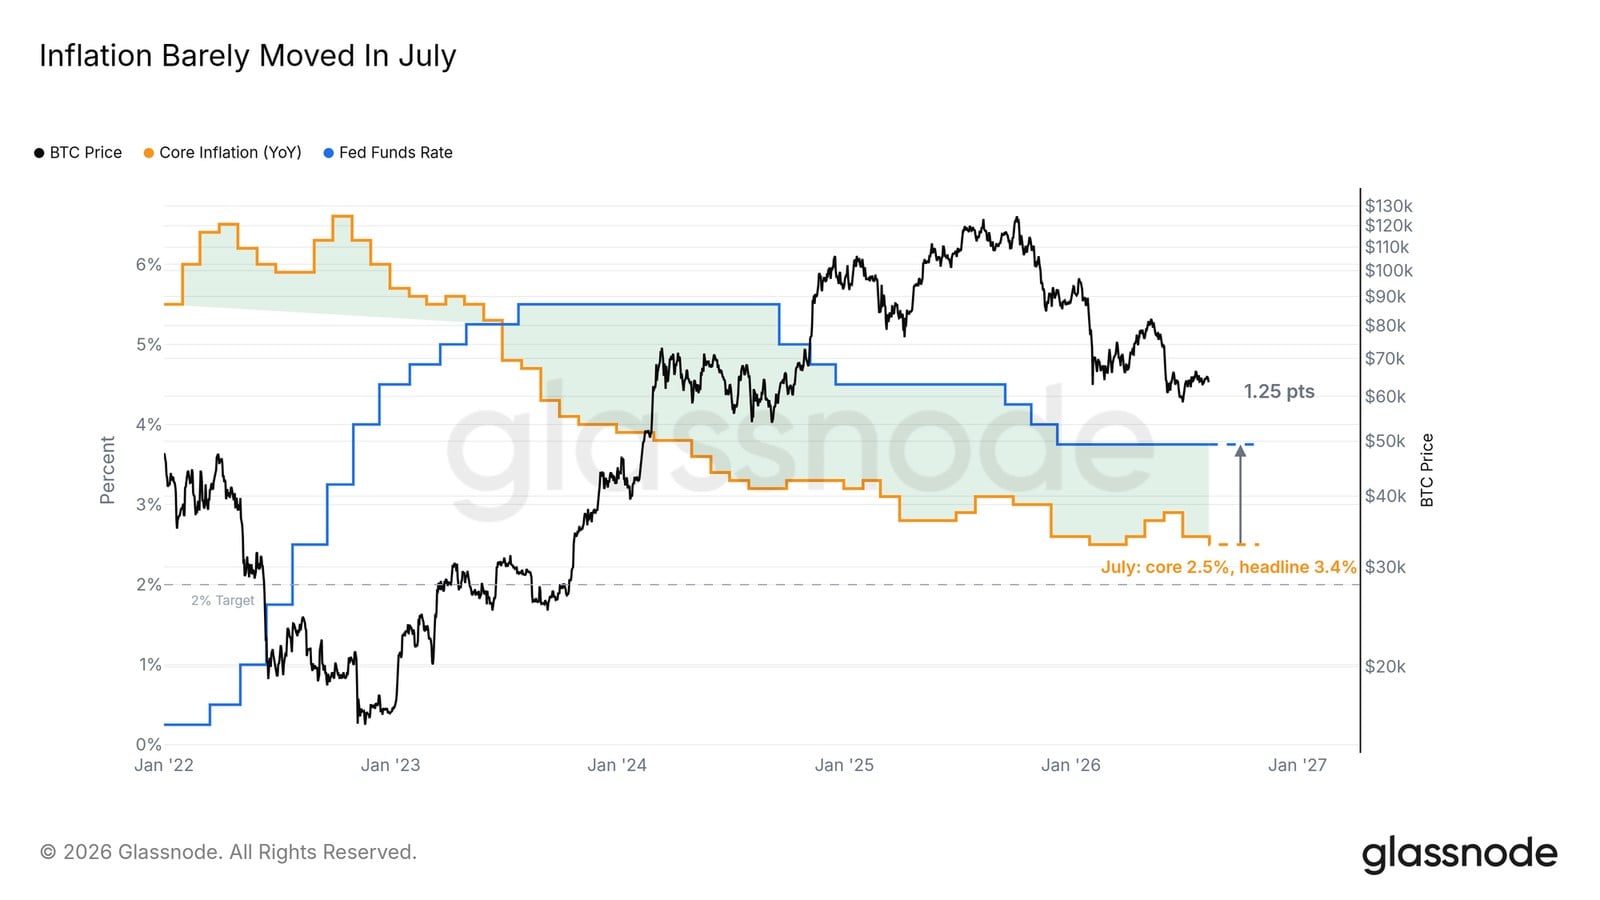
- July core CPI dropped to 2.5%, US stocks hit new highs, but Bitcoin weakened against the trend. Being indifferent to good news is a warning in itself.
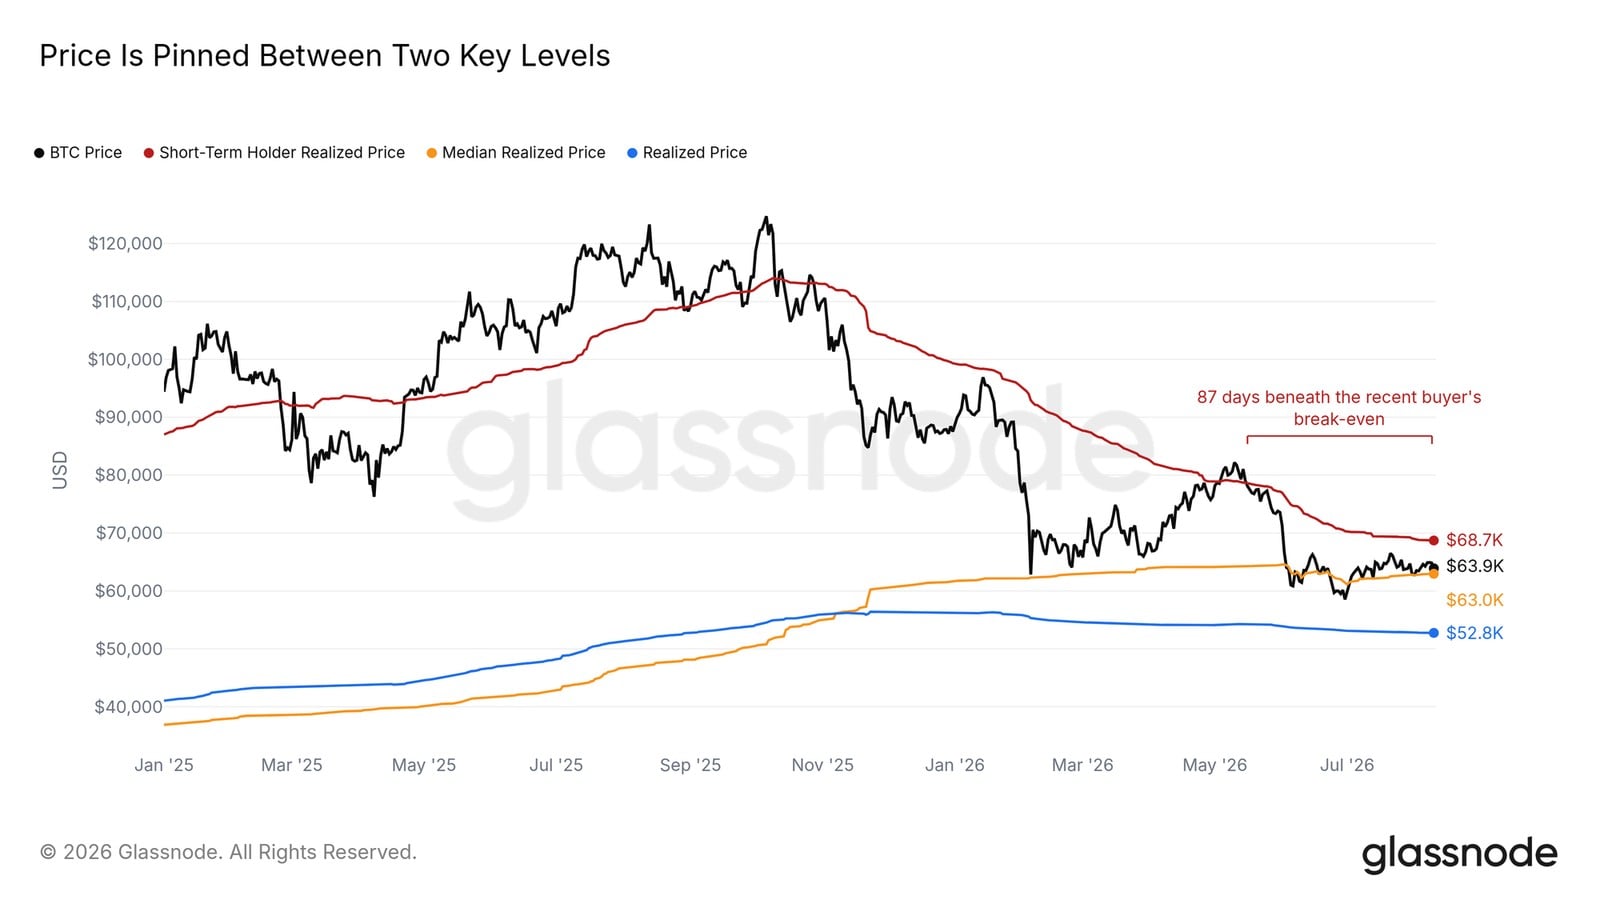
- Prices are trapped between 63,000 USD (median realized price) and 68,700 USD (short-term holder cost basis), with spot trading volume hitting a new low since 2019.
- Sellers are nearing exhaustion: the share of profitable supply is approaching historical bear market bottom regions, and the breakeven line has suppressed rebounds nine times.
- Buyers are persistently absent: ETF inflows are negligible, and coins continue to flow into exchanges.
- Leverage funds are overly bullish on thin buy demand. Resistance is seen at 68,700, support at 58,500.
Good news abounds, but the market is unresponsive
Inflation cools, the market responds coldly
The CPI data for July released this morning almost did not disturb the market: core inflation dropped by 0.1 percentage points to 2.5%, overall inflation remained flat. The policy rate has remained unchanged since December last year, and the actual rate is still in a tightening range, with the gap widening as inflation slowly declines.
More concerning than the data itself is the market's reaction—hours after the data release, Bitcoin hardly rebounded, and US stocks even saw a slight decline. Stable inflation and unchanged policies should constitute a gentle backdrop, and a healthy market should interpret it as a positive signal. If prices cannot rally in the coming days, we will view this as a confirmation of ongoing absent demand. The same concern applies to the stock market.
Funds flow to assets, not Bitcoin
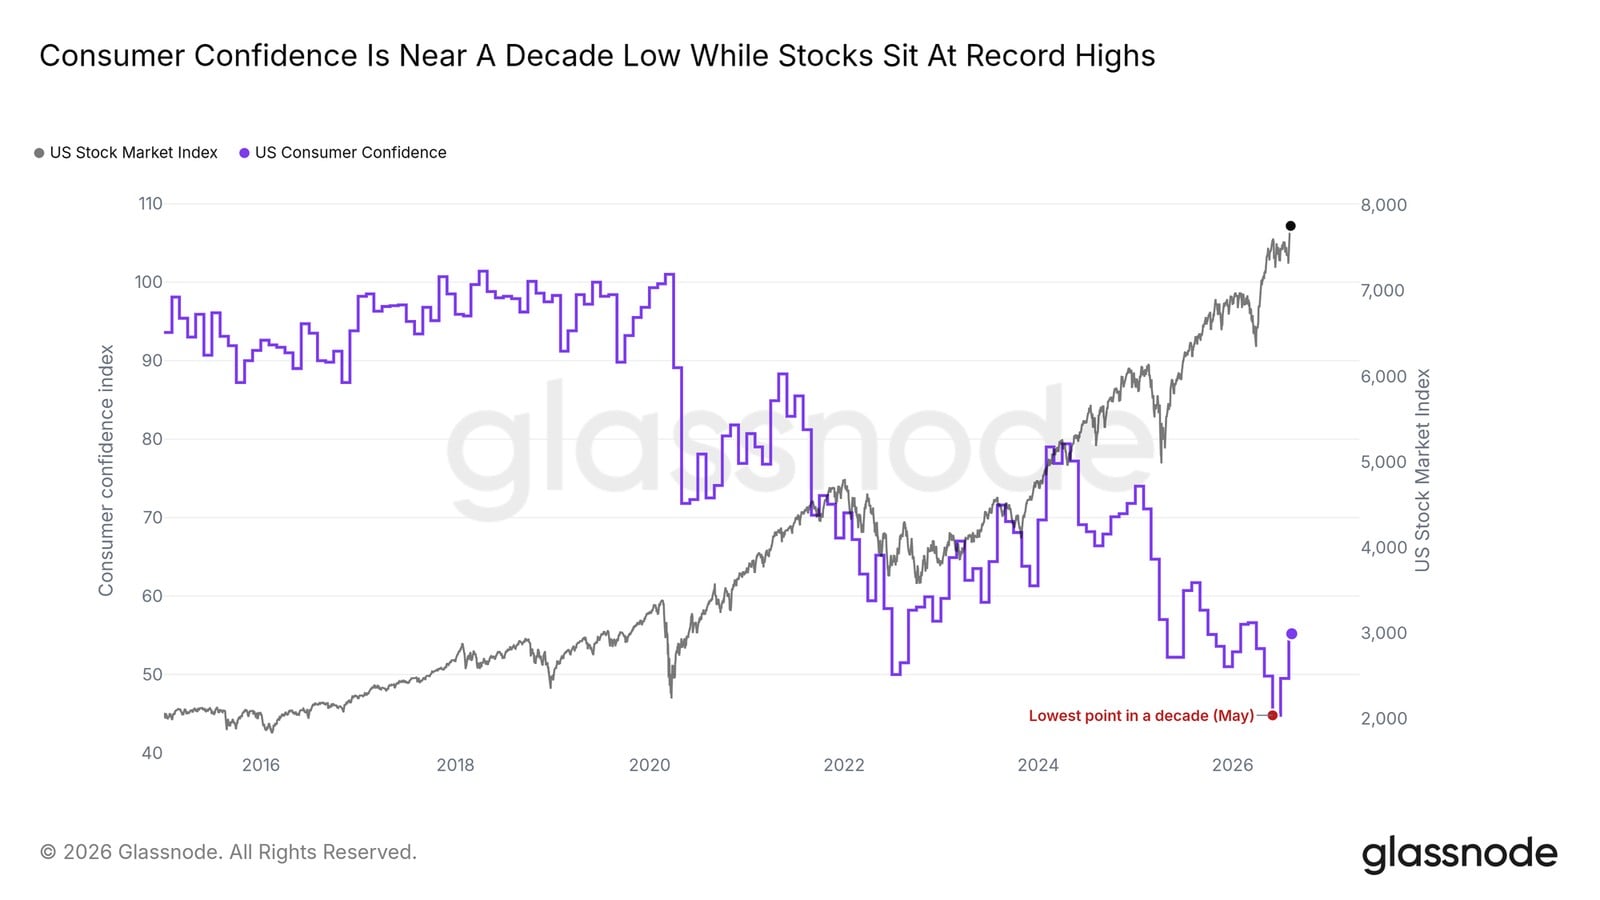
Although consumer confidence has risen for two consecutive weeks, it remains in the weakest range of the past decade. Meanwhile, US stocks reached an all-time high on August 7 and maintained the high level. The divergence between weak confidence and record prices is primarily due to households' expectations of rising living costs and weakening economic outlook, prompting a shift from cash to assets—US stocks, dominated by AI trading, are the main destination for these funds.
Bitcoin has been excluded from this round of rotation. Spot prices are about half of the peaks in October 2025, consistently underperforming US stocks throughout the summer, despite its long-term narrative being built on the logic of "funds flowing to scarce assets." Funds are chasing already momentum-driven assets, and before a part of it flows back, record-high US stocks provide almost no support to Bitcoin. The signal to turn will first manifest in ETF flows—data below indicates that there are currently no signs.
The market is compressed to the limit
Stuck between two cost lines
The cost basis ladder is defining the current impasse. The spot price barely stands above 63,000 USD (the median realized price)—which is the median of the whole network's coin cost basis—while it is below 68,700 USD (short-term holder cost basis), which is the average entry price of recent buyers. This group is trapped, historically quick to sell on rebounds; and the median level has been tested downward multiple times over the past month.
Prices have oscillated within this range for nearly three months, and the two cost lines are gradually converging as volatility shrinks. Below, the realized price of the whole network is about 52,800 USD, indicating that the average coin still holds considerable profit, and the overall market in this cycle has never fully fallen into a loss. If it can continuously recover 68,700 USD, it will bring recent buyers back to profit and test the upper supply pressure for the first time; if it loses the median level, there will be almost no structural support before the June lows.
The quietest market since 2019
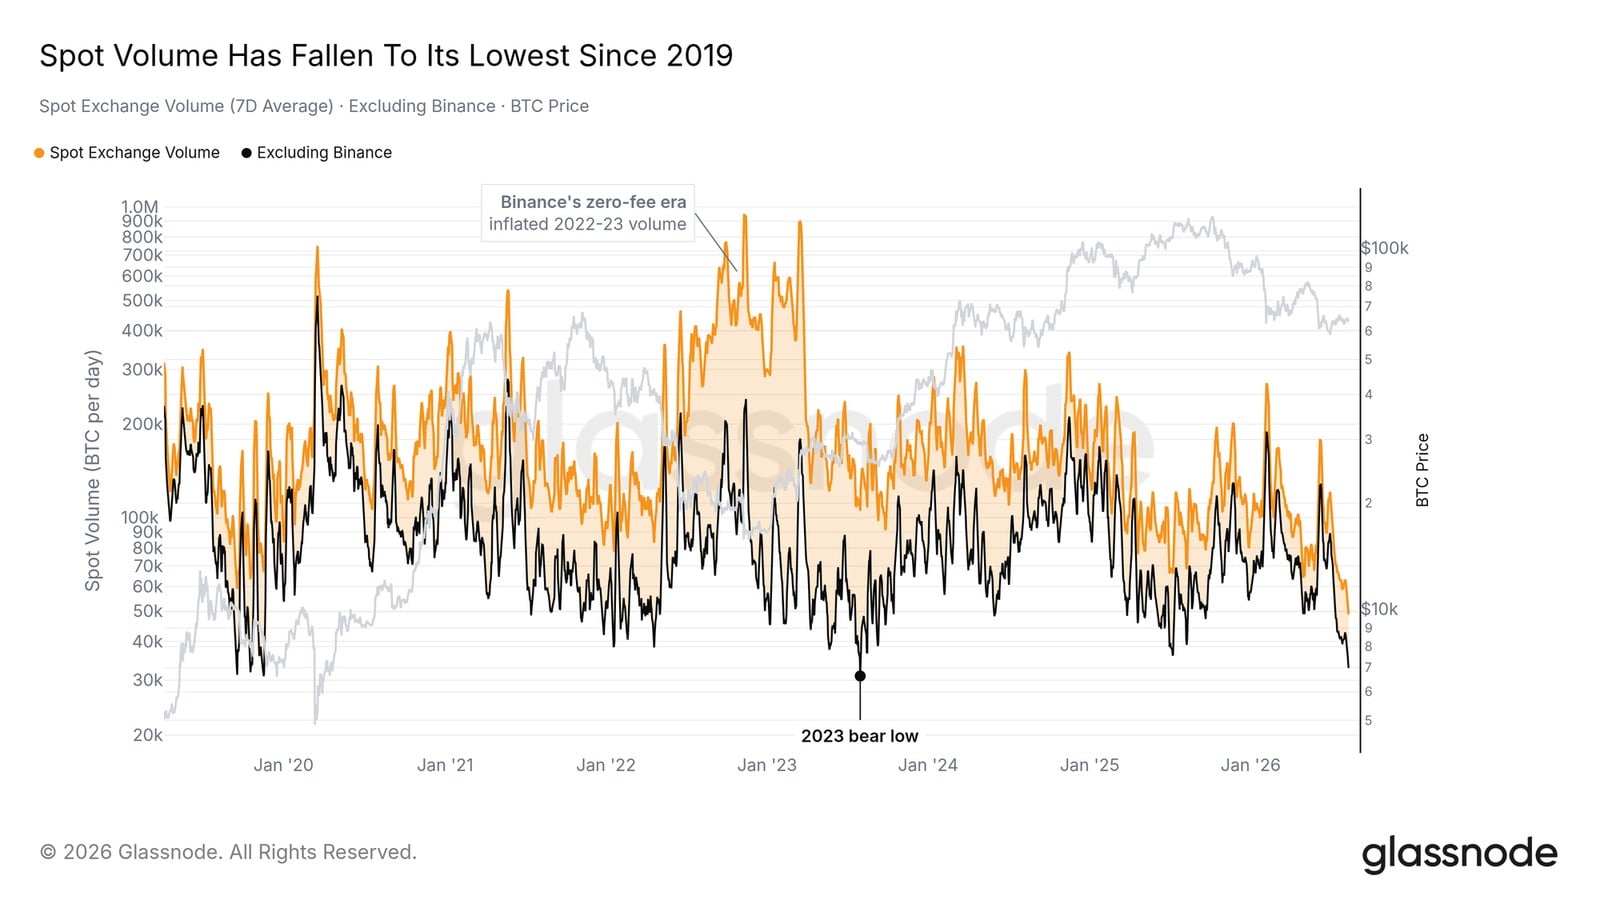
This compression is also reflected in the activity level. This report has been tracking the shrinking trend of trading volume for several issues, and the current situation is even more extreme: spot exchange trading volume measured in number of coins, not USD, has fallen to its lowest level since records began in early 2019; even excluding Binance, the current volume barely matches the bear market lows of 2023. In seven years, there has never been so few bitcoins changing hands—this is the clearest annotation of market indifference.
This thin market will amplify the power of whoever acts first: gentle demand can push up prices, gentle supply can breach support. Extremely low participation is rarely sustainable, and this is usually a classic prelude to volatility expansion. Below will weigh which side is more likely to act first.
Sellers are exhausting
Bottom signals are gradually emerging
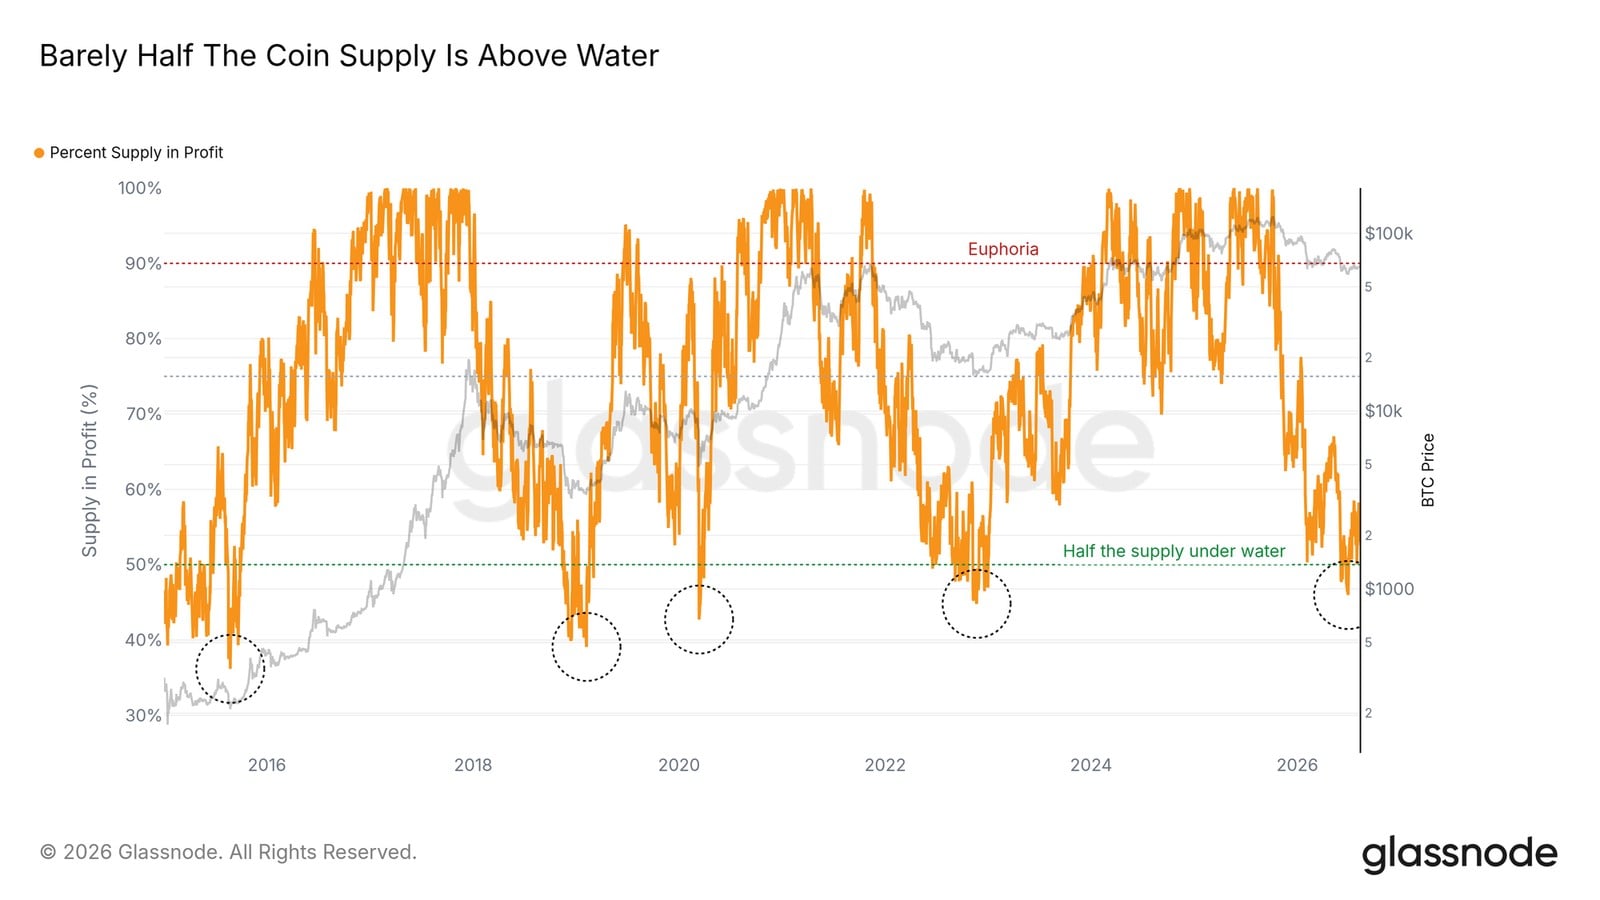
Two long-term bear market indicators are approaching bottom regions. Just over half of the circulating supply on the network still holds unrealized profits, and the June low exactly coincides with the upper edge of historical bear market ending regions; the circles in the chart indicate deeper positions at previous bottoms.
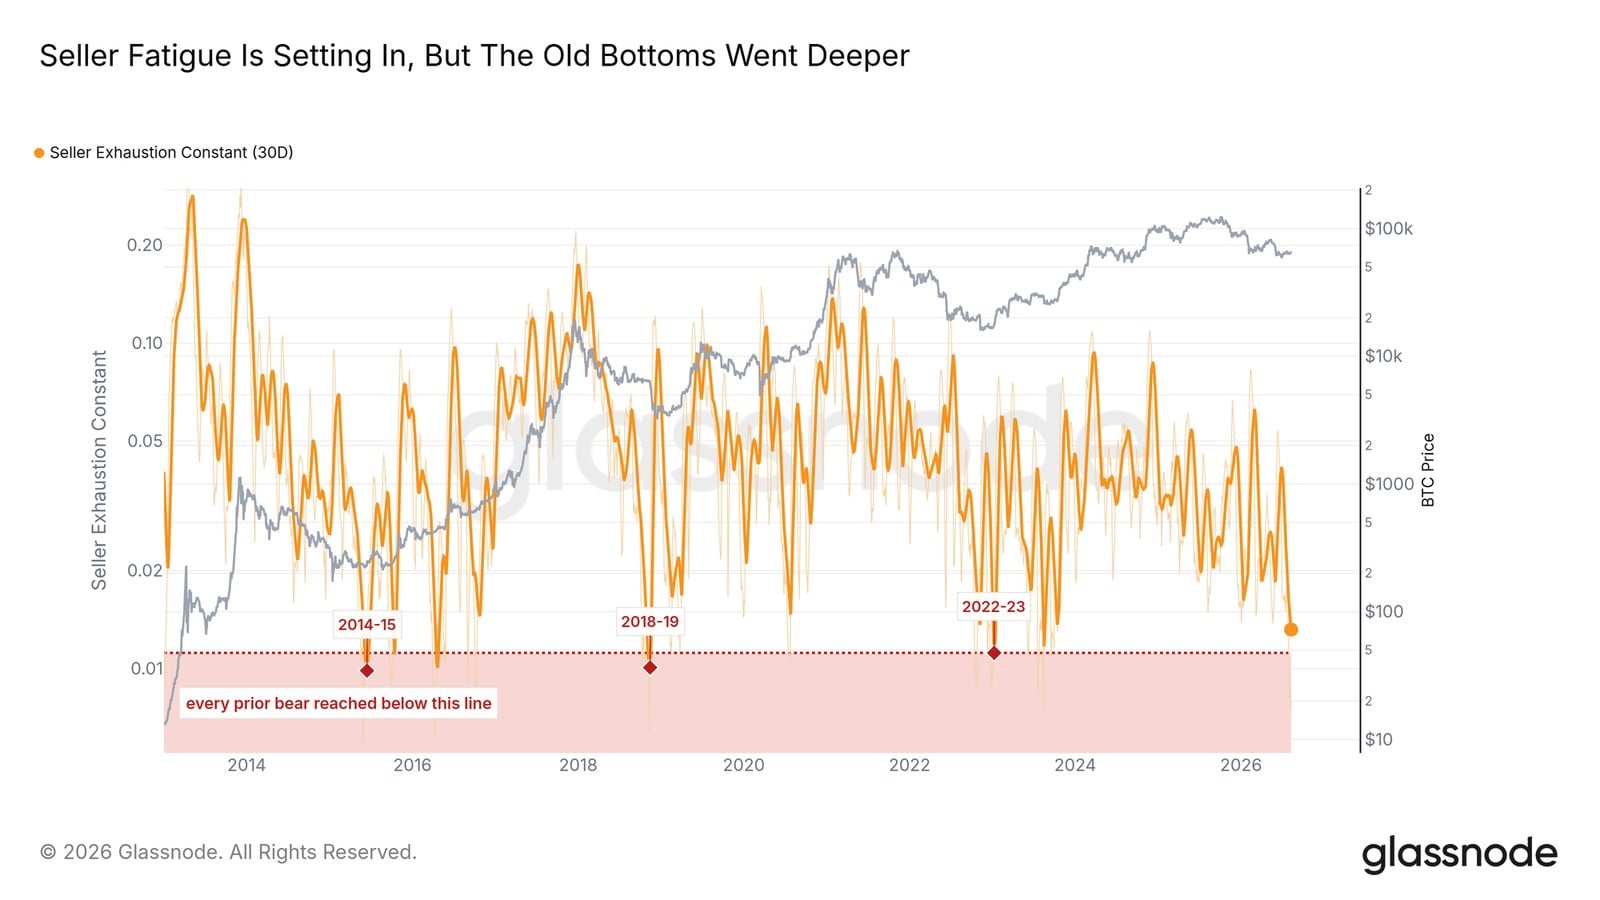
The seller fatigue constant (combining profitable supply and volatility to identify the timing of seller surrender) has been ground down to a low point in this cycle, marking one of the weakest readings since 2013, but still higher than previous ultimate bottoms. Sellers are clearly exhausted, but the final clearance that ends the bear market has not yet occurred. Last week we described this pullback as "boring surrender" rather than "painful surrender"—a painful cleansing can complete the historical pattern, while the other path is time: bottoming can be longer than anyone expects.
Nine suppressions of the breakeven line
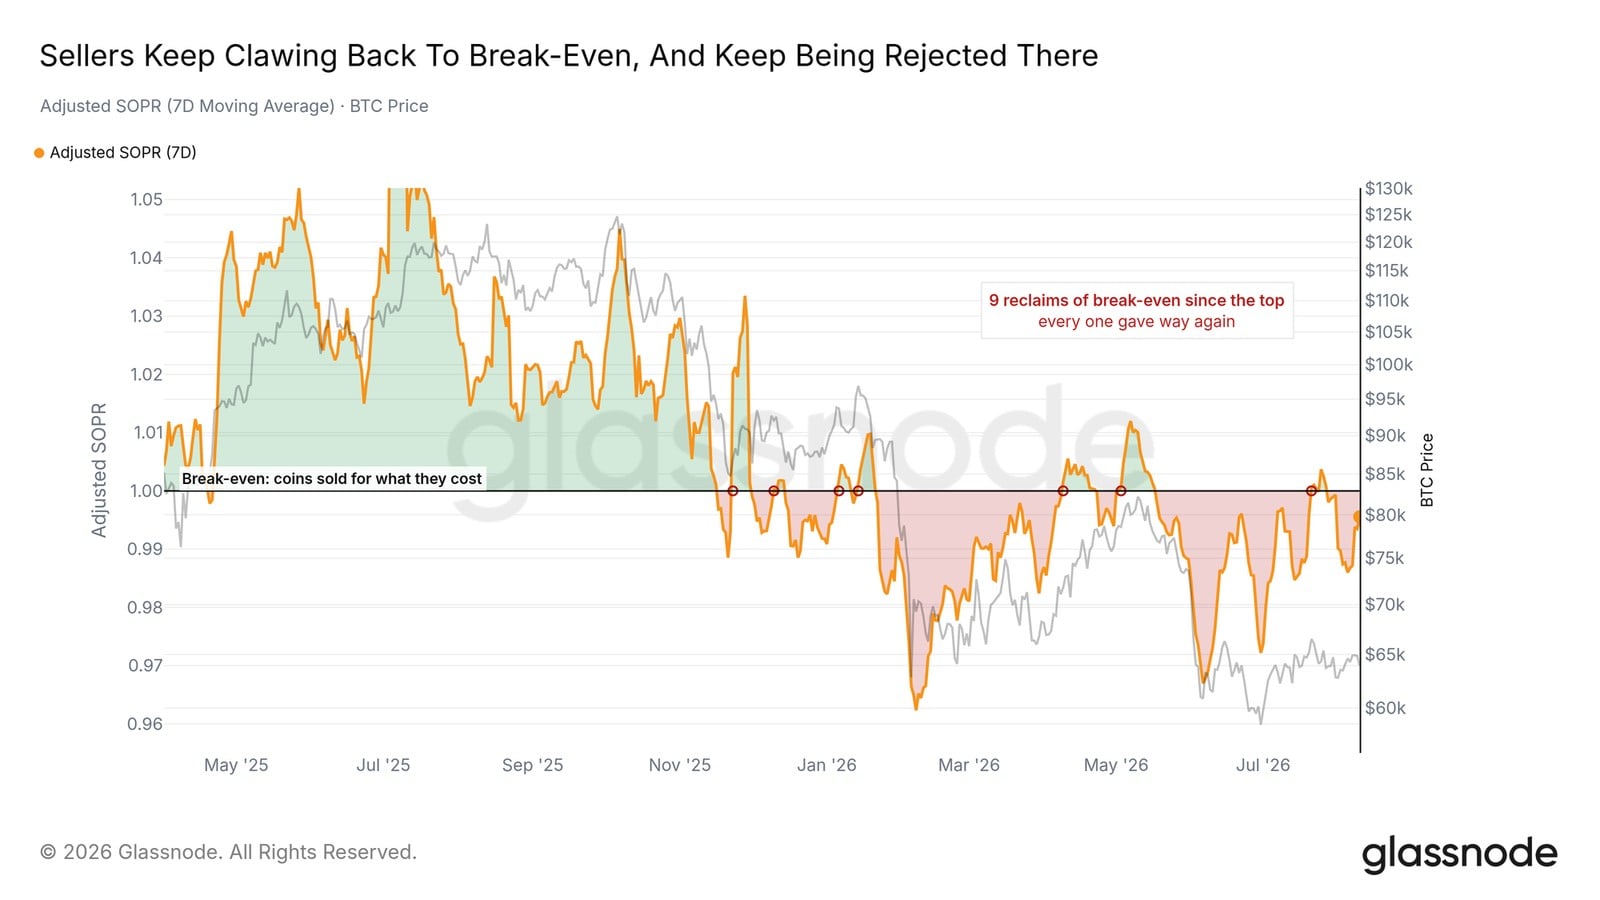
The adjusted SOPR (the ratio of selling price to buying price in on-chain actual spending) has remained slightly below 1.0 for most of this bear market cycle, meaning that coins are mostly sold at cost. Since the peak last October, the 7-day average has risen to this line nine times, each time viewed as an opportunity for sellers to exit. The market is still digesting the supply above.
The previous two bear markets stayed below the breakeven line longer and with deeper declines, making this cycle relatively mild. Sustainable recovery will manifest as this ratio consistently holding above 1.0 during rebounds. Before that, sellers still hold this gateway.
Buyers are continuously absent
ETF inflows are like a trickle
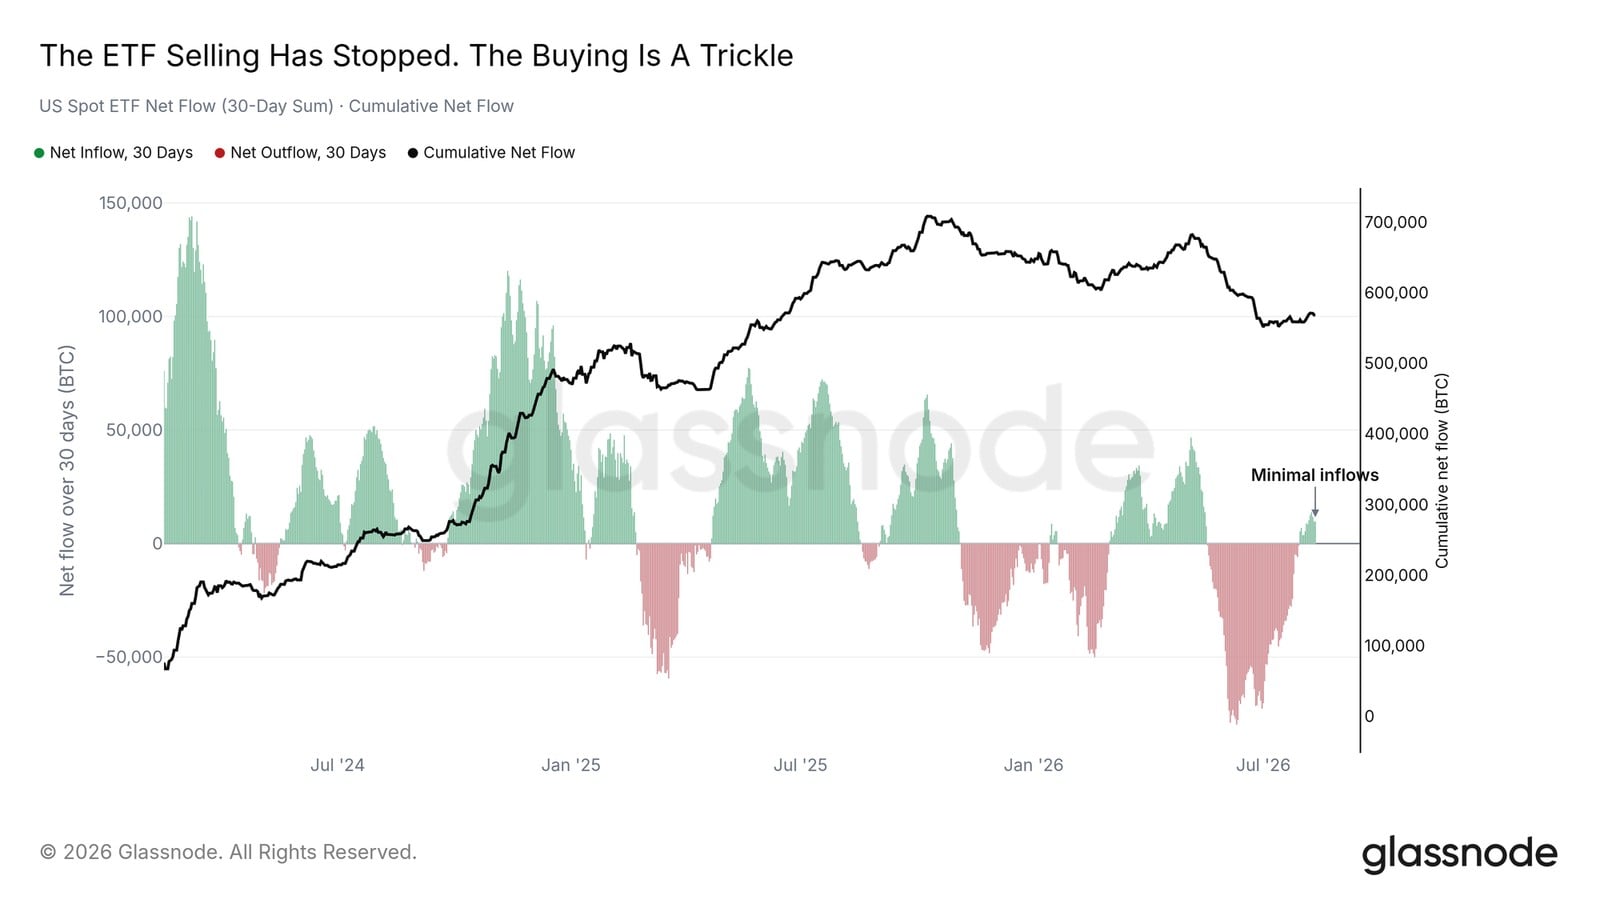
The ETF system has stopped net selling. By the end of July, the net flow turned positive for the first time in several months, but the scale is just a fraction of any prior accumulation wave, and total holdings remain far below the peak last October. Such a meager flow could flip negative with a single day of redemptions.
We interpret this as indifference. The outflow wave in June has exhausted, eliminating one pressure source, but the institutional buying that drives the 2024–2025 bull market has yet to return. Every previous recovery started with a demand pulse visible in this chart—and today, there is none.
Coins are still flowing into exchanges
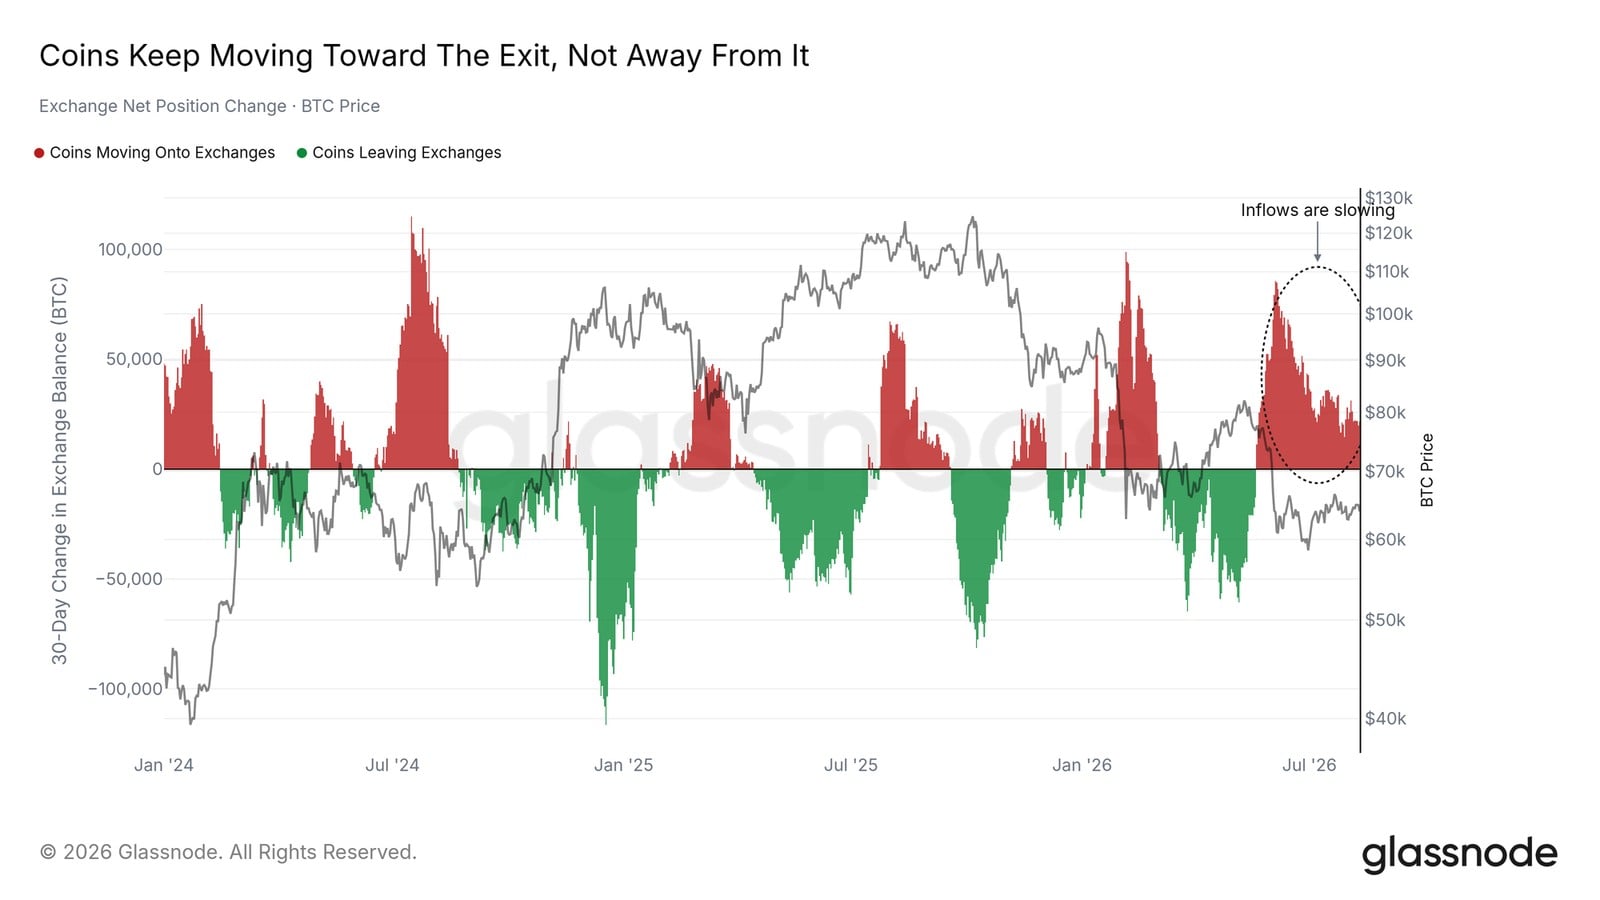
Meanwhile, supply continues to arrive. Changes in net exchange holdings remain in the inflow zone, with coins flowing into exchanges on most days this year. The pace has retreated from the peak in early June, consistent with the overall picture of seller fatigue, but the direction remains unchanged: coins are still flowing to places available for sale.
In a context where the demand ledger is empty, even modest inflows carry weight. A normal market can digest with ease; however, in the thinnest market since 2019, without ETF buying support, the same trickle of supply is enough to suppress prices.
The market is not waiting
Leverage has gathered at high levels
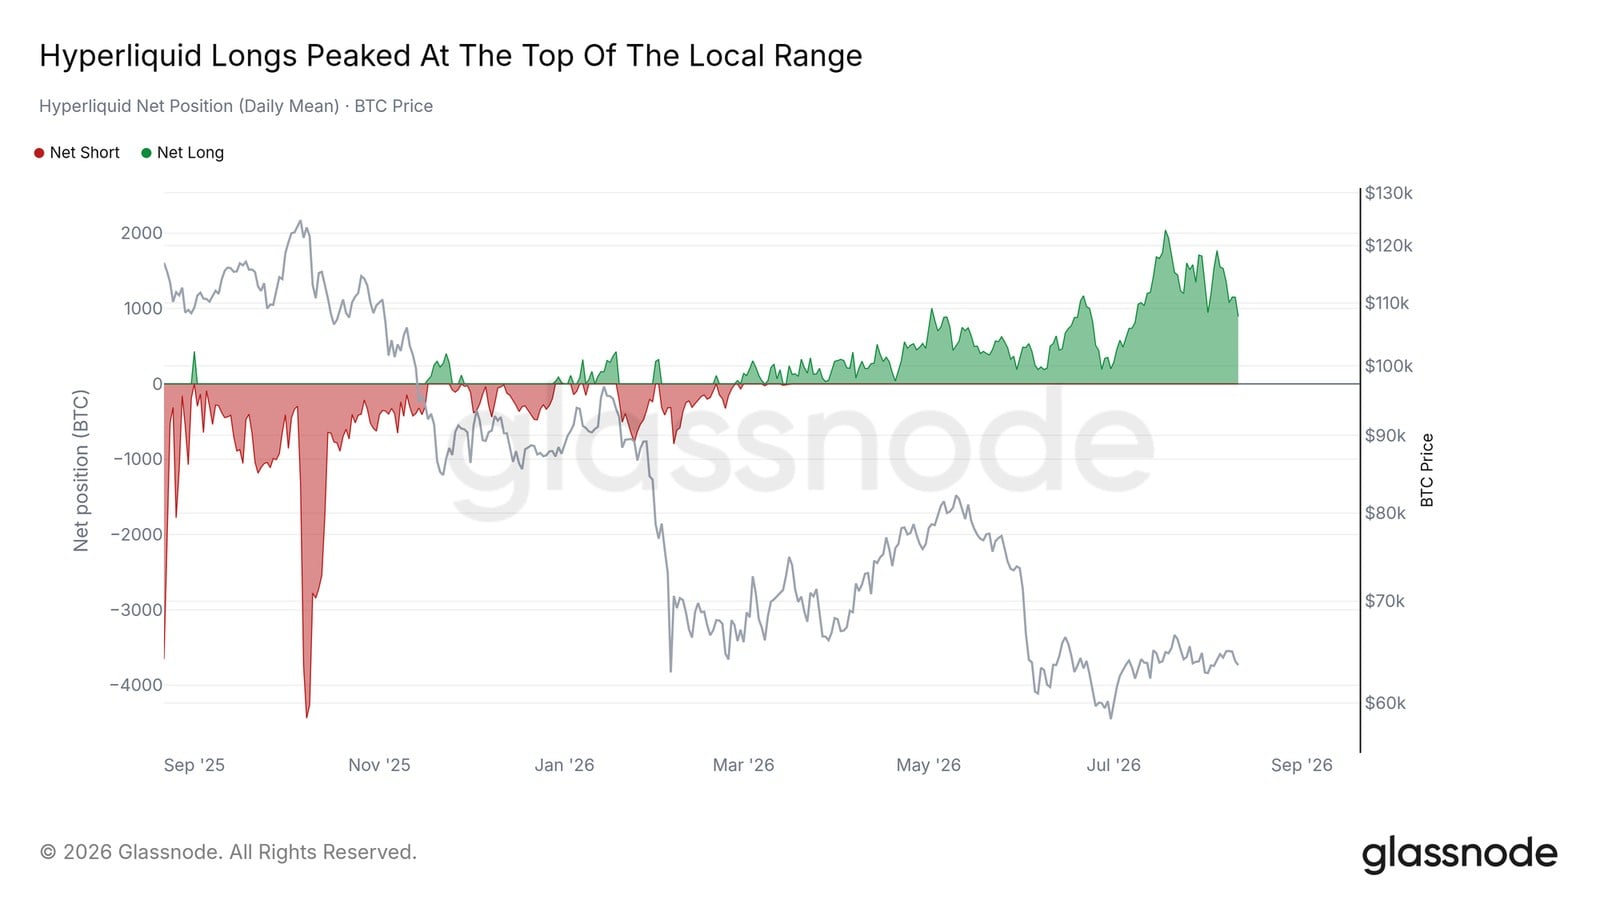
Derivative traders have no hesitation. On Hyperliquid, whale accounts have maintained net long positions daily since mid-March, an unprecedented feat in the short history of this data, with positions peaking when prices reached the range top in mid-July. A group that has been shorting consistently since the second half of 2025 flipped to long in March and continued to add positions during the range fluctuations.
There are currently no factors in spot and flow data that can validate this belief. Early leverage does precisely concentrate the risk on the most vulnerable area during range failures.
Heavy ledger, quiet market
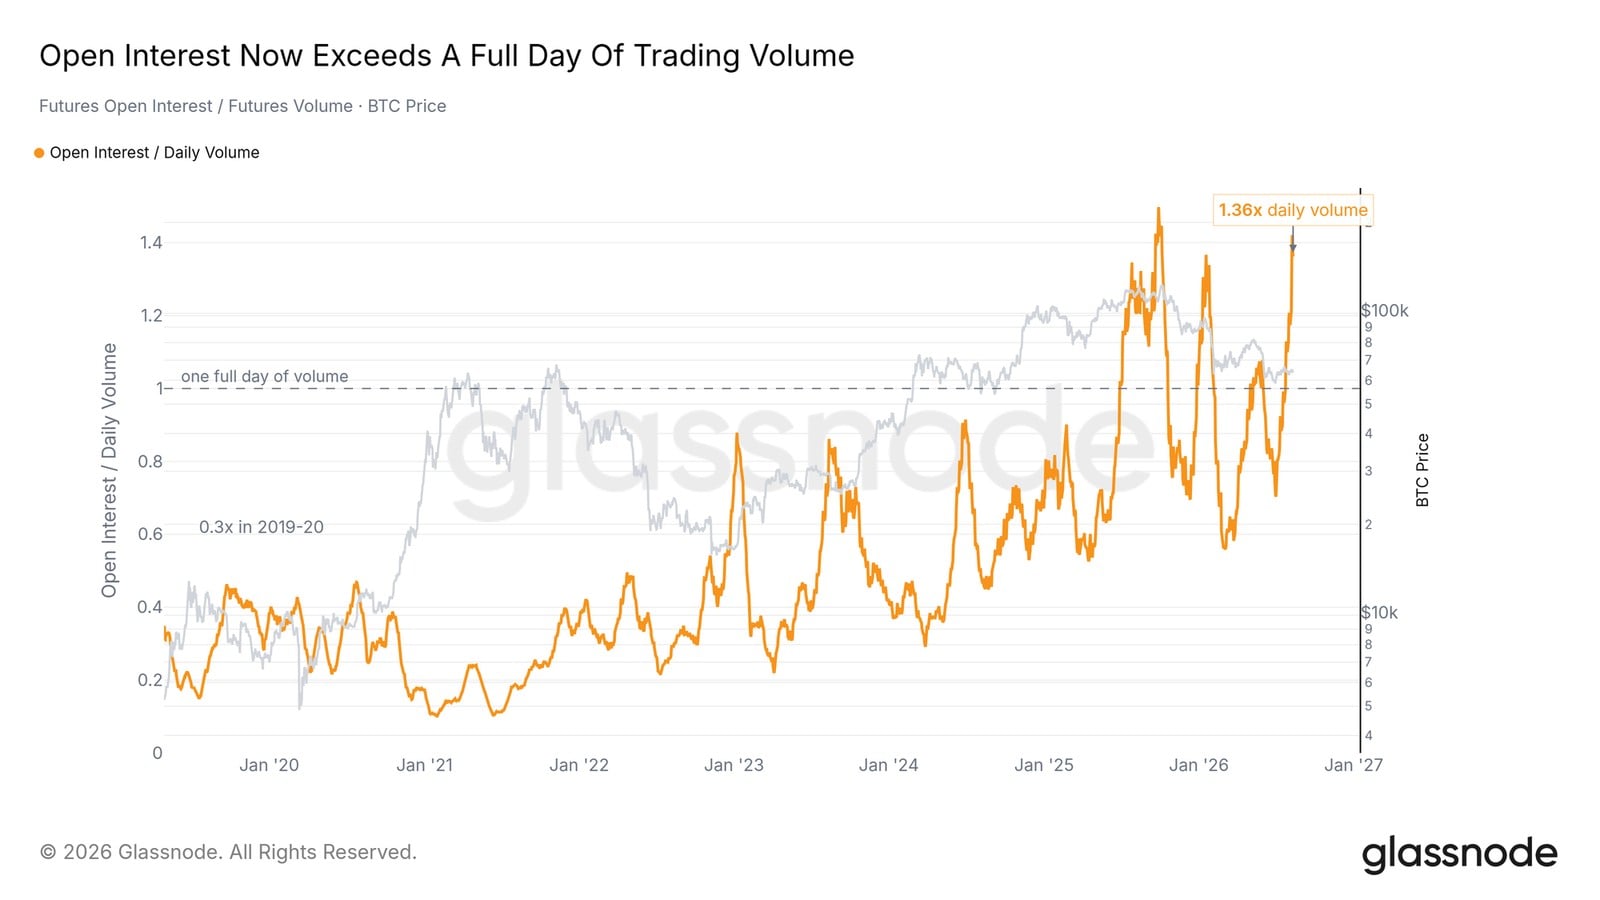
Pressure is also visible at the total volume level. Open interest in futures has exceeded a whole day's futures trading volume, approaching the record set last September; the same ledger during the 2019-2020 period turned over about three times a day. Positions continue to swell, but participation continues to drain, with a large number of old contracts piling up on a quiet market.
The risk is mechanical. When open interest far exceeds daily trading volume, liquidation encounters insufficient stagnant liquidity to absorb, and adverse fluctuations will be amplified to extraordinary levels. Traders have accumulated considerable risk in a market lacking matching demand, primarily in long positions.
Buy demand is increasingly thin
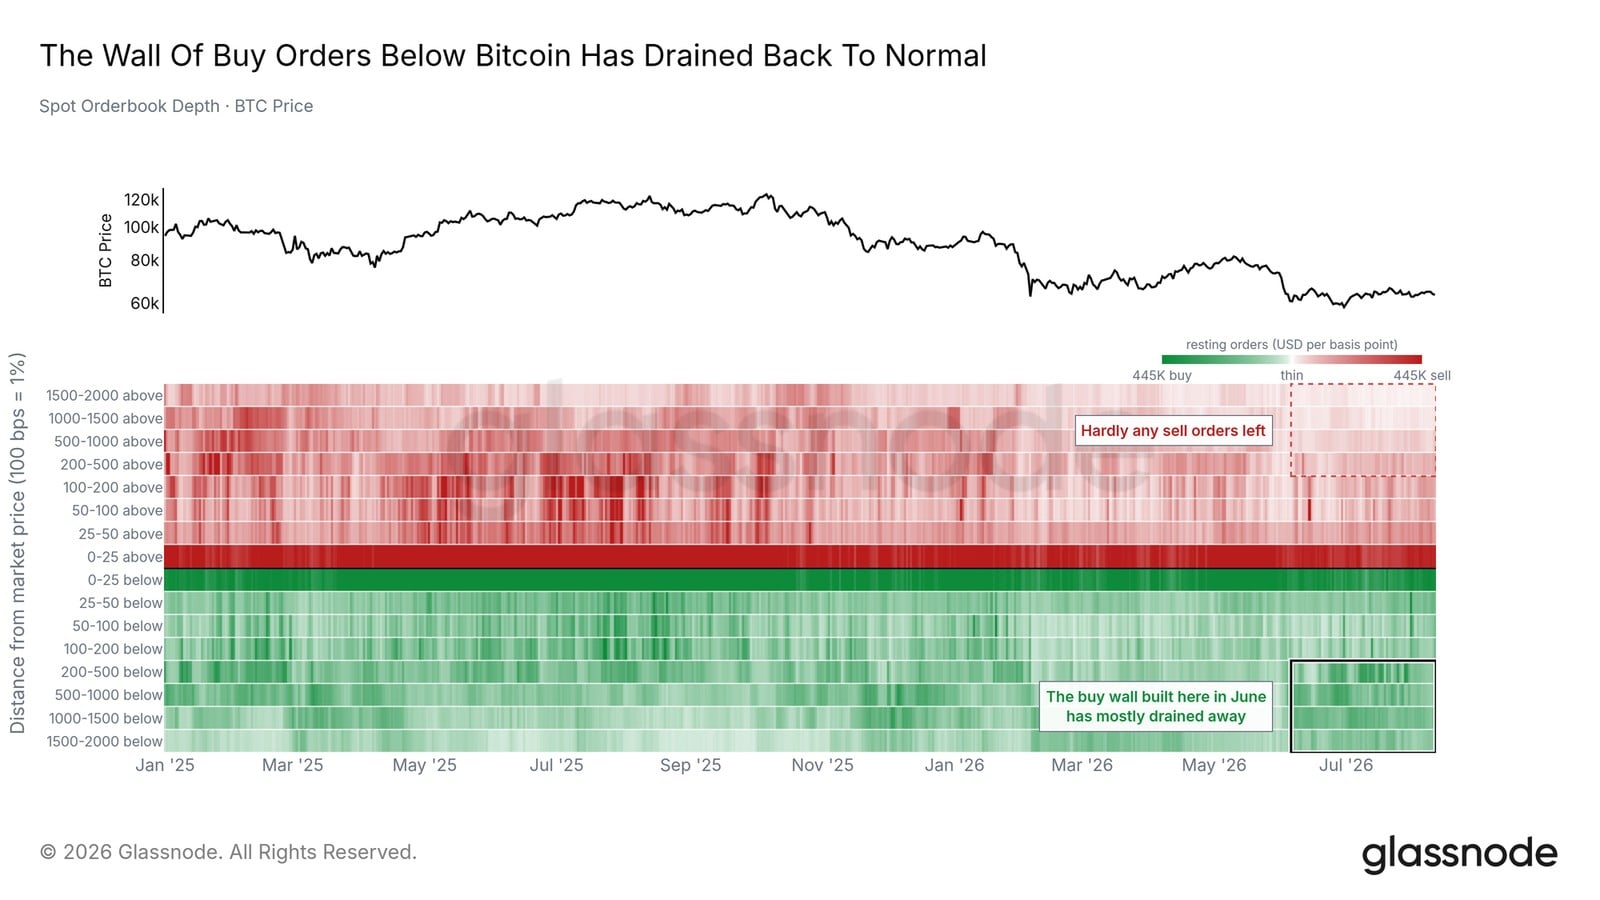
The order book gives the final warning. The stagnant buy orders that defined the summer range peaked in early July and have since shrunk by about one-third; current price support below is weaker than it was during the last test. The sell side is also thin, so the imbalance seems to still lean bullish, but absolute depth is eroding.
If the range is breached, a drop towards the June low of 58,500 USD will fall on an order book even thinner than when it caught price six weeks ago, while the crowded longs above will provide downward pressure. Thin buy orders, heavy leverage, and historically low trading volume, combined, are sufficient to cause exaggerated downward volatility.
Conclusion
Currently in the late-stage bear market compression, added with an abnormal phenomenon: the crowd has preemptively positioned for recovery before demand arrives. The sell side appears constructive—profitable supply is nearing historical bottoms, seller fatigue is at cycle lows, and exchange inflows are slowing. The buy side remains empty, from negligible ETF flows to the quietest spot market since 2019, Bitcoin continues to underperform record-high US stocks.
Reclaiming the short-term holder cost basis of 68,700 USD with volume, paired with ETF inflows, would confirm improvement signals. If this week's modest inflation data still fails to stimulate a rebound, or if prices break below the 58,500 USD range low—under the resonance of thin buy orders and crowded longs—it will negate the bottom logic. We remain cautious, and also patient.
免责声明:本文章仅代表作者个人观点,不代表本平台的立场和观点。本文章仅供信息分享,不构成对任何人的任何投资建议。用户与作者之间的任何争议,与本平台无关。如网页中刊载的文章或图片涉及侵权,请提供相关的权利证明和身份证明发送邮件到support@aicoin.com,本平台相关工作人员将会进行核查。


