
Author: Nancy, PANews
Since reaching its historical high of about $126,000 in October last year, Bitcoin has been in a continuous adjustment phase and has been slow to regain an upward trend. Recently, traditional assets like US stocks and gold have been the first to recover, with market risk appetite gradually warming up, but Bitcoin still maintains a volatile trend without starting a rebound in sync.
Currently, ETF funds are flowing back, and some long-term indicators have started to touch historical lows. Why has Bitcoin not yet initiated a recovery trend? Is the current adjustment close to a cyclical bottom?
US stocks and gold are rising, why is Bitcoin lagging behind?
After the sharp fluctuations and rapid corrections in the US stock market at the end of July, funds have flowed back into risk assets, leading to a swift rebound in US stocks. The S&P 500 index and the Dow have both significantly recovered previous losses, reaching historic highs this week. Technology stocks have become the core driving force behind this round of rebound, with semiconductor and AI-related sectors seeing substantial gains, greatly boosting market sentiment.
Meanwhile, the precious metals sector has also regained favor with funds, with spot gold rising continuously in recent days, briefly breaking above $4,400 per ounce, hitting a near two-month high; silver prices have also risen, with spot silver reaching $66 per ounce, refreshing a seven-week high.
However, Bitcoin has not seen a simultaneous recovery. Previously, during the pressure phase of risk assets, Bitcoin also performed weakly; when US stocks and gold strengthened again, Bitcoin maintained an independent volatile trend.
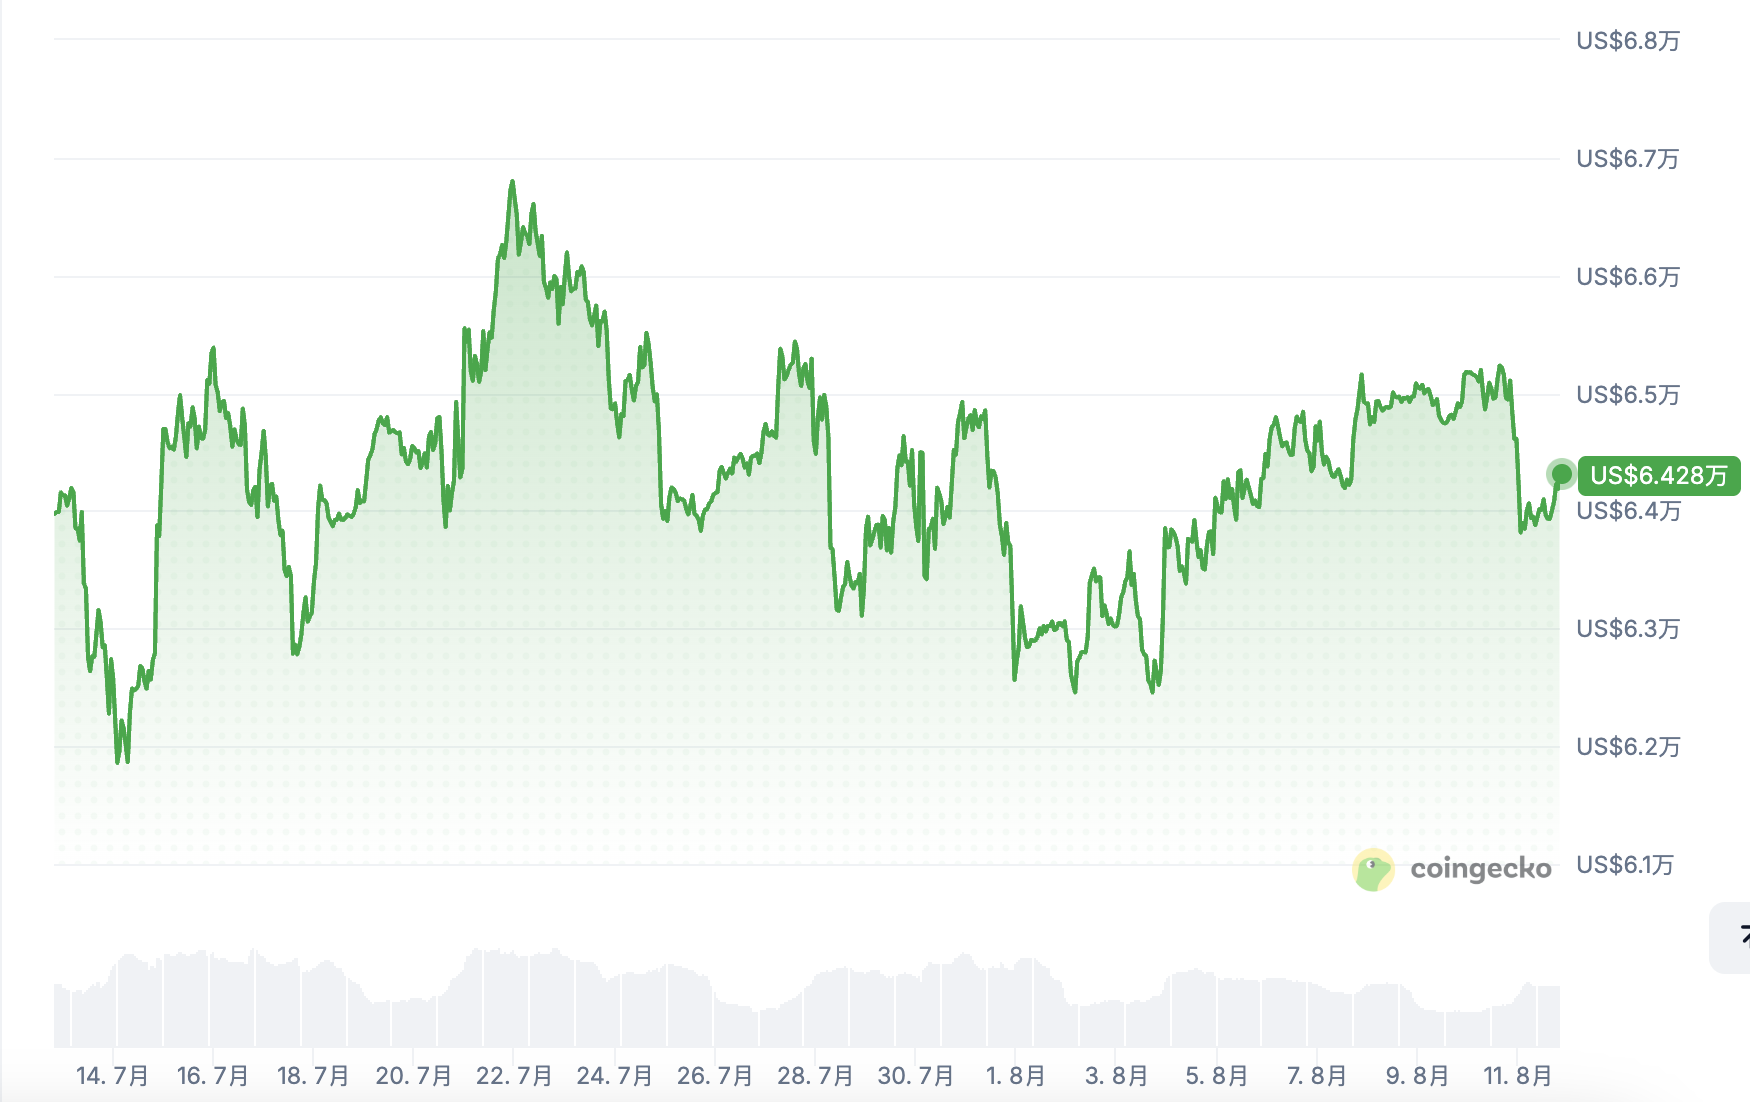
According to CoinGecko data, over the past 30 days, Bitcoin has continued to consolidate sideways, with prices fluctuating repeatedly in the $62,000 to $66,000 range.
Glassnode pointed out that over the past 90 days, the S&P 500 index has risen by about 5%, while Bitcoin has fallen by 20%, with similar divergent trends over the past week. Before Bitcoin re-establishes relative strength against US stocks, the current market is still dominated by US stock trends.
Although on-chain transaction volumes have surged, the flow of spot ETF funds has improved significantly, but the inflow of funds has yet to effectively become fuel for price increases.
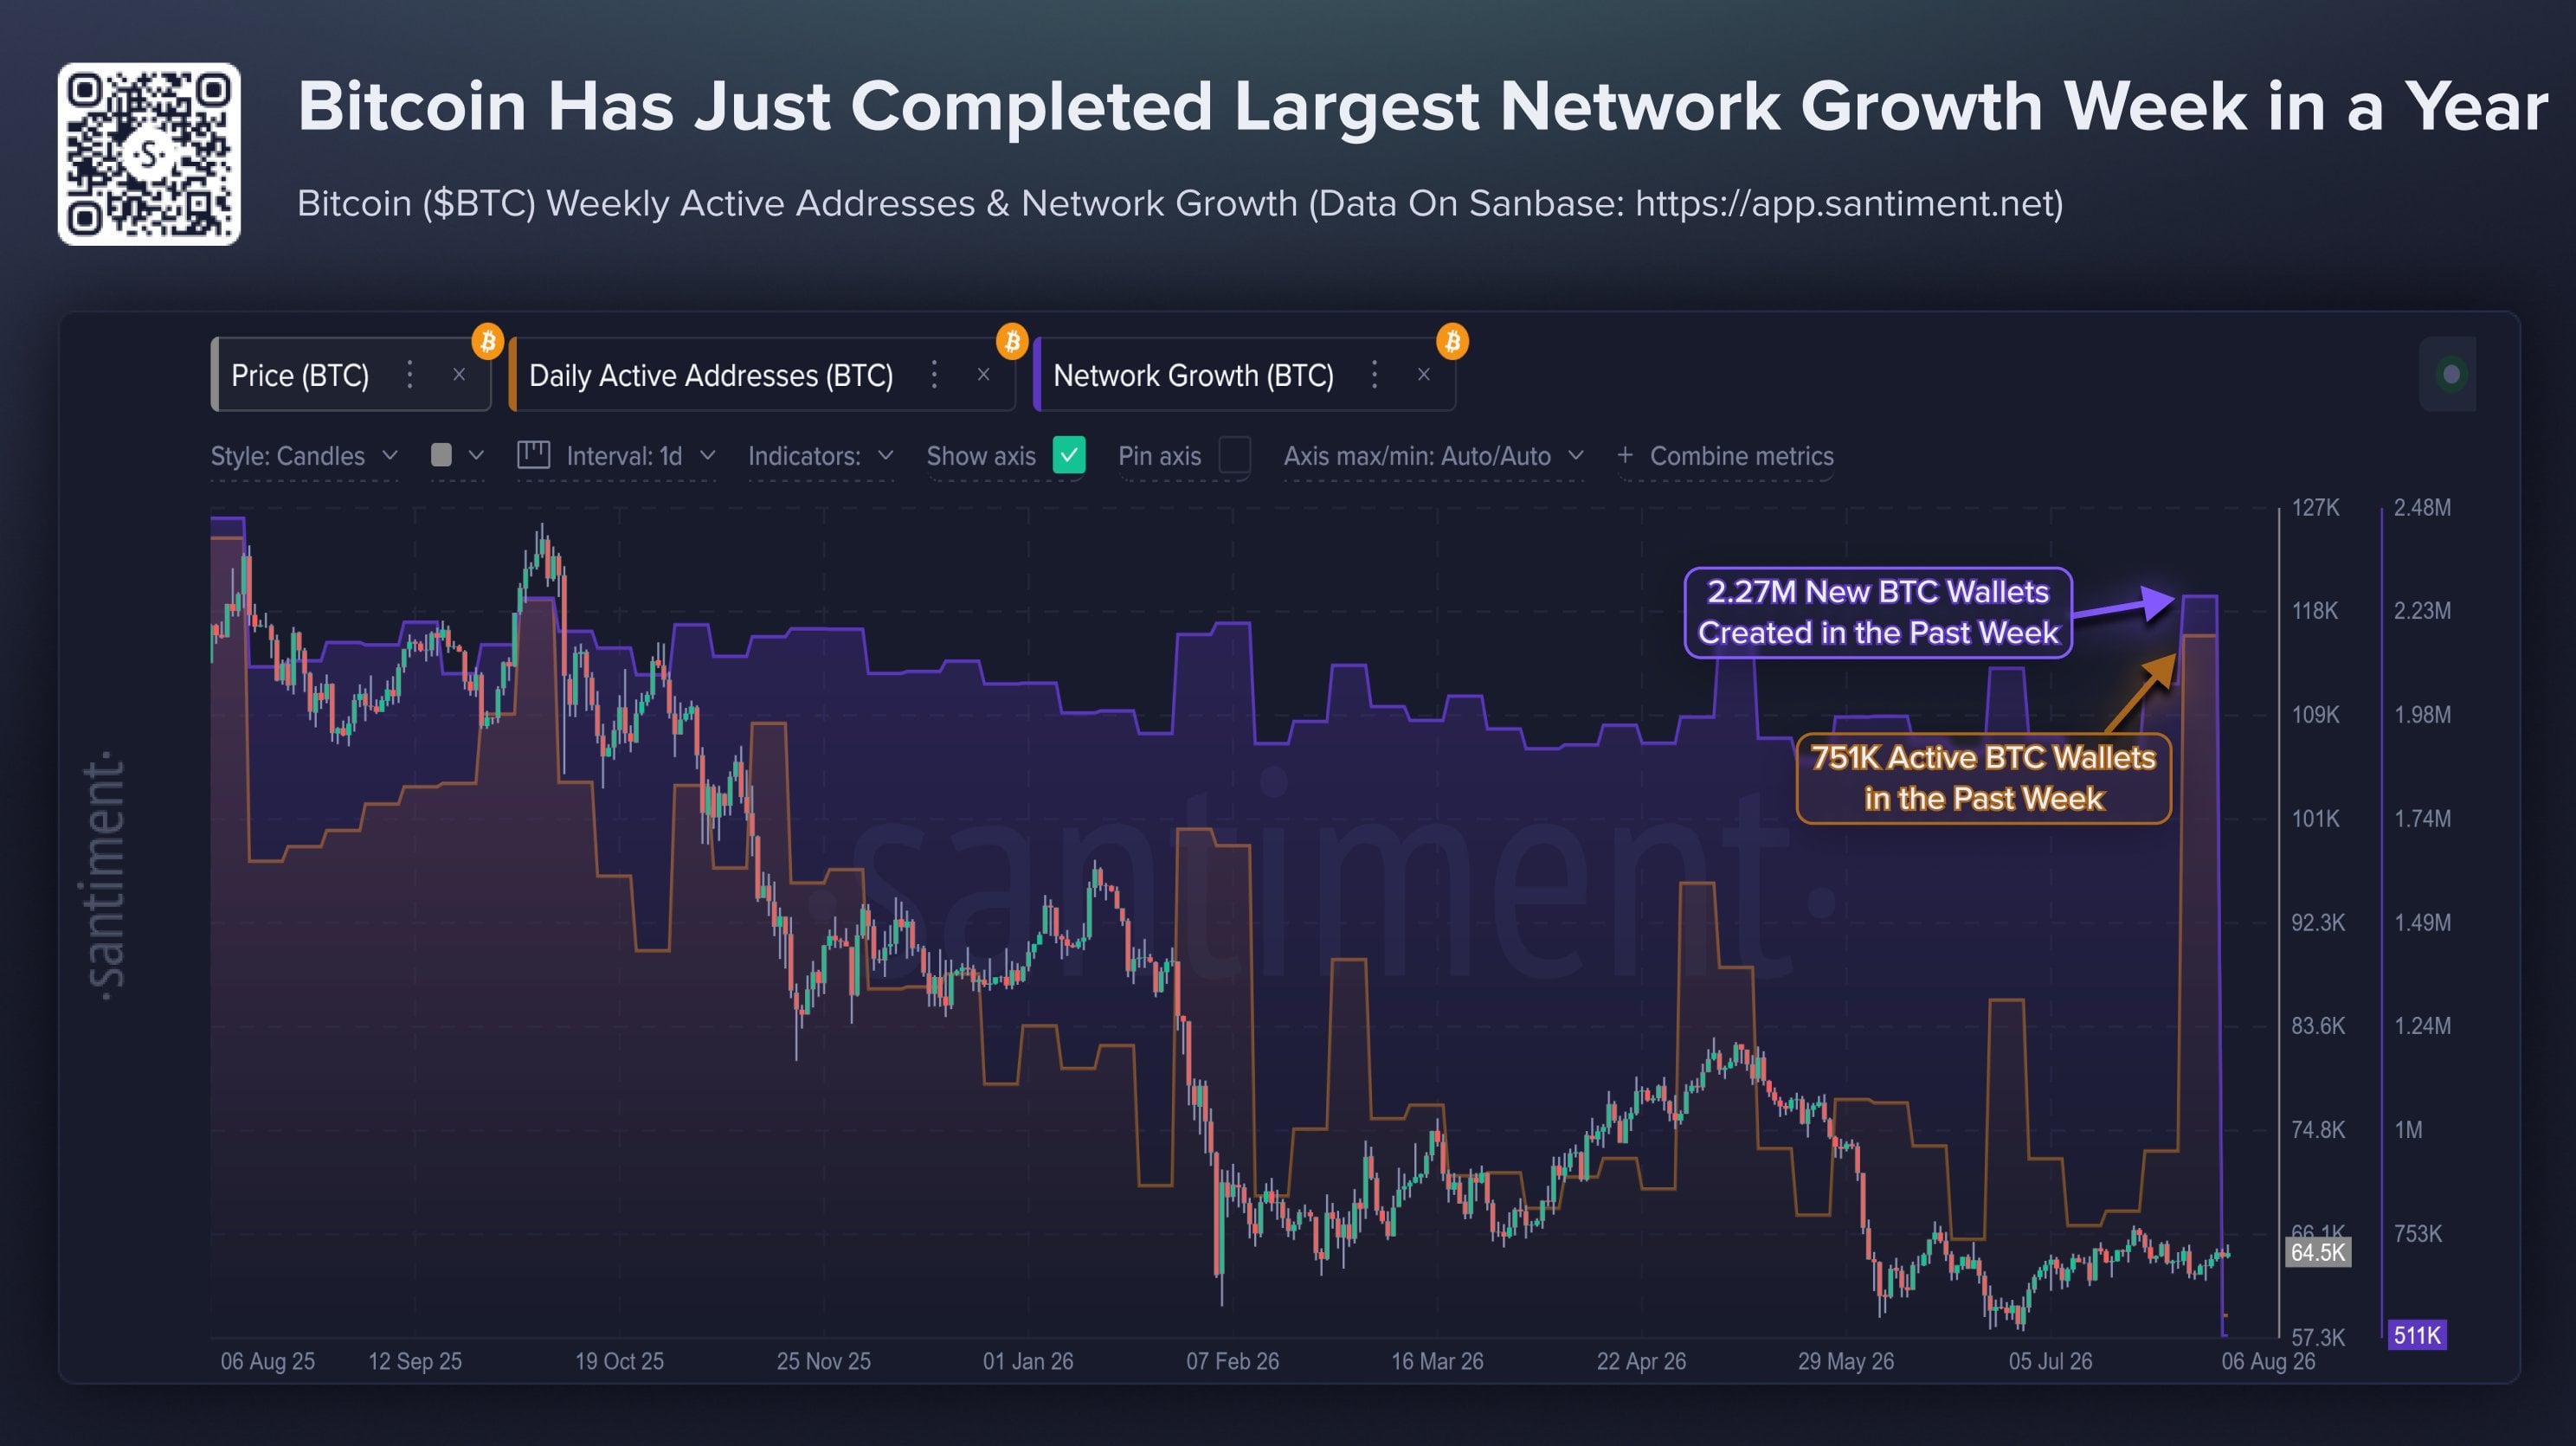
From the perspective of on-chain activity, data from Santiment Intelligence shows that in the past week, the number of new BTC wallets on the network reached 2.27 million, a nearly one-year high; the number of active wallets reached 751,000, breaking a record for the past ten months. However, the significant increase in on-chain activity can be attributed to security concerns raised by the Coldcard wallet incident, prompting some users to transfer funds, create new wallets, adjust custody schemes, and reassess asset security risks, leading to a notable increase in wallet creation and on-chain interactions.
From the perspective of ETF fund inflows, SoSoValue data shows that in the last trading week, the US Bitcoin spot ETF recorded net inflows for five consecutive trading days, with a cumulative net inflow reaching $854 million, marking the best single-week performance since April 17. Since August, the cumulative net inflow of the Bitcoin spot ETF has already exceeded four times the entire month of July's level. This change has reversed the previous outflow pressure. Between May and July, the US Bitcoin spot ETF had a cumulative net outflow of over $6.59 billion, and the market experienced a continuous withdrawal of funds for eight weeks. However, the warming scale of ETF funds is still insufficient to drive a rebound in Bitcoin prices. Market analysis indicates that the recent inflow of funds has mainly been driven by changes in custody demand and improved expectations for interest rate cuts due to weak employment data, making it difficult for the current buying scale to fully offset the persistent selling pressure in the market.
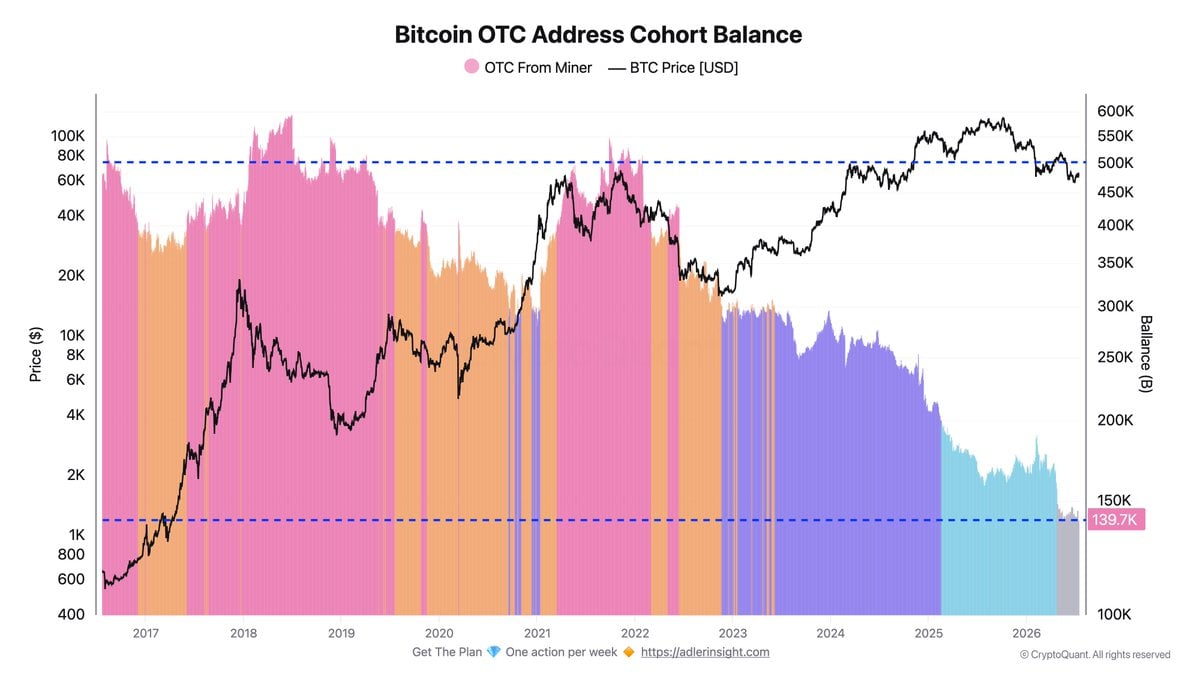
Currently, the Bitcoin market is facing continuous selling pressure from miners and crypto data companies. As profit margins narrow, operating costs rise, and demand for AI data center transformation increases, some mining companies have begun selling Bitcoin assets to cover cash flow needs, repay debts, or adjust business direction. CryptoQuant data shows that since November 2021, the balance of BTC held by miner-related over-the-counter trading addresses has dropped from about 500,000 to 139,700, a decrease of nearly 72%.
At the same time, crypto data companies have also started adjusting their Bitcoin holding strategies by selling some assets to replenish liquidity, repurchase shares, or pay shareholder returns, and even reducing holdings to ensure survival. For example, Strategy has sold a total of 6,948 BTC since the end of June, cashing out approximately $432 million.
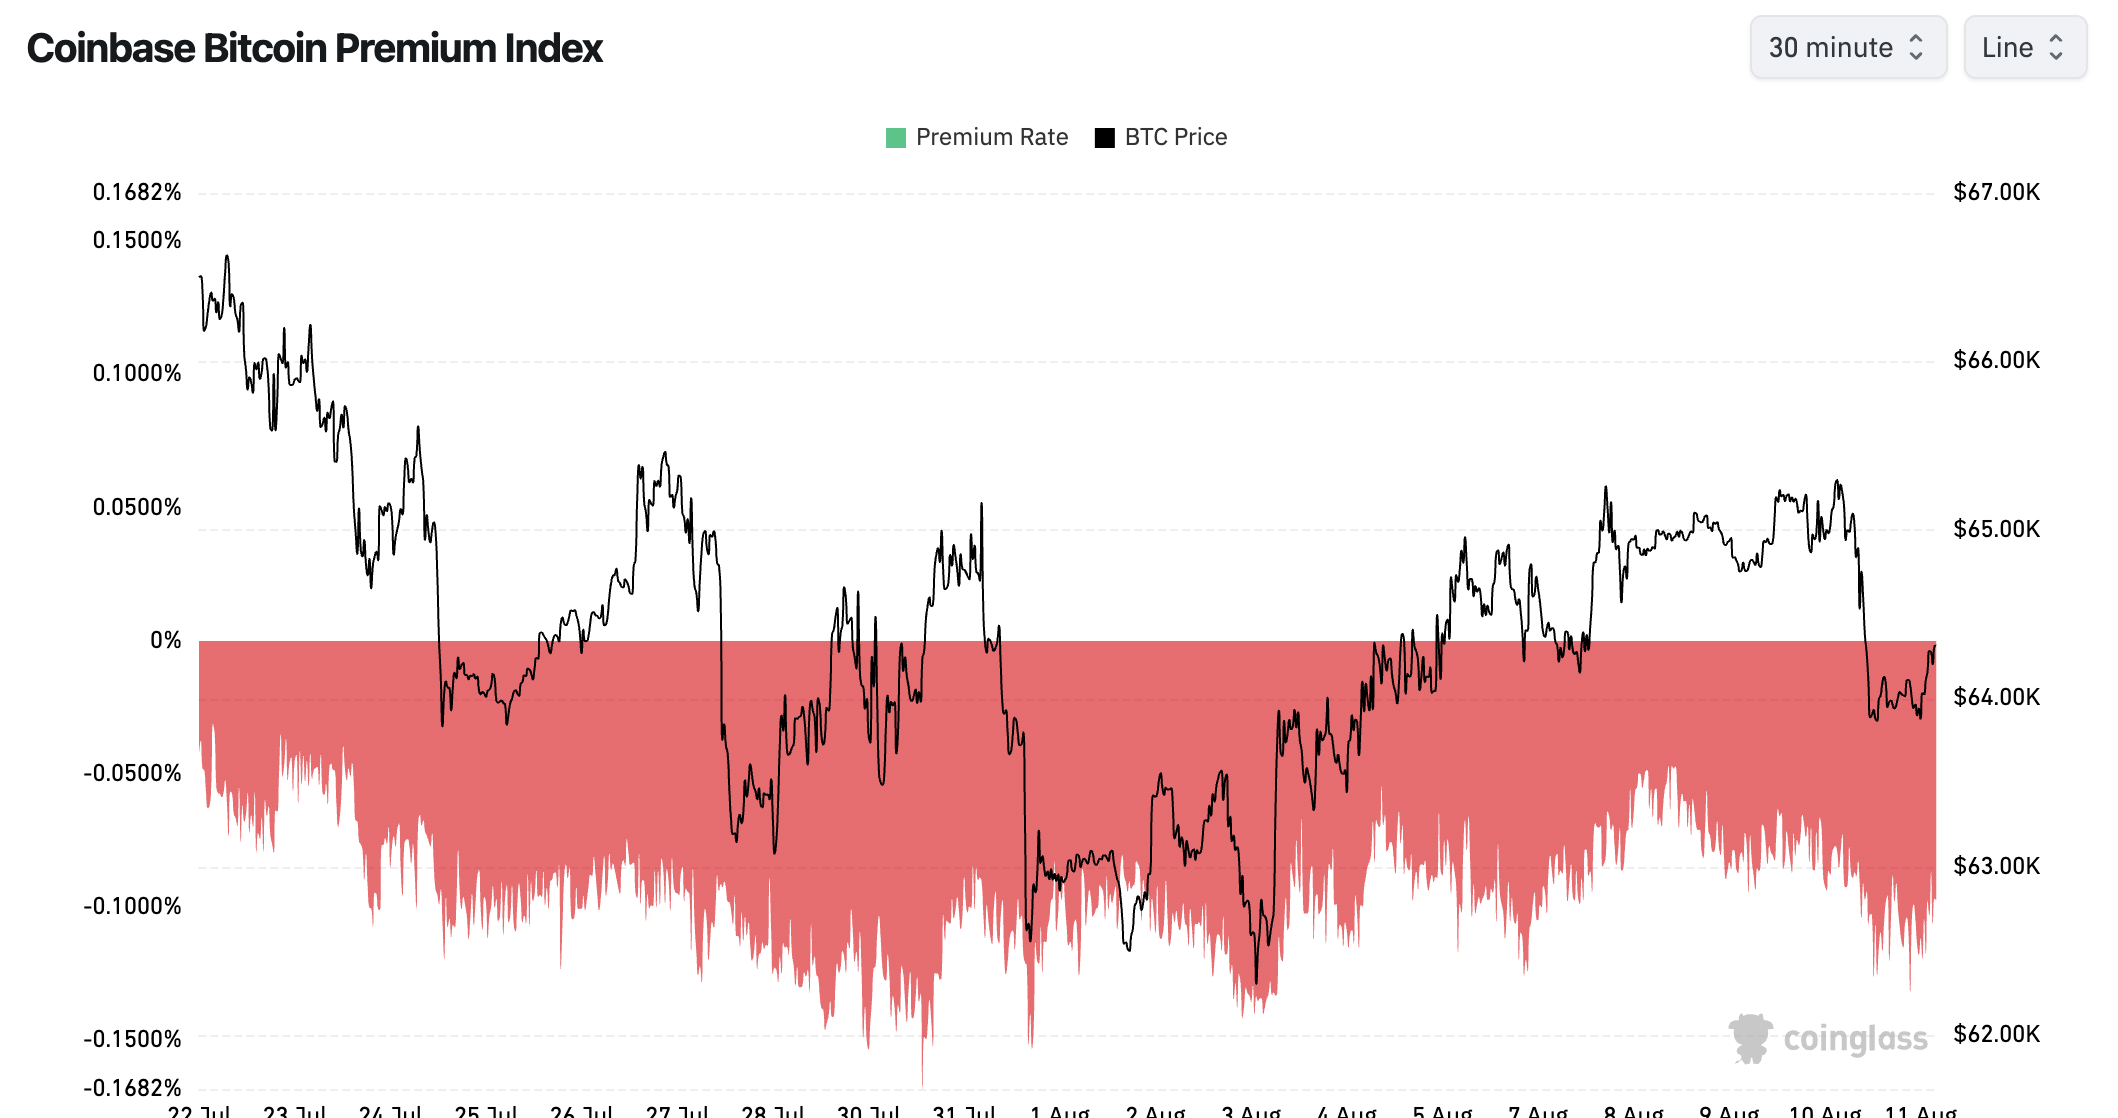
Furthermore, the purchasing power in the US spot market remains sluggish. Coinglass data shows that the Coinbase Bitcoin premium index has remained in negative territory for 80 consecutive days (from May 19 to present), with the latest value at -0.0868%, marking the longest negative premium cycle in history, twice the previous 40-day record. Historical data show that a sustained negative premium on Coinbase typically indicates weak buying demand from US investors or strong selling pressure still existing in the market.
Partial bottom signals emerge, cyclical bottom still to be confirmed
Historically, after Bitcoin reaches a cycle top, it typically takes about 12 to 13 months to welcome the final bottom. If this cycle continues to follow this historical rhythm, the market cycle low may have to wait until the fourth quarter of 2026. Is there currently a bottom signal for Bitcoin?
The list of bottom indicators tracked by PAData, a crypto market data and cycle indicator platform under PANews, shows that Bitcoin has currently only shown partial bottom signals.
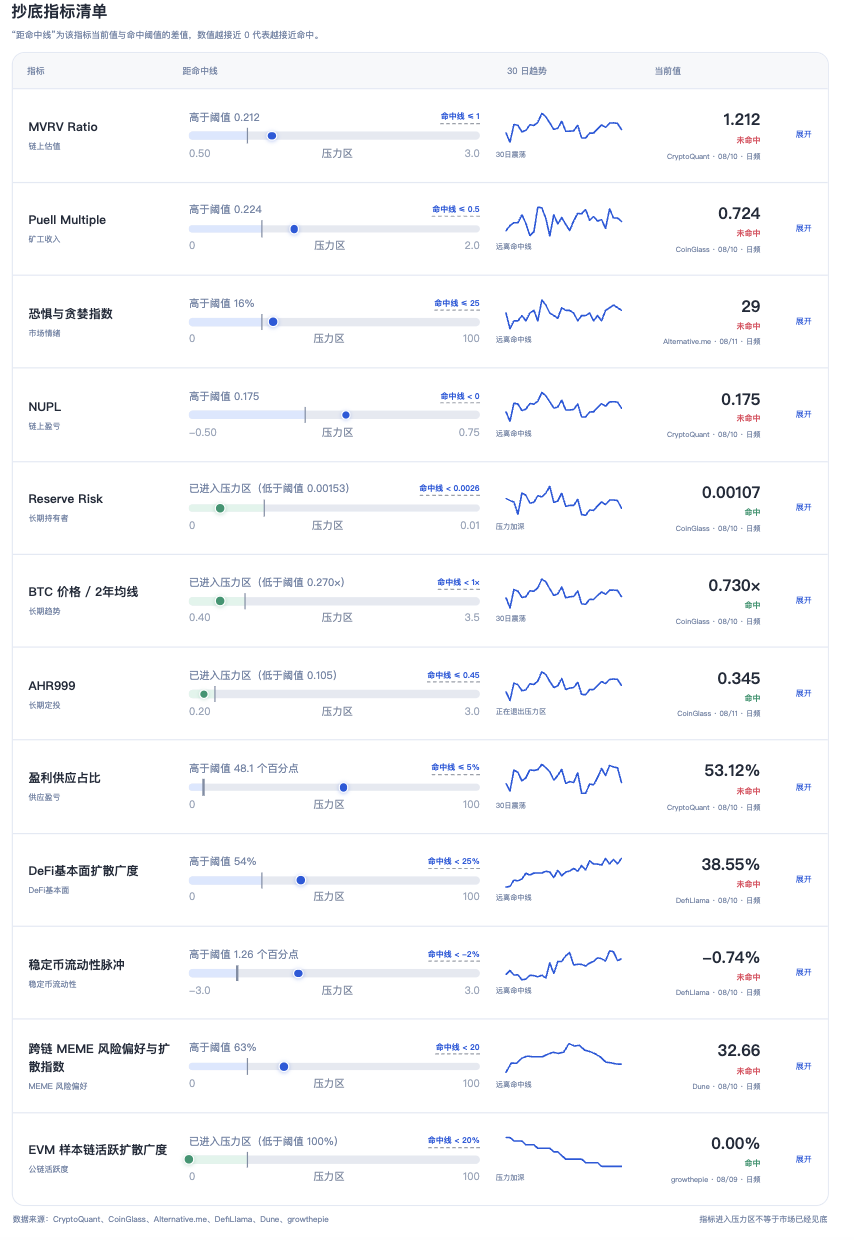
This indicator covers multiple data sources including CryptoQuant, CoinGlass, Alternative.me, DefiLlama, Dune, growthepie, among others. The "distance to hitting line" is used to measure the distance between the current indicator value and the historical bottom threshold. The closer the value is to 0, the nearer it is to triggering a historical bottom signal.
Among the 12 core bottom indicators, currently, 4 indicators have entered the hitting range: Reserve Risk (long-term holders), BTC price/2-year moving average, AHR999 (long-term dollar cost averaging), and EVM sample chain active diffusion breadth.
Currently, Reserve Risk has fallen to 0.00108, the BTC price/2-year moving average indicator has dropped to 0.73 times, AHR999 has reached 0.345, and EVM sample chain active diffusion breadth has fallen to 0. These indicators mainly reflect long-term holder confidence, price cycle positioning, and on-chain ecosystem activity levels, all having entered historical pressure zones, meaning that Bitcoin's current price represents a significant discount compared to long-term trends, and its long-term allocation value is increasing.
However, entering the pressure zone of the indicators does not mean that the market has already bottomed. Historical cycles show that Bitcoin bottoms are typically not triggered by a single indicator but occur after multiple dimensions reach extreme levels simultaneously.
Currently, from the perspective of valuation, market sentiment, liquidity, and on-chain profit status, the market is still a certain distance away from the historical extreme bottom.
In terms of valuation, the MVRV Ratio (on-chain valuation) is currently at 1.212, and it has not yet fallen below 1, which is the historical undervalued line. MVRV assesses the overall profit status of the market by comparing Bitcoin's market value and realized value. Historical data shows that when this indicator falls below 1, it typically means the market enters a deep adjustment phase, often corresponding to accumulation areas in the late stages of a bear market.
Regarding on-chain profit status, NUPL is currently at 0.175, still not turning negative. This indicator measures the net value of unrealized profits and losses in the market. When NUPL drops below 0, it indicates that all holders are in a loss state. Meanwhile, the miner income indicator, Puell Multiple, is currently at 0.755, still some distance from the historical pressure zone below 0.5. Historical data indicates that significant macro bottoms have occurred when Puell Multiple is below 0.5.
In terms of market sentiment, the fear and greed index is currently at 29, indicating that the market is in a state of fear, but it is still some distance from extreme fear levels. This suggests that investor risk appetite is declining, but there has not yet been a large-scale panic sell-off typical in the bottom phase of cycles.
Regarding supply structure, the proportion of profitable supply is still at 53.12%, meaning that more than half of the Bitcoin supply is still in a profit state. During historical bottom phases, this indicator typically drops below 5%, and the market often needs to experience a more thorough release of losses and a transfer of positions.
In terms of liquidity, the stablecoin liquidity pulse is currently at -0.74%, indicating a tightening of the stablecoin funding environment. Historical observations show that when this indicator drops below -2%, it typically corresponds to a significant decrease in the supply of fiat reserve stablecoins within 30 days, exacerbating market liquidity pressure. Currently, this indicator is still some distance from the extreme tightening range.
Additionally, some on-chain ecological indicators have not yet shown a comprehensive bottom signal. Currently, the DeFi fundamental diffusion breadth is 38.55%, which is still a distance from the deep contraction range (0-25%). This indicator is used to measure the extent of DeFi operational activity diffusion; entering a low level typically means the industry activity is experiencing widespread contraction. The cross-chain MEME risk preference index is at 32.66, above the cooling zone's (0-20) hitting boundary, indicating that although market risk preference has clearly diminished, the funds have not completely entered an extremely quiet state.
In summary, Bitcoin has currently shown some bottom signals in the market, but there is still a lack of sufficient cycle reversal confirmation. Whether Bitcoin can initiate a recovery trend later will still need to pay attention to the sustainability of fund inflows, the release of selling pressure, and further changes in key on-chain indicators.
免责声明:本文章仅代表作者个人观点,不代表本平台的立场和观点。本文章仅供信息分享,不构成对任何人的任何投资建议。用户与作者之间的任何争议,与本平台无关。如网页中刊载的文章或图片涉及侵权,请提供相关的权利证明和身份证明发送邮件到support@aicoin.com,本平台相关工作人员将会进行核查。


