
Author:Gelonghui
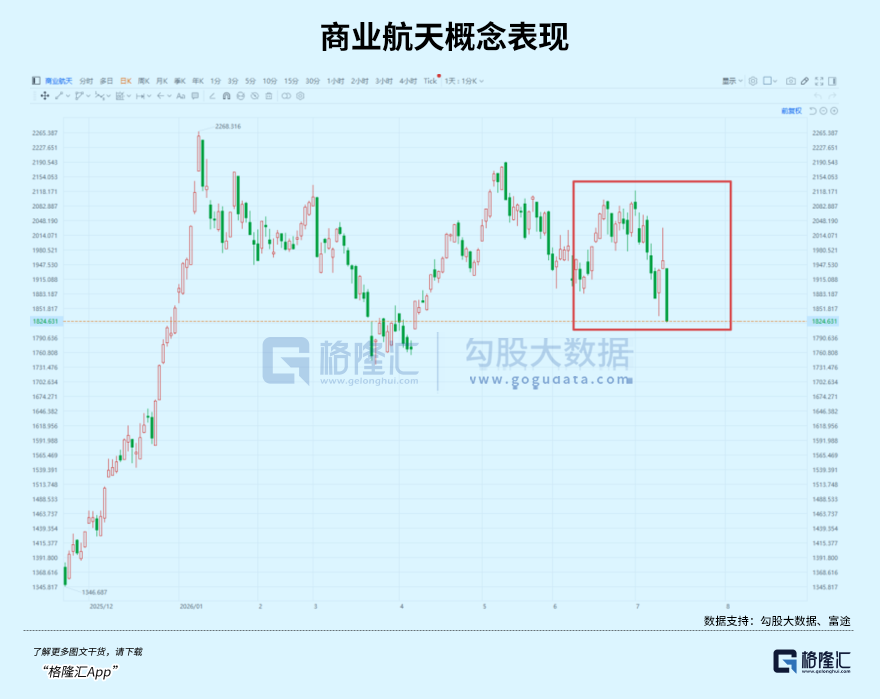
On July 13, at the end of the long summer, the commercial aerospace sector surged and then fell sharply, with a significant drop across the board.
Electric Power Science and Technology Blue Sky fell over 10%, while Aerospace Power, Xunwei Communication, and Tongyu Communication also declined. The Shenzhen Composite Index and the ChiNext Index both dropped more than 2%, and the previously popular AI direction saw a corrective rebound, with funds in the aerospace sector being pulled out all at once.
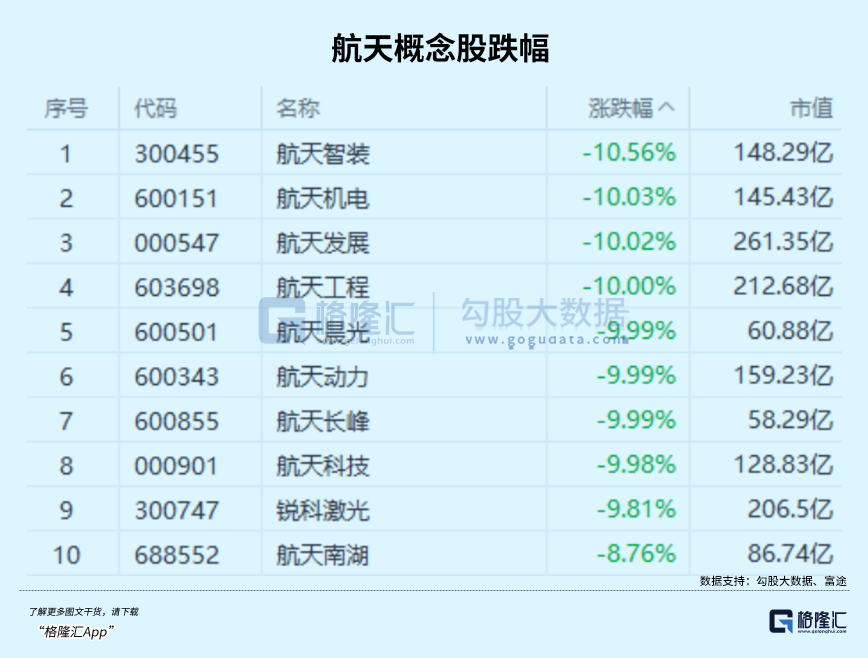
Just a weekend ago, on July 10th, the successful maiden flight of the Long March 10 B and the global first rocket net recovery news had just lit up the entire sector. More than 30 stocks hit the daily limit. China Satellite and China Satcom, the two major giants worth over a trillion, were immediately locked at their limits.
On Friday there was a limit-up wave. On Monday it was a crash day.
What exactly happened with such extreme divergence?
01. Who is Pricing?
The Long March 10 B is not an ordinary launch.
On July 10 at 12:15 p.m., this 63-meter long rocket with a launch thrust of 890 tons lifted off from Hainan's commercial launch site. About six minutes later, the first and second stages separated, and a booster stage returned vertically, being caught by the flexible recovery net of the "Navigator" recovery platform — China's first controlled recovery of a booster stage for a large-capacity rocket and the global first net recovery. China became the second country after the United States to master this technology.
Such solid news only held for a weekend.
Interestingly, market discussions were rampant, with almost unanimous blame directed at quantitative trading.
The emotional cycle of "sudden drop → sudden rise → pullback" is rooted not in the news, but in the structure of money.
According to the Securities Times, mutual funds and social security funds are significantly underweighted or even short on commercial aerospace. Stocks like Sry New Materials and Information Development rose over 100%, but none of the top ten circulating shareholders have mutual fund involvement. Although Aerospace Power and Aerospace Development have institutional participation, the overall position size is limited.
This indicates that institutional funds have yet to form a widespread, systematic heavy holding pattern; the overall capital structure remains dispersed. Without a long-term bottoming position to support it, the sector becomes a ship without an anchor. It attracts many when it rises but finds no one to catch it when it falls.
Data shows that quantitative funds account for 20% to 30% of A-share trading volume. In sectors lacking institutional bottom positions, its influence is exponentially amplified — there’s no ballast to counter its algorithmic commands.
The underlying logic of quantitative trading is volatility arbitrage, which requires creating fluctuations to make profits. Limit-up waves and crash days are two sides of the same strategy for it. When hot spots arise, algorithms push up stock prices ahead of retail investors; once retail investors follow in, algorithms reverse and sell.
This mechanism operates especially smoothly in the commercial aerospace sector, as there's not enough long-term counterpart capital to absorb its selling pressure. This sector, absent of public fund participation, is precisely where the most intense reshuffling occurs.
On the July 10 trading day, the buy rankings for Aerospace Development from buy one to buy five were dominated by Shenzhen Stock Connect, institutions, and speculative trading departments. At sell five, Dongfang Caifu Lhasa Tongyi Road No.1 Trading Department was prominently featured. On the limit-up day, institutional net purchases were 85.71 million, while net selling by Lhasa retail investors was 18.06 million.
Moreover, this company has appeared on the leaderboard 8 times in the past six months, with an average drop of 10.66% five days after appearing. Funds that entered on the day of the limit-up experienced an average loss of over 10% five days later.
This is not an isolated incident for any particular stock; the entire sector lacks long-term capital anchoring, being repeatedly sliced by algorithms to the beat of the metronome.
However, contrasting sharply with the chaos in the secondary market is the ongoing bets in the primary market.
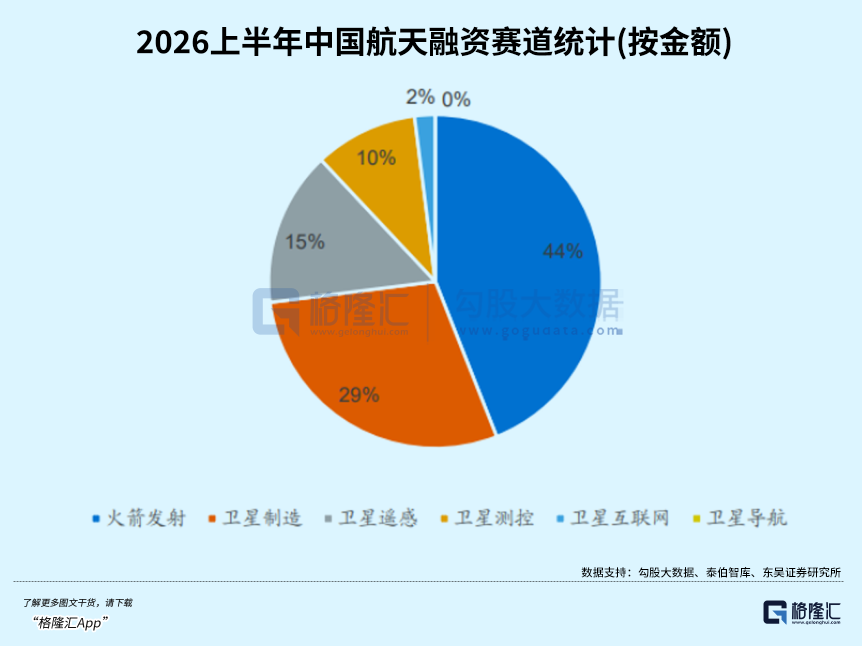
In terms of industrial capital, according to statistics from Taibo Think Tank, in the first half of 2026, there were 89 publicly disclosed financing events in domestic commercial aerospace, with total financing amounting to 15.13 billion yuan, of which financing in the rocket launch track accounted for 44%, making it the sub-sector with the largest scale of capital investment. National and local guiding funds are the main force of patient capital, driving the industry from "spontaneous exploration" to "national systematic guidance."
SpaceX is the best example. After going public this year, its market value soared to 1.77 trillion dollars, while its net loss for 2025 is projected to be 4.94 billion dollars. The market granted nearly 2 trillion in valuation to a company that lost nearly 5 billion.
The money in the primary market is betting on the long-term space economy — 28.3 trillion in market scale (according to CCID Think Tank), with a clear demand for launching tens of thousands of satellites in five years, and the cruel rules of "first come, first served" for orbital resources.
However, this pricing logic is not on the same timeline as the secondary market. The primary market allows a company to post a loss of 4.9 billion dollars, as long as its rockets can be recovered 34 times, its Starlink users exceed 9 million, and it has captively positioned tens of thousands of satellites in orbit. It looks at who has capacity in five years and who occupies the orbit in ten years. Profit sheets can wait, but orbital windows do not.
However, the current secondary market, dominated by retail and quantitative trading, has submerged the real progress of the industry in short-term algorithmic games.
The question is, when will the secondary market catch up with the primary market's pricing logic?
02. Valuation System Under Scrutiny
If you only look at one day's stock price, commercial aerospace appears to be a round of quantitative harvesting. But if you extend the time to nearly two years, the situation is completely different.
In the past two years, this sector has experienced several market cycles.
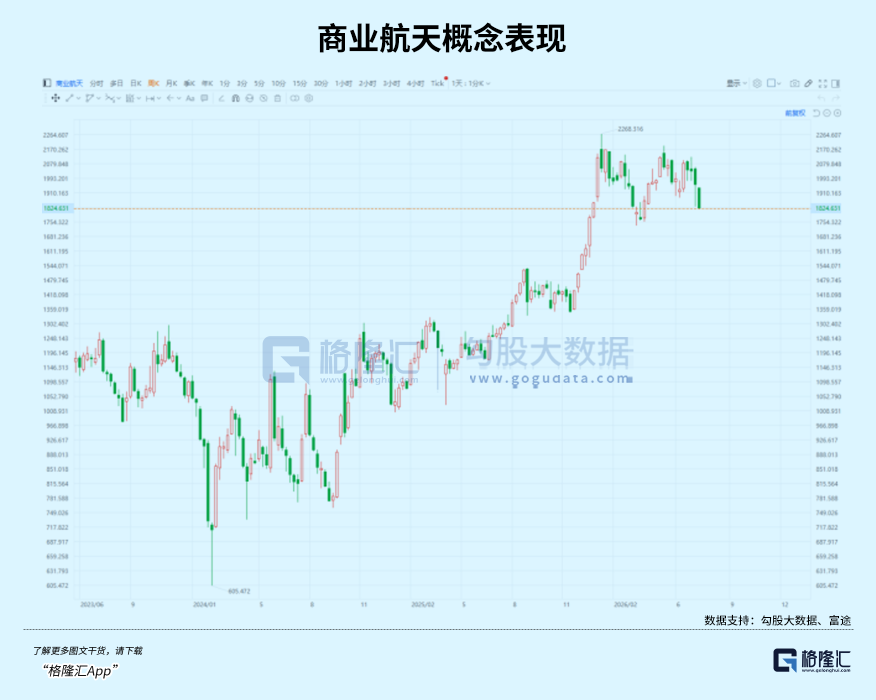
The first wave, early 2025. China submitted an application to the International Telecommunication Union for frequencies and orbital resources for 203,000 satellites, covering 14 constellations. Prior to this, China had never reported orbital resources at such a scale. The market responded immediately, speculating on the "Chinese version of SpaceX" concept. The price-to-earnings ratio of China Satellite surged to 2400 times. China Satcom itself issued a warning about the "obvious hot potato effect."
But its significance does not lie in the rise — it is in the first time that the recognition of "space is a scarce resource" was injected into the market.
The second wave, late 2025. The National Space Administration established a Commercial Aerospace Department, the first national-level dedicated regulatory agency. The fifth set of listing standards for the Sci-Tech Innovation Board was released, clearing financing obstacles for unprofitable rocket companies. Blue Arrow Aerospace sprinted for the "first stock of commercial aerospace" in the A-shares. The driving factor shifted from concept to policy.
However, the recovery tests of Zhuque III and Long March 12 A failed. With the technology still unproven, the market tide was forced to recede.
The third wave, spring 2026. Reusable rockets entered a period of intensive testing. Zhuque III remote 2 completed static ignition, Li Jian II successfully had its maiden flight, and Long March 10 B was scheduled to take off in April. At the same time, the first quarter financial reports revealed the profit structure of the industry chain for the first time — upstream profits surged, while downstream losses were enormous, with a glaring disparity. The driving factor upgraded again: from policy to technology verification.
However, after the ignition of Tianlong III, there was an anomaly in flight, resulting in a failed maiden launch. The explosion on April 3th let the market regain composure.
In the three trading days before recently, the commercial aerospace sector fell 8%, with Shenjian shares hitting their limit down, and several stocks dropping over 10%. Until noon on July 10th, when Long March 10 B took off from Hainan and first successfully achieved a complete "on-orbit launch + controllable recovery" closed-loop process, becoming the second country to master large-capacity recoverable rockets after the United States.
Does this mean a new round of market activity has started? No one can guarantee it. But one thing is certain:
Through several market cycles, the path of driving force upgrade is very clear: concept → policy → technology verification.
The capital market's pricing power seems to be following a different path. From the first wave led by speculative funds, to the second wave resonating with retail investors, to the increasingly impactful quantitative models in recent rounds.
This disconnection is unsustainable. Because the logic on the industrial side is becoming clearer and clearer, clear enough to be expressed through simple arithmetic.
Take the most core recovery technology, for example.
The primary rocket body accounts for over 70% of the rocket cost. Recovering it saves 70% of manufacturing costs. SpaceX’s Falcon 9 has achieved 34 reuses, bringing its per kilogram launch cost down to 19,000 to 28,000 RMB. The current launch price in China is 50,000 to 100,000 RMB per kilogram. Blue Arrow Aerospace's Zhuque III aims to go below 20,000 RMB per kilogram. If reusability truly matures, industry estimates suggest it could eventually drop below 1,000 RMB per kilogram.
Behind this is a simple mismatch of supply and demand. The GW constellation plans for 12,992 satellites, and the Qianfan constellation for 13,904 plus 1,296 satellites, totaling over 50,000 satellites. But there are only 18 commercial launch sites nationwide, with 7 more under construction. The average waiting time is one month. Many satellites and few rockets mean that rocket capacity is a strategic resource.
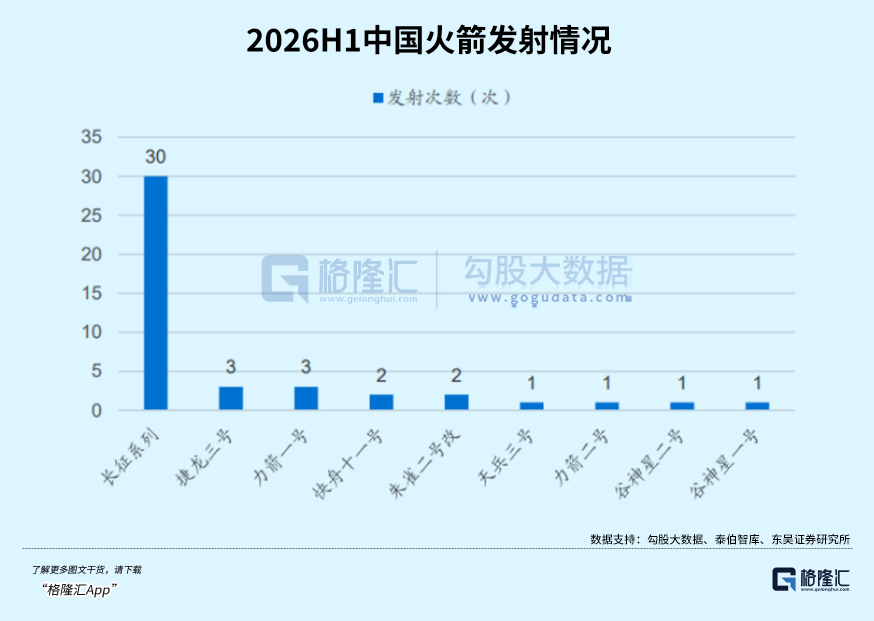
Yuanhe Chenkun's "Low Earth Orbit Satellite Internet Industry Research Report" clearly ranks investment priorities: complete rockets greater than satellite operators, greater than complete satellites, greater than satellite components. The logic it provides is, whoever conquers recovery first and lowers costs will hold the total valve of constellation markets. The private rocket track may ultimately only accommodate two to three leading companies.
In the second half of the year, this industrial logic will also face a concentrated pressure test.
The recovery test of Zhuque III remote 2 is the most recent examination. If successful, it will become the first liquid rocket of a private enterprise to achieve orbital recovery. Zhishen Star I is about to make its maiden flight, and after the failures in April, Tianlong III will also re-launch in the second half of the year. Long March 10 B aims to attempt its first reuse flight by the end of the year — the difficulty of this step is no less than that of its maiden flight.
Actions in the capital sector are also synchronously accelerating. Following its IPO, SpaceX's market value surged to 1.77 trillion dollars, drawing a reference line for global commercial aerospace. Blue Arrow Aerospace's Sci-Tech Innovation Board IPO has moved to the inquiry stage, with China Aerospace Science and Technology Corporation closely following. These upcoming rocket companies entering the capital market will first face public market scrutiny of their valuation systems.
The mid-year reporting window is also on the horizon. China Satellite just disclosed its performance forecast for the first half of the year on July 12: net profit ranging from 30.5 million to 36.5 million, turning a profit compared to the same period last year. A satellite manufacturing leader with a market value of over a billion had profits just over 30 million in six months.
Meanwhile, upstream Zhenlei Technology reported over 400 million in revenue in Q1 with a 31% profit margin, while Polite reported a 40.5% revenue increase and a doubling of net profit for Q1. Downstream Aerospace Hongtu experienced an 86% drop in Q1 revenue and has already entered the *ST stage.
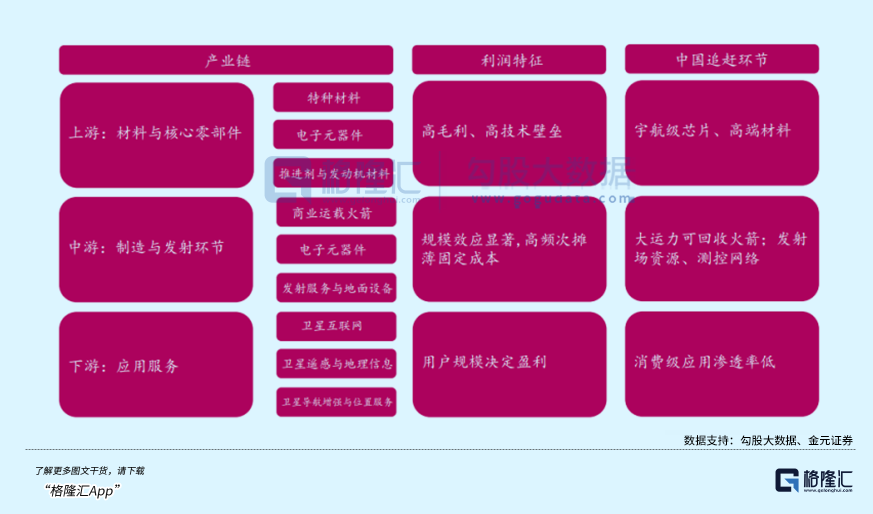
These catalysts are intricately connected. Successful rocket validation, IPO landing, reusable flights, bulk orders, and mid-year reports being fulfilled — every step of validation adds weight to the industrial logic and affects the timeline of the transfer of pricing power.
03. Epilogue
The countdown to a rocket launch and the entry of funds are not on the same timeline.
The successful recovery of Long March 10 B marks a historic breakthrough for China’s commercial aerospace. The recovery technology has crossed the most significant hurdle, and the path for cost reduction has been opened. From an industrial perspective, this is a clear positive signal.
Commercial aerospace is a long slope with thick snow. The industry trend cannot be achieved overnight; it is a gradual evolution, and last week’s technological breakthrough is just a key step in this long process.
However, positive signals from the industry do not equate to immediate recognition from the market.
Whether funds are sufficiently convinced that this track has reached a turning point still needs verification. Currently, the fluctuations in the sector remain extremely intense — limit-ups on Friday and crashes on Monday, with the pricing system dominated by quantitative trading still in play. The profit differentiation of upstream gains and downstream losses has not yet converged.
Investors looking to layout in this sector must recognize: there is still a considerable distance between the industrial turning point and the pricing power turning point.
免责声明:本文章仅代表作者个人观点,不代表本平台的立场和观点。本文章仅供信息分享,不构成对任何人的任何投资建议。用户与作者之间的任何争议,与本平台无关。如网页中刊载的文章或图片涉及侵权,请提供相关的权利证明和身份证明发送邮件到support@aicoin.com,本平台相关工作人员将会进行核查。


