Author: Yashu Gola
Translation: Deep Tide TechFlow
Deep Tide Introduction: Bitcoin fell below the $60,000 mark on Thursday, triggering a 4-hour arc top and a daily bearish flag breakdown, with both patterns independently calculated to target around $54,000. The on-chain MVRV pricing band also provides support references in the same region. The tech stock sell-off combined with technical breakdowns is increasing short-term risks.
Bitcoin fell below $60,000 on Thursday—this key psychological support line was breached, with the immediate trigger being a collective decline in large tech stocks, affecting overall risk appetite and hitting the crypto market the hardest.
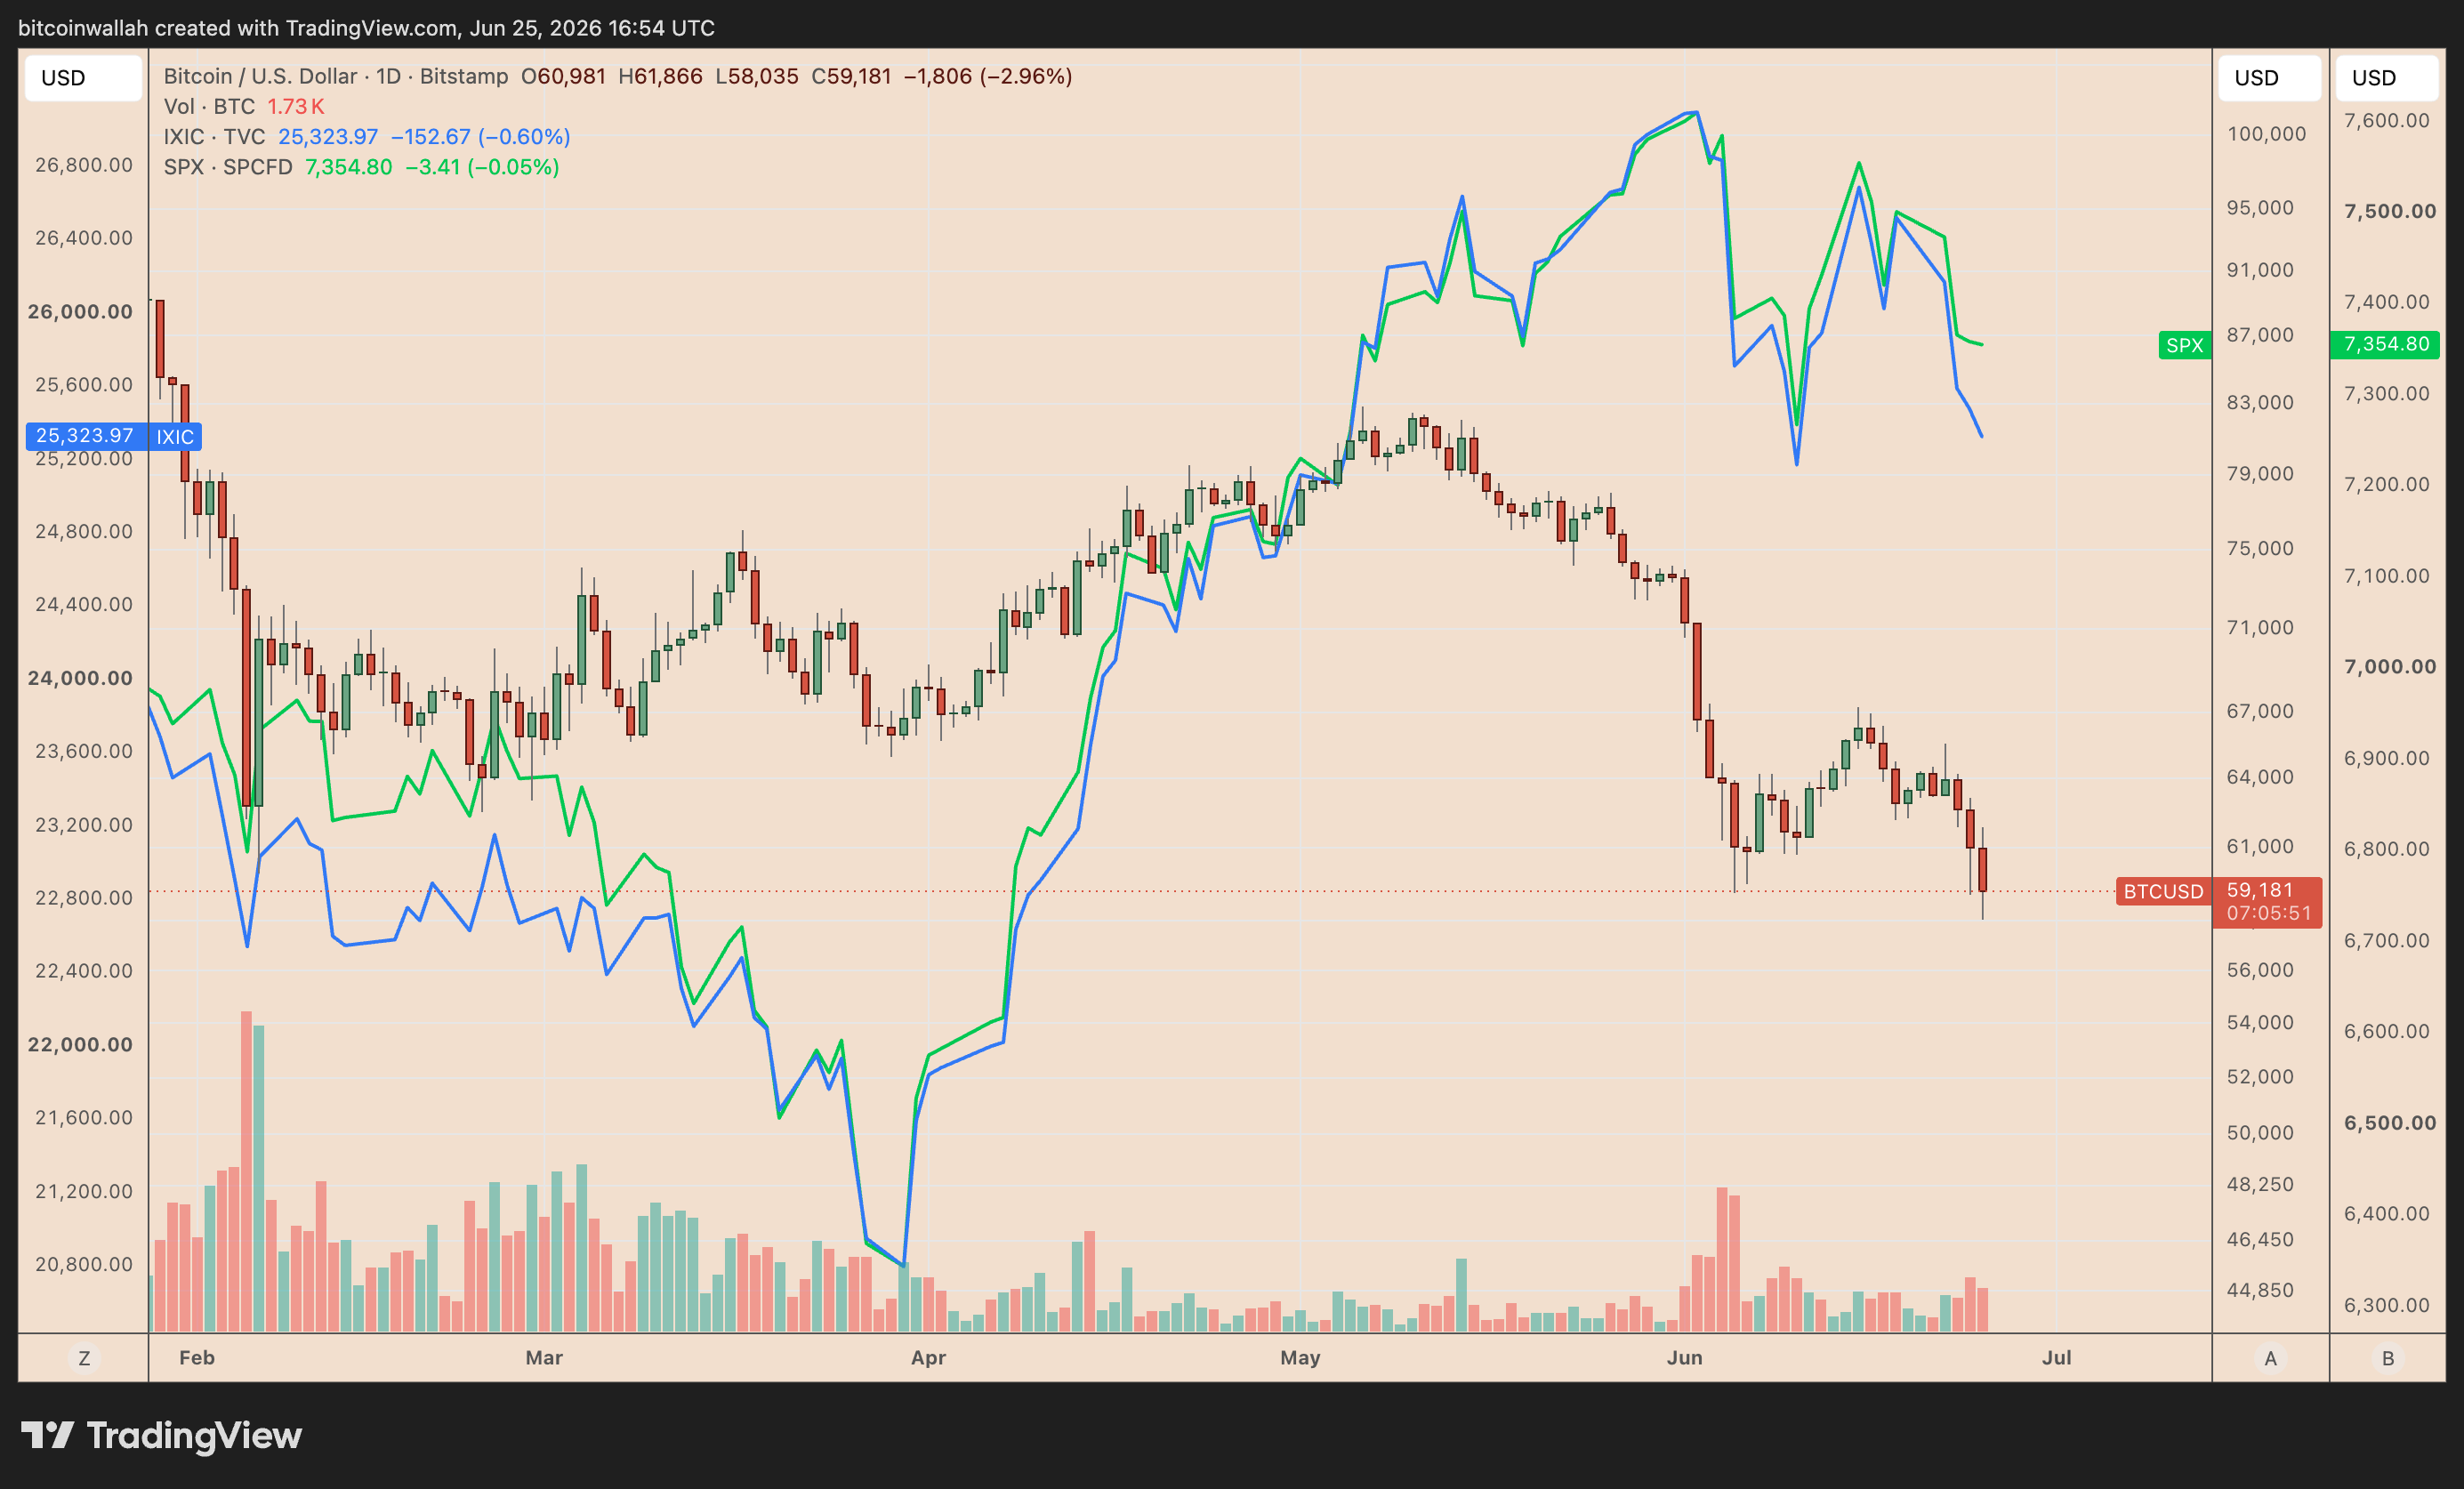
Caption: BTC/USD compared to Nasdaq and S&P 500 daily charts
Source: TradingView
This drop triggered a classic bearish reversal structure, potentially pushing BTC prices below $54,000 in the coming days.
Key Points:
- Bitcoin broke below $60,000, completely reversing June's gains, with multiple bearish structures activating simultaneously.
- The calculated targets for both the arc top and daily bearish flag are below $54,000.
Arc Top Breakdown Opens More Downside Potential
BTC/USD fell by a maximum of 4.8% on Thursday, with intraday lows around $58,000, nullifying the entire gain of June. This pullback also finalized the arc top structure on the 4-hour chart.
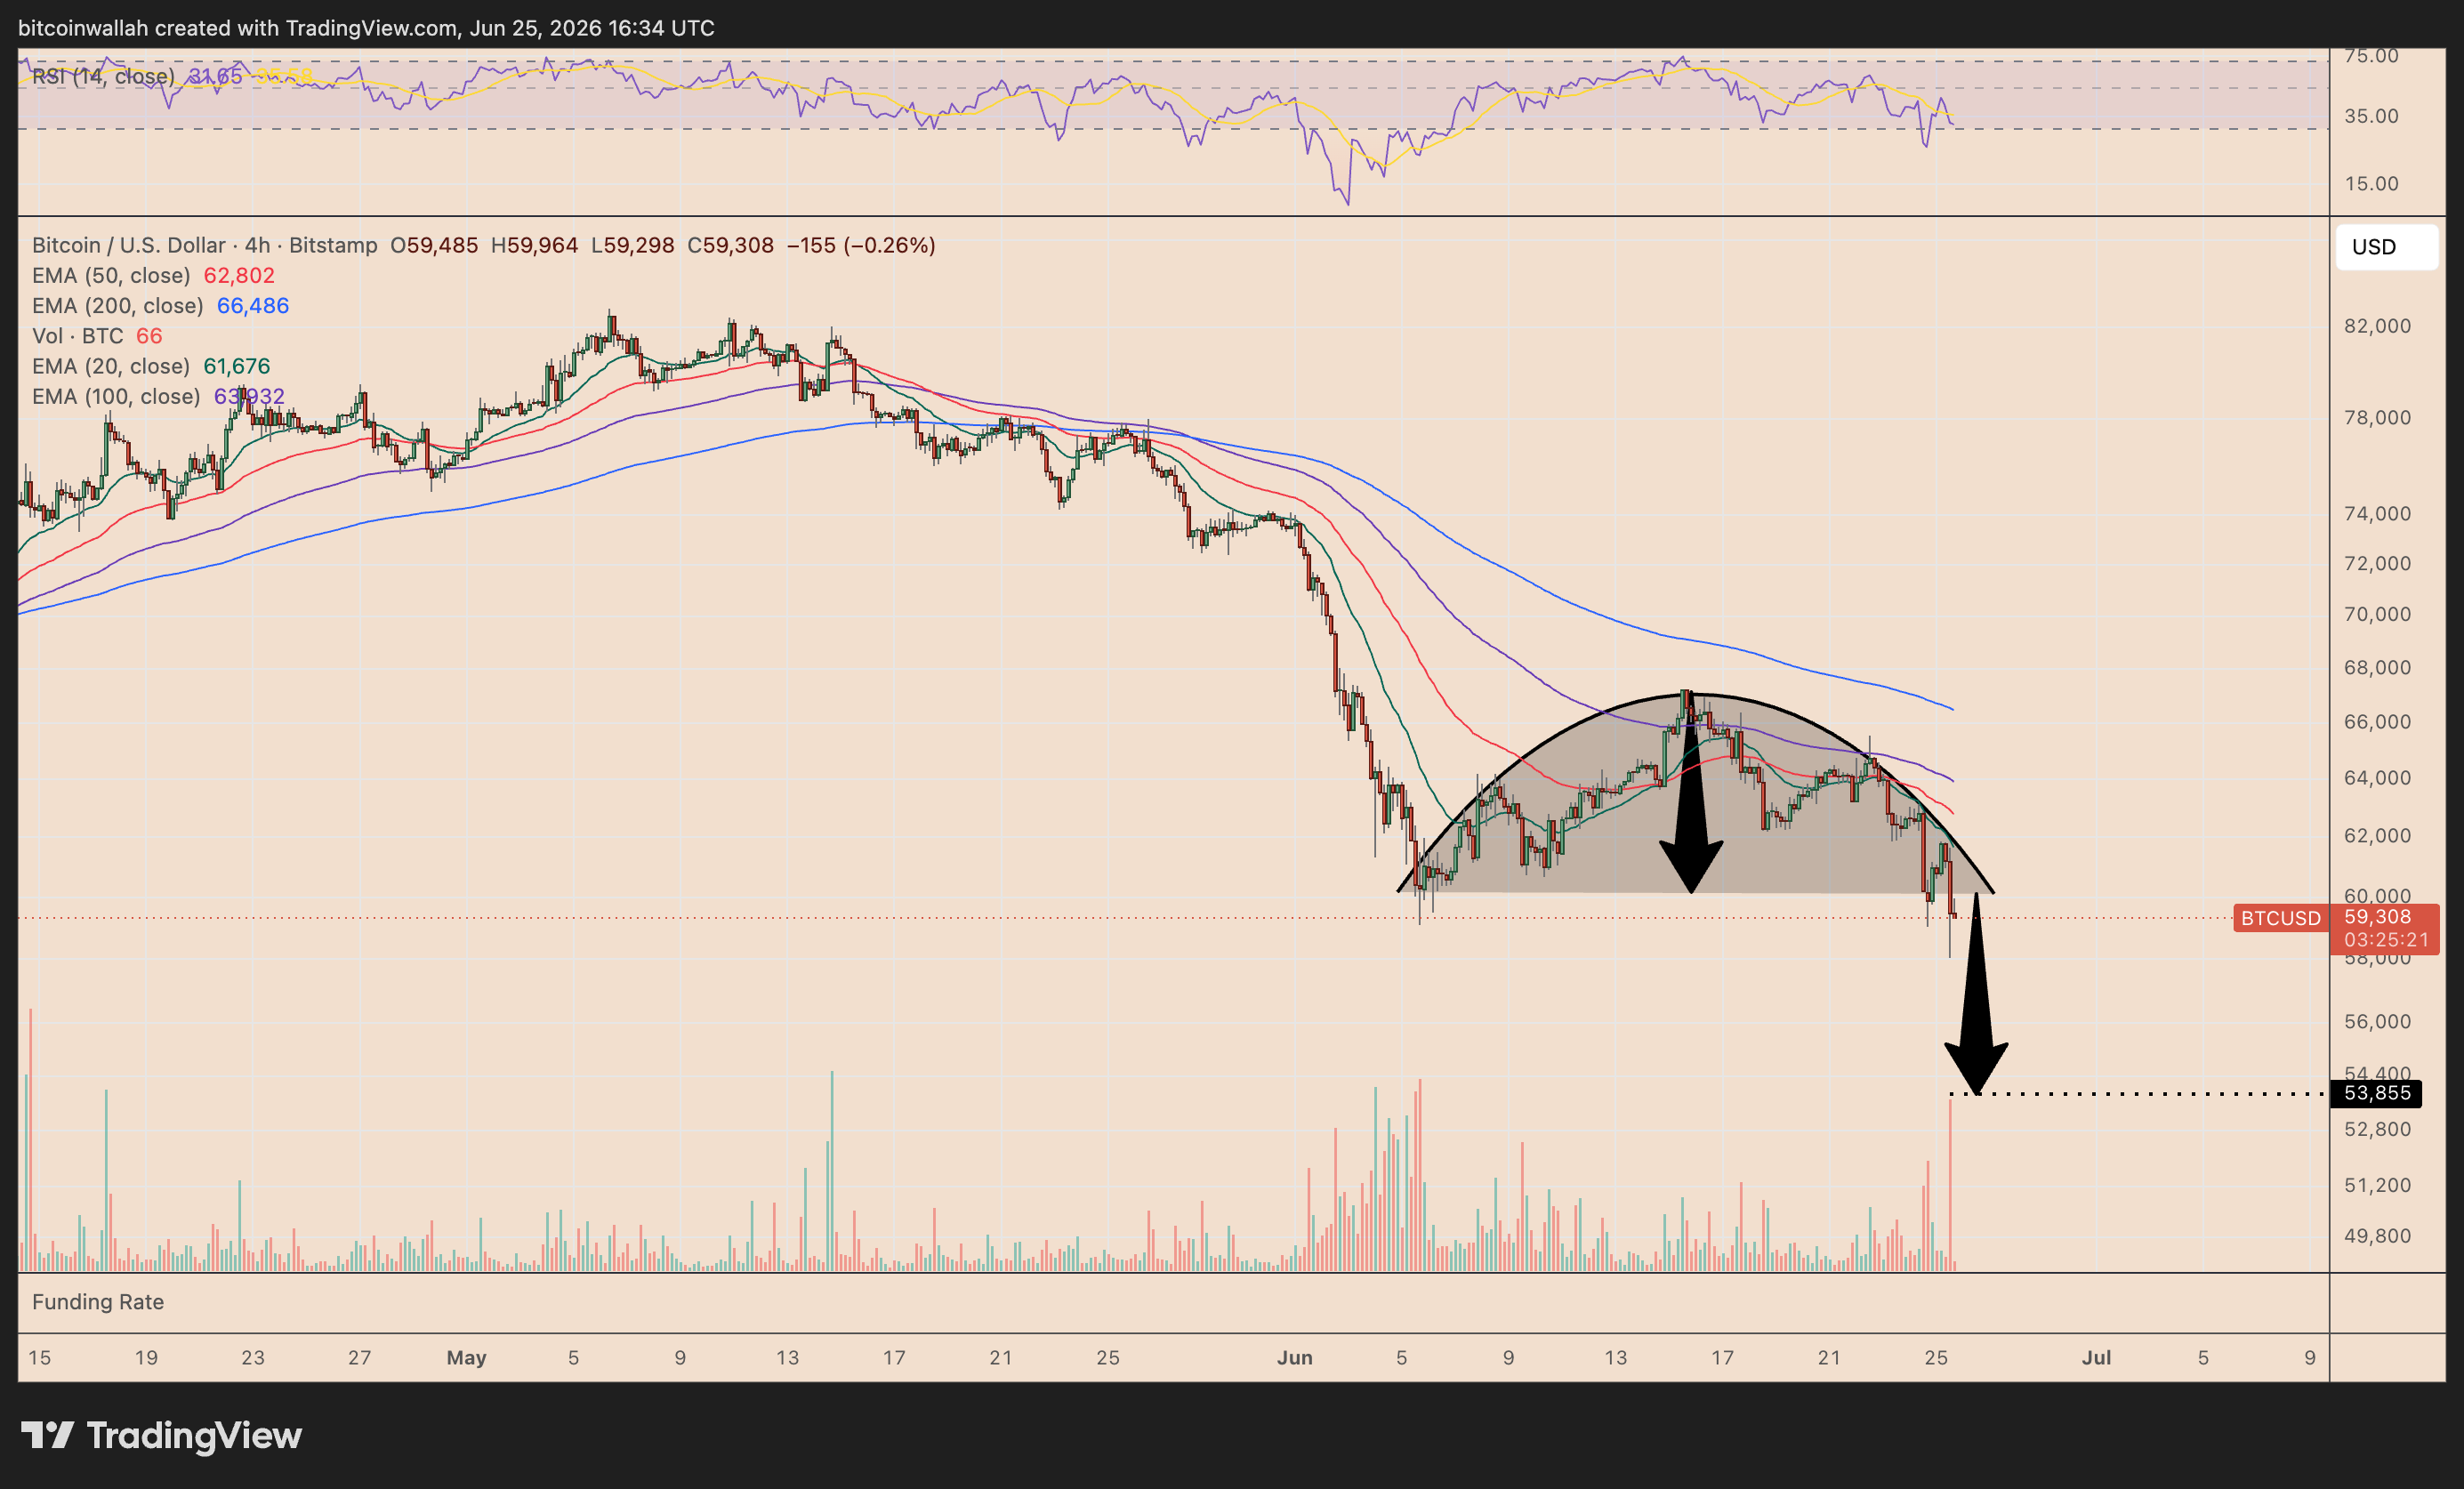
Caption: BTC/USD 4-hour chart arc top structure
Source: TradingView
The formation process of the arc top involves buying momentum gradually exhausting, with prices transitioning from an upward trend to a downward trend, creating an inverted U-shaped structure. When the price falls below the "neckline" (the bottom support of this structure), the pattern is officially confirmed.
The calculation method projects the vertical distance from the arc top to the neckline downward — for Bitcoin, this target lands just below $54,000, equating to about an additional 8.9% drop from the current price.
On the daily chart, Bitcoin simultaneously triggered a bearish flag breakdown.
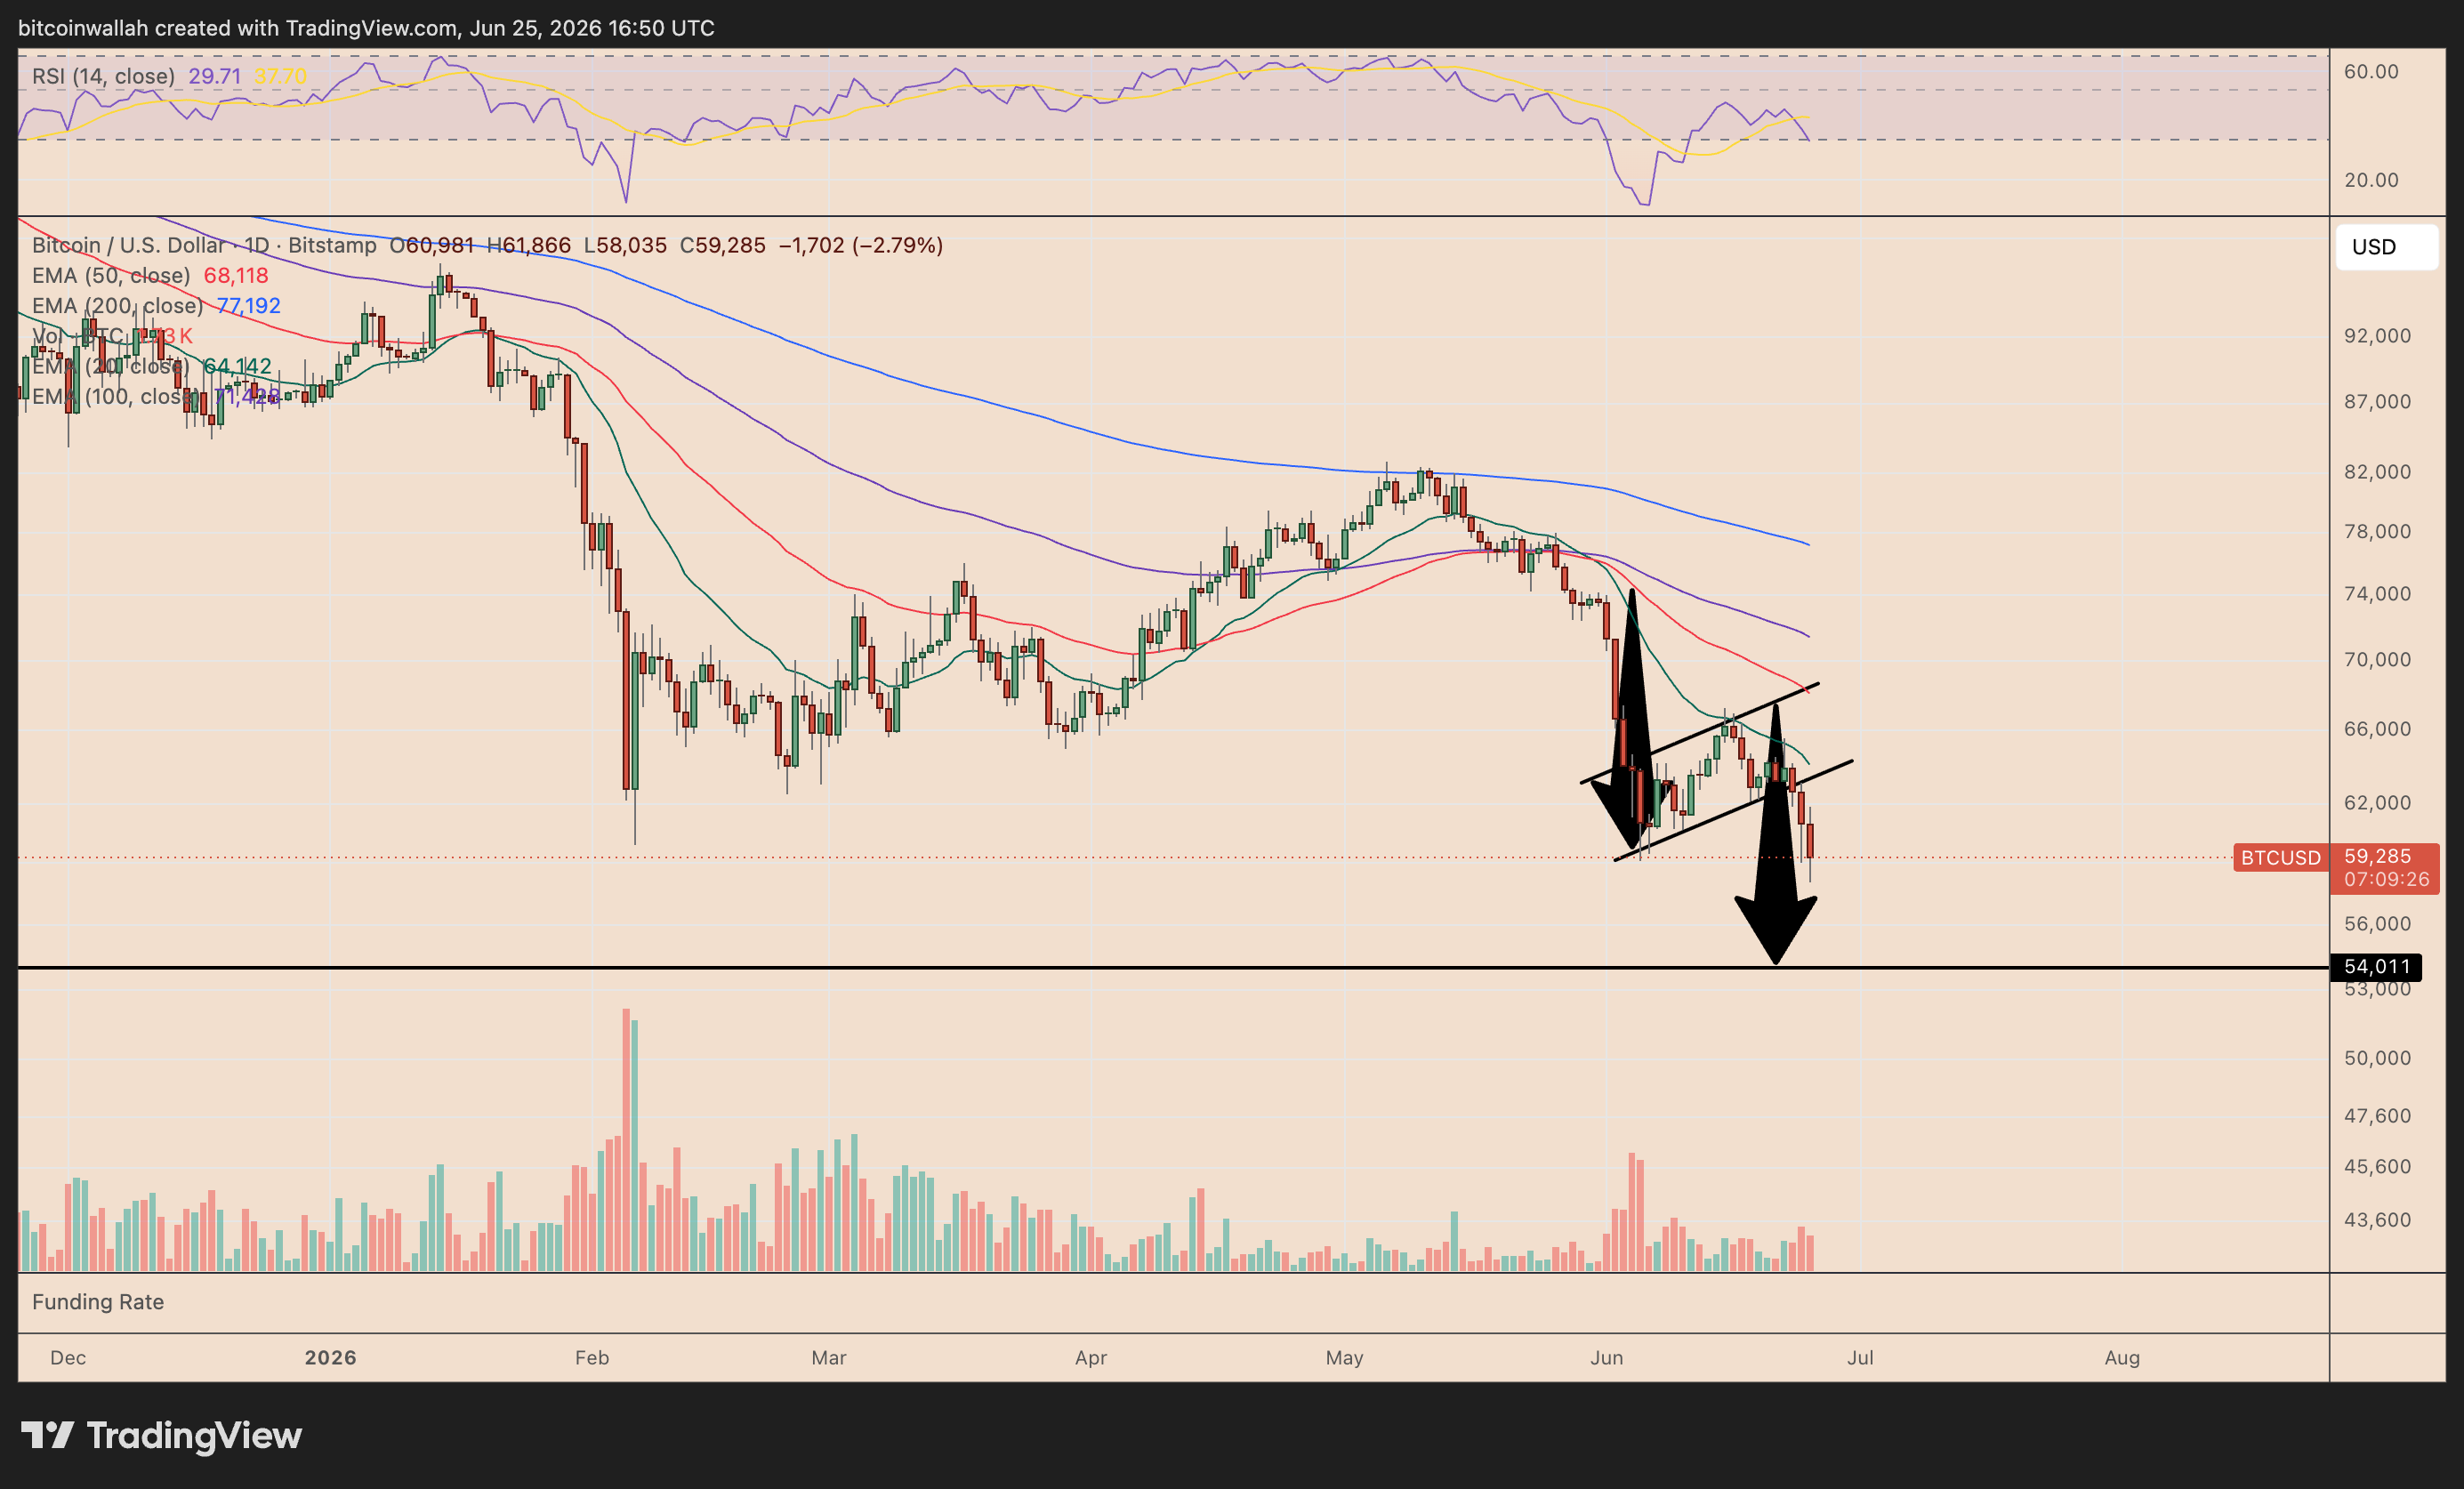
Caption: BTC/USD daily bearish flag breakdown structure
Source: TradingView
This second structure's independently calculated downside target also points to the $54,000 region — the consistent signal from two different time frames indicates strengthening bearish momentum.
MVRV Pricing Band Reinforces $54,000 Support Logic
On-chain data is also pointing to the same region.
Glassnode's MVRV pricing band compares Bitcoin's market price to its realized price (the average cost of all coins last moved on-chain). Simply put, it measures whether the market is in a profit or loss state overall, and the degree of deviation.
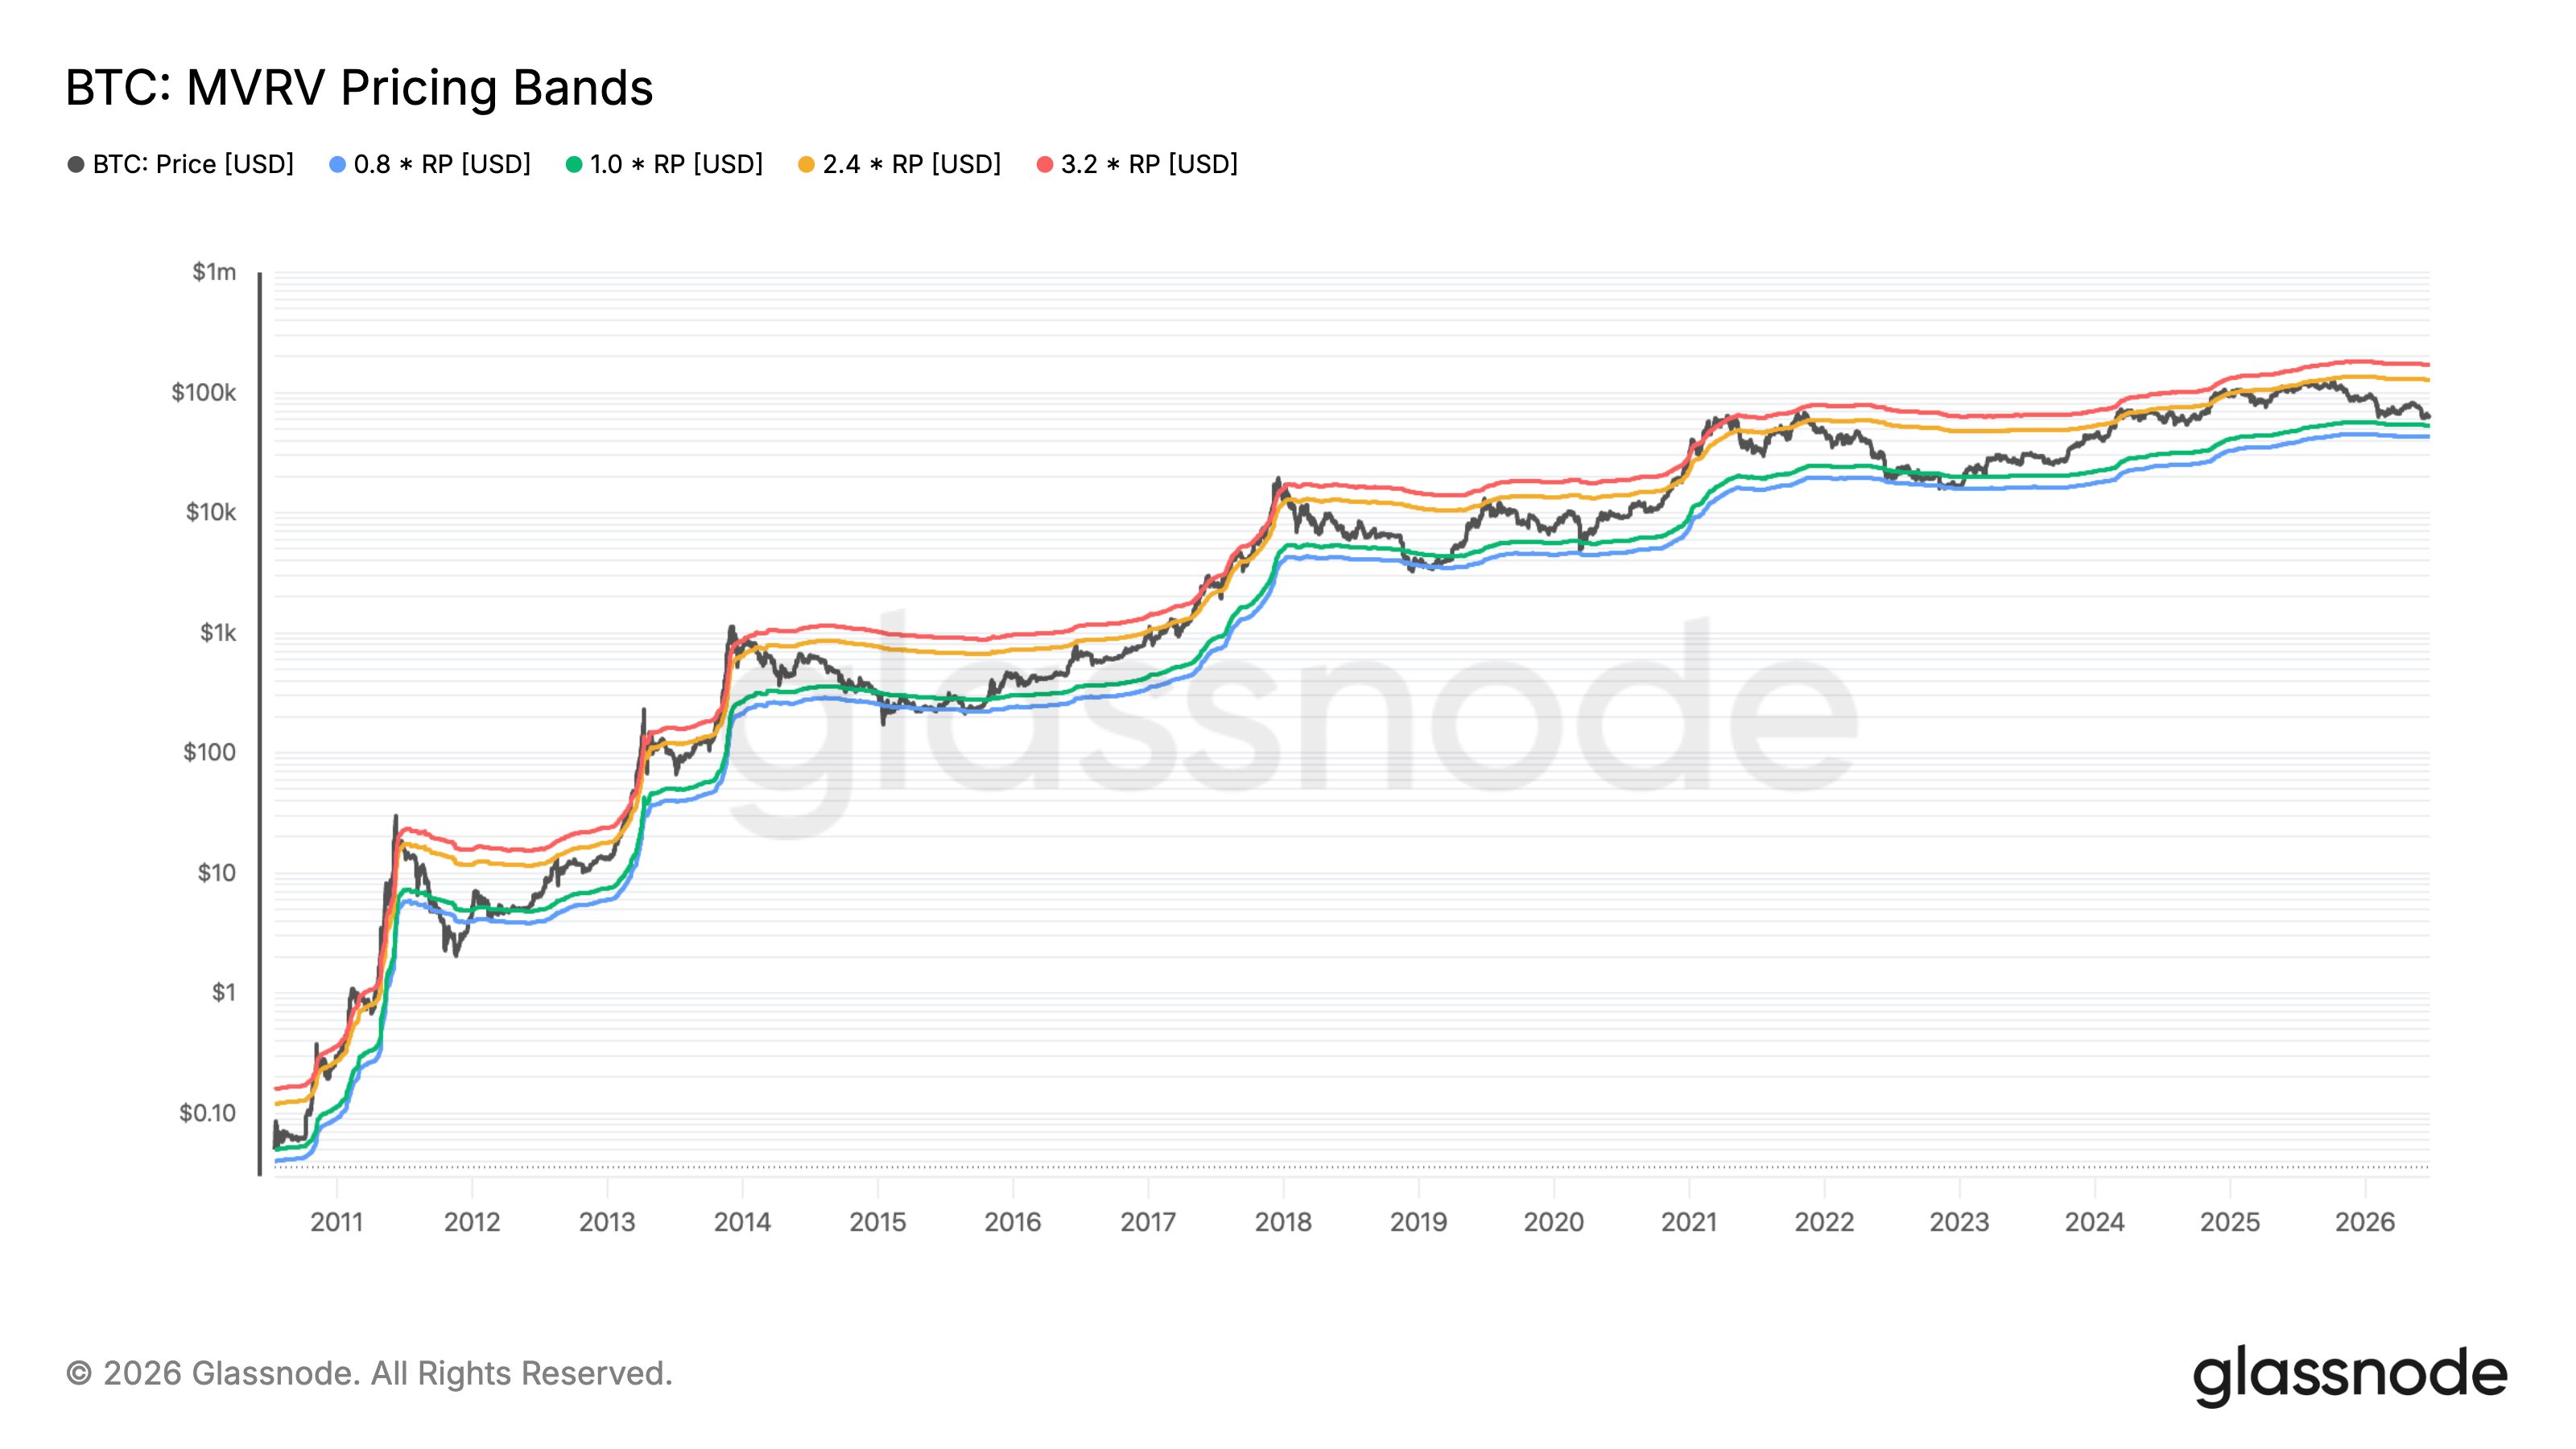
Caption: BTC MVRV pricing band compared to price
Source: Glassnode
As of Wednesday, Bitcoin's trading price was around $60,997, while the 1.0 MVRV band (green line in the chart) was near $53,390. This level is highly consistent with the technical $54,000 target, and if BTC continues to fall, this will be a key support area.
A deeper sell-off could push Bitcoin toward the 0.8 MVRV band (blue line in the chart), around $42,700. Historically, major bear market bottoms for Bitcoin have occurred near this blue line — at that time, unrealized losses on-chain reached extreme levels, and the risk of capitulation selling was also highest.
免责声明:本文章仅代表作者个人观点,不代表本平台的立场和观点。本文章仅供信息分享,不构成对任何人的任何投资建议。用户与作者之间的任何争议,与本平台无关。如网页中刊载的文章或图片涉及侵权,请提供相关的权利证明和身份证明发送邮件到support@aicoin.com,本平台相关工作人员将会进行核查。


