History shows that only through institutional restructuring can the technological dividend genuinely become inclusive.
Written by: Long Yue
Source: Wall Street Journal
The debate on whether the current AI market is a "long-term dividend" or a "speculative bubble" is intensifying. On June 25, the macro chief analyst team led by Li Chao at Zhejiang Merchants Securities released an in-depth report, attempting to answer a fundamental question by reviewing the five complete waves of technological upheaval over the past two centuries: Is K-shaped differentiation the "destiny" of technological revolutions?
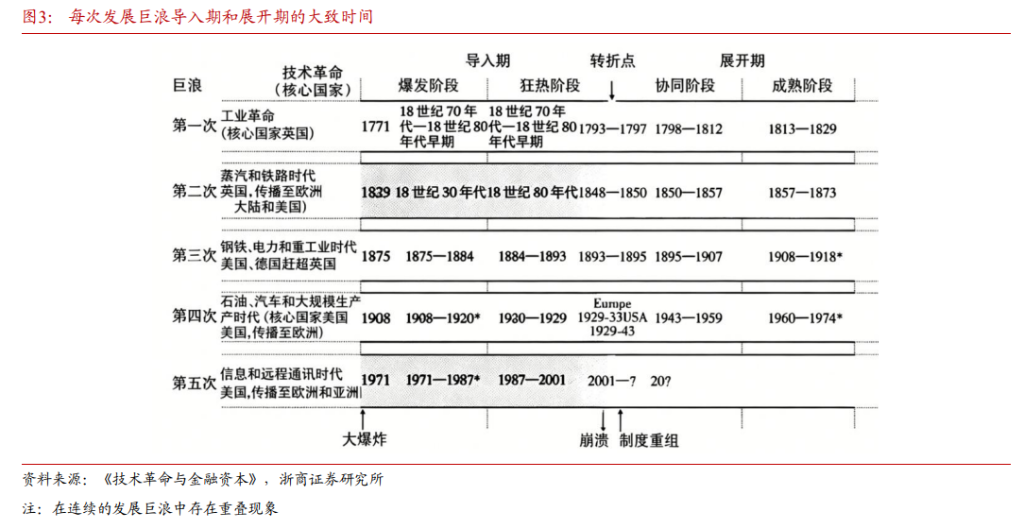
Zhejiang Merchants Securities references the theoretical framework of Carlota Perez's "Technological Revolutions and Financial Capital," dividing the industrial revolution since 1771 into five technological cycles—textile machines (1771), steam and railroads (1829), steel and electricity (1875), oil and automobiles (1908), and information and the internet (1971). Each cycle lasts about 50 years and can be segmented into an introduction phase (eruption and frenzy), a turning point (bubble burst), and an expansion phase (synchronized golden era).
Research finds that every technological revolution's "introduction phase" is inevitably accompanied by K-shaped differentiation—industry, capital markets, and household income diverge simultaneously, and will not converge before the bubble is cleared.
The technological dividend is always intercepted by capital first
The first wave of the textile machine revolution (starting in 1771) provides the most straightforward example.
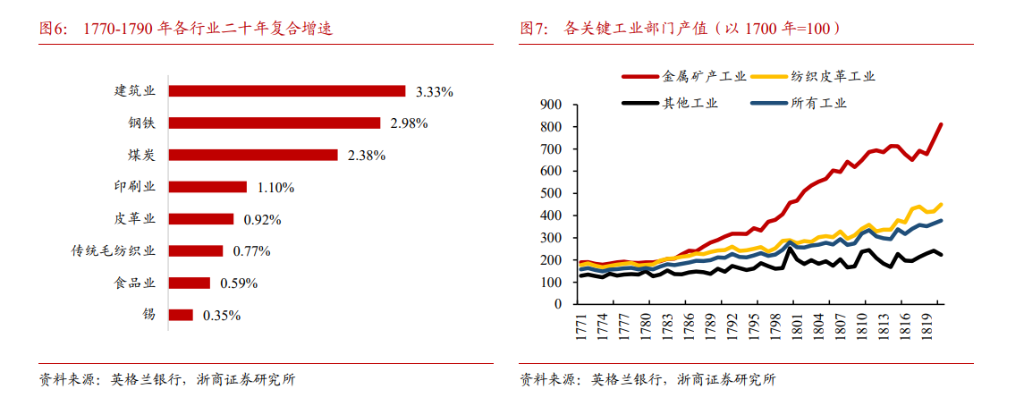
During the revolutionary eruption phase (1770-1790), the construction, pig iron, and coal industries had compound growth rates of 3.33%, 2.98%, and 2.38%, respectively, while traditional food production only grew by 0.59% and traditional wool textile by just 0.77%. By 1821, the output value of the metal mining industry had soared to over eight times that of 1771, while "other industries" (traditional handicrafts) virtually stagnated.
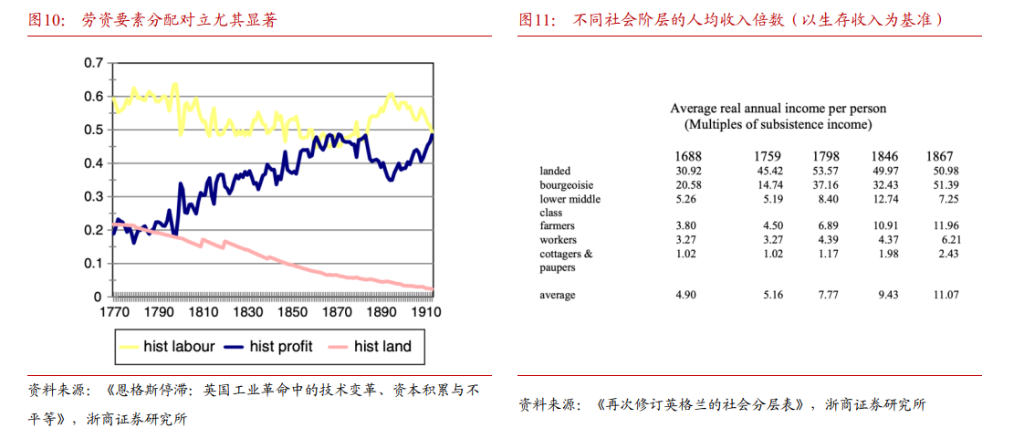
The differentiation at the distribution end is even more startling. Data from "Revising England's Social Stratification Table" shows that between 1759 and 1846, the new bourgeois class's per capita income increased from 14.74 times the survival income to 32.43 times; meanwhile, the actual income of the worker group actually dropped slightly from 4.39 times in 1798 to 4.37 times in 1846.
While the average wealth of society grew, the absolute income of lower-tier workers stagnated. The wealth created by technological progress was almost unilaterally intercepted by capital.
This phenomenon is defined as "Engels' stagnation"—a typical feature of the introduction phase of a technological revolution. Data corroborates this judgment: in the ten years before the revolution erupted, worker real income purchasing power grew at an average annual rate of only 0.48%, and in the following 50 years, it remained below 1%.
The labor-capital distribution structure also simultaneously reversed. By the end of the 18th century, labor compensation accounted for about 60% of national income; by the mid-19th century, this ratio had sharply declined to nearly 50%; while the capital profit share more than doubled from around 20% to over 40%.
Every bubble has a price gap between new and old industries
The K-shaped differentiation in capital markets also replayed repeatedly across the five technological cycles, with a highly consistent pattern: stocks of emerging industries outperform greatly during the introduction phase, and differentiation narrows or even reverses after the bubble bursts.
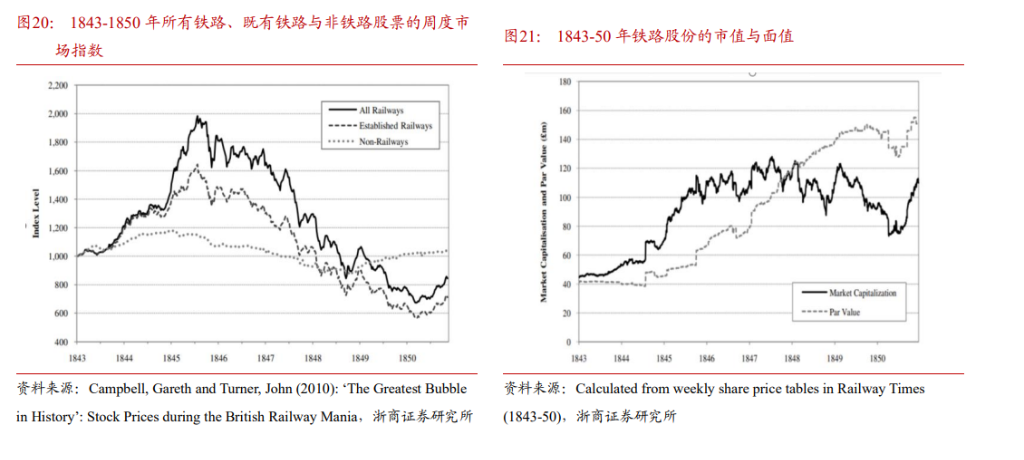
The railroad era (1829-1873): From 1843 to 1845, the indices for British railway stocks and non-railway stocks (both standardized to 1000 in 1843) rapidly diverged. In August 1845, at the peak of frenzy, the railway stock index reached 1985, while non-railway stock only stood at 1152. However, with the inflation expectations caused by the 1845 Irish potato famine, the Bank of England raised interest rates from 2.5% to 3.5%, leading to a sudden increase in financing costs, and railway stocks subsequently collapsed. By the end of 1850, railway stocks closed at 857 while non-railway stocks rose to 1042, completely reversing the K-shaped pattern.
- The steel and electricity era (1875-1918): Zhejiang Merchants Securities cites data from the Calers Economic Research Committee that shows a clear differentiation in the U.S. stock market post-1895. Mining, electricity, and utilities had significant increases, with many steel-related sectors experiencing over 100% growth during the introduction phase, far exceeding the overall market level.
- The automobile and oil era (1920s): From 1919 to 1929, the S&P Composite Index rose by approximately 217%, but the electrical equipment sector surged by as much as 540%, while the automobile and truck sector increased by 177%; in contrast, the traditional textile sector only rose by 26%, and public transportation even fell by 21%.
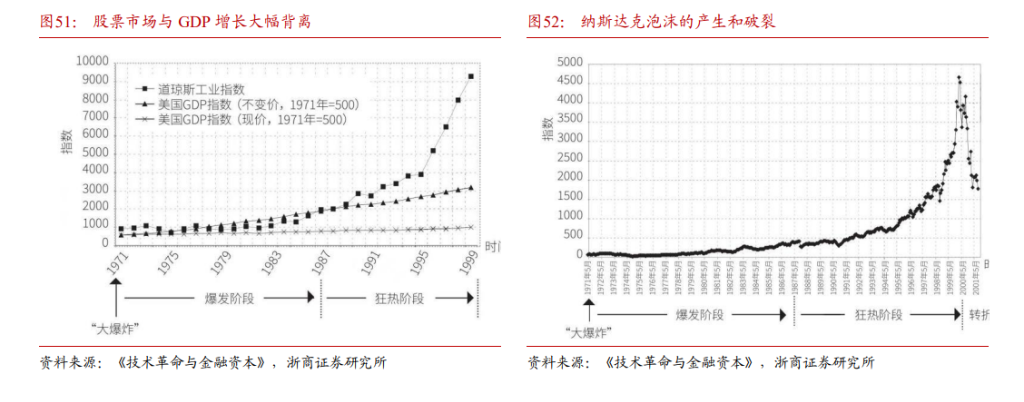
- The internet era (1995-2000): The Nasdaq soared from 744 points in early 1995 to a peak of 5049 points in March 2000, with a five-year cumulative increase of 629%; during the same period, the Dow Jones Industrial Average only increased by 285%. Zhejiang Merchants Securities points out that the Nasdaq represents new paradigm technology carriers, while the Dow represents traditional blue-chip economies, whereby "capital is continuously being drained by the internet sector, with subdued investment willingness," forming a typical "one rise, one stagnation" K-shaped gap.
Extreme wealth disparity will inevitably lead to social conflicts
K-shaped differentiation does not merely linger at the numerical level; it has repeatedly exacerbated social conflicts throughout history.
During the textile machine era, lower-tier workers initially sought to protect their rights through legal means: in 1778, they submitted a petition to Parliament demanding a minimum wage; by 1807, an organization managed to get 130,000 signatures, demanding restrictions on machine usage. After this bill was rejected by Parliament in 1808, the legal channels for protecting rights were closed. This, compounded by the Napoleonic wars causing disruption to textile exports, massive layoffs by factory owners, and food shortages in the winter of 1810-1811 leading to famine, resulted in an organized large-scale Luddite movement by lower-tier workers under the quadruple pressure of unemployment, inflation, and technological displacement in 1811.
In the steam and railroad era, Oxford University’s economic history research (Allen 2005) recorded: "From 1800 to 1840, GDP growth in Britain was 37%, but real wages stagnated, while profit margins doubled, and the share of profits in national income expanded, with labor and land returns declining." This period became known as the "Hungry Forties." In 1844, Marx began writing "Capital," systematically critiquing the relative impoverishment of the working class during capital accumulation—Zhejiang Merchants Securities defines this as "the earliest theoretical response to K-shaped differentiation."
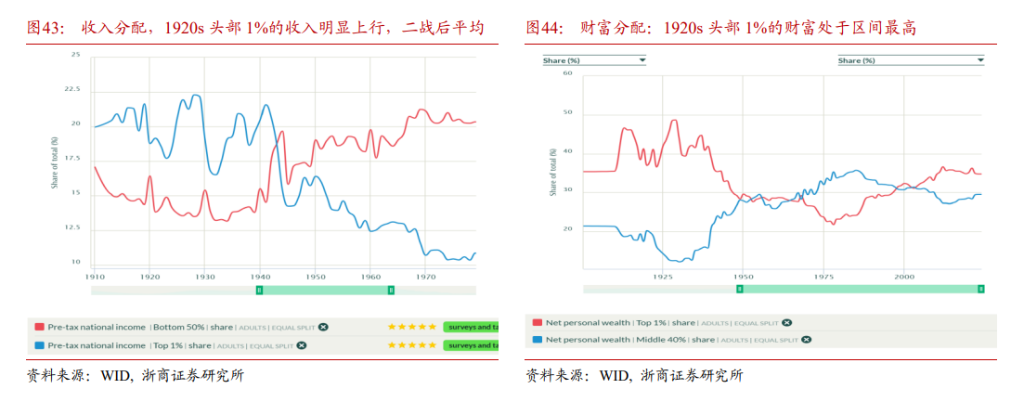
In the automobile and oil era, wealth disparity reached historic extremes on the eve of the 1929 Great Depression. Zhejiang Merchants Securities cites WID data: in 1920, the top 1% of the U.S. population controlled 37% of the nation's net wealth; by 1929, this proportion had risen to 48.7%—nearly half of the net wealth concentrated in the richest 1%. During the same period, the middle 40%'s share of wealth fell from 20.3% to 12.6%, while union membership rates dropped from 17.5% to 10.1%, severely undermining the bargaining power of lower-tier workers. This structural imbalance wasn't resolved until after World War II in 1949.
The same is true in the internet era. Zhejiang Merchants Securities references Federal Reserve data: from 1990 to 2000, the wealth share of the richest 1% of households increased from 22.8% to 26.8%; while the wealth share of the bottom 50% decreased from 3.6% to 3.2%, reflecting a decline in net wealth. The multiple of total wealth between the top 1% and the bottom 50% expanded from 6.5 times to 8.4 times.
When will the differentiation narrow? Wait for the bubble to burst, wait for institutional reconstruction
Reviewing the five historical cycles shows that the convergence of K-shaped differentiation has a common prerequisite: the arrival of a "turning point" after the bubble is cleared, where institutions complete restructuring, and productive capital replaces financial capital as the dominant force, allowing technology to truly enter the "expansion phase" of inclusivity.
Taking the internet as an example, after the Nasdaq crash in 2000, the "turning point" arrived, with a multitude of unprofitable ".com" companies going bankrupt, WorldCom undergoing bankruptcy restructuring, and Cisco's stock price dropping by 80%. However, this was precisely the necessary path for the technological paradigm to switch from a frenzy driven by financial capital to one dominated by productive capital focused on sustainable growth.
The logical chain from Zhejiang Merchants Securities is clear: during the introduction phase of the technological revolution, financial capital dominates, leading to widening disparities between new and old industries, concentrating wealth at the capital end, while lower-tier incomes stagnate or even decline, accumulating social conflicts; only when the bubble bursts and institutions are restructured does differentiation gradually narrow, and the technological dividend begin to spread to a broader group.
This pattern has repeated five times over the past two hundred years, without exception.
免责声明:本文章仅代表作者个人观点,不代表本平台的立场和观点。本文章仅供信息分享,不构成对任何人的任何投资建议。用户与作者之间的任何争议,与本平台无关。如网页中刊载的文章或图片涉及侵权,请提供相关的权利证明和身份证明发送邮件到support@aicoin.com,本平台相关工作人员将会进行核查。


