Author: Connor King
Translation: Deep Tide TechFlow
Deep Tide Introduction: This article tests the value accumulation mechanisms of 6 tokens across 159 protocols and finds that revenue scale is more important than mechanism design—protocols with daily revenues exceeding 500,000 USD have an average return of +8%, while the lowest category sees -81%. More critically, many mechanisms that seem "winning" instantly reverse when one or two top projects are removed, providing direct reference value for investors choosing tokens.
We mapped out the 6 types of value accumulation mechanisms for 159 tokens and tested which mechanisms truly translated into returns for token holders.
The cryptocurrency industry's narrative around token value accumulation is largely incorrect.
Research Setup
Two weeks ago, we released the report "2026 Investor Relations and Token Transparency." One finding was that 38% of crypto protocols have active value accumulation while 62% do not return any value to token holders.
This article is a supplementary analysis. We obtained a dataset of 159 protocols, categorized each token based on its accumulation mechanism, and pulled 1-year price performance from Artemis. The question is: which mechanisms truly translate into returns?
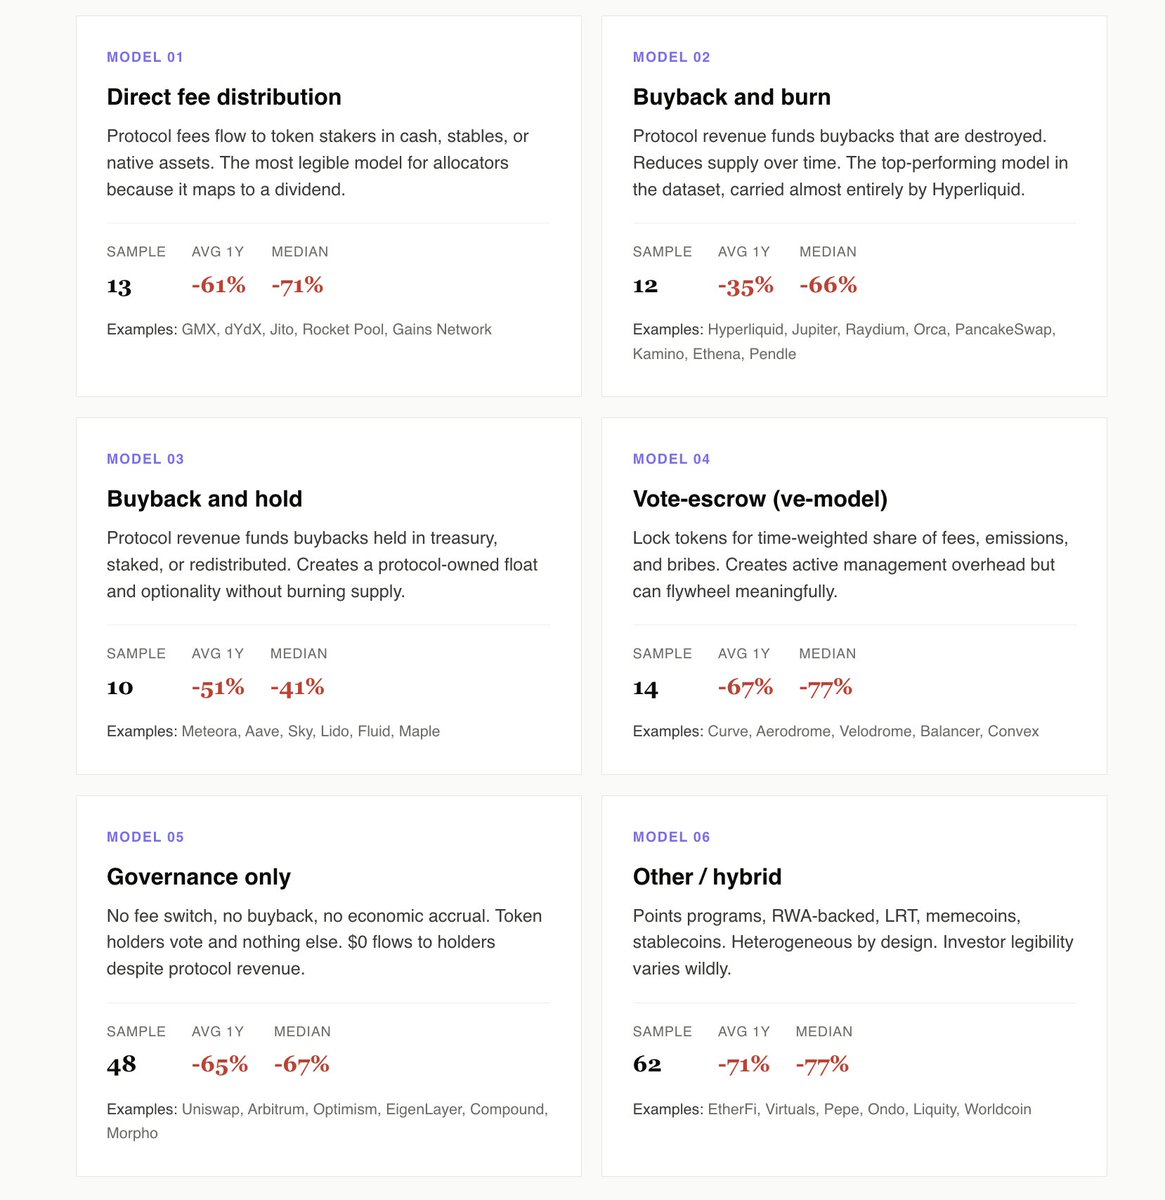
We identified 6 models: direct fee distribution, buyback and burn, buyback and hold, voting escrow (ve model), pure governance, and other/mixed models.
Here are our findings:
Active accumulation leads pure governance by 10 percentage points
Among the 49 protocols with direct fees, buyback and burn, buyback and hold, and ve models, the average return over the past year was -55%. The 48 pure governance protocols averaged -65%.
Narrowing it down to purely governance tokens that generate revenue—such as Uniswap, Arbitrum, and Morpho—the gap widens further. These protocols generate real income but share not a penny with token holders. The opportunity cost is the most conspicuous part of the dataset.
Pure governance is analogous to a public company's investor relations strategy that offers neither dividends nor stock buybacks. End investors no longer pretend this is a going concern and start pricing it as an option for management to wake up.
Hyperliquid is in the buyback and burn category
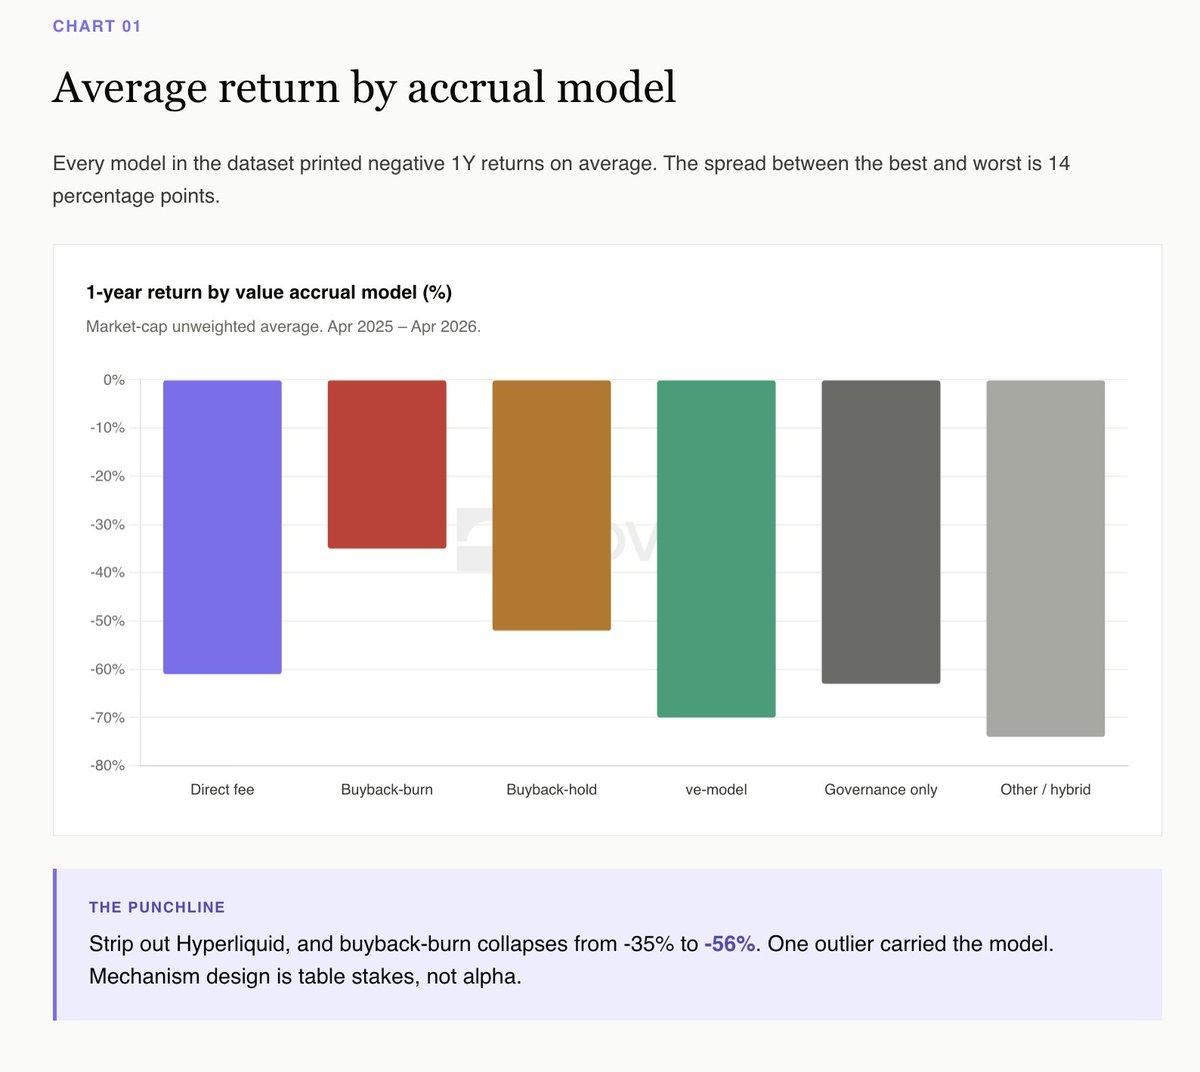
From surface data, buyback and burn won this year (average -35%), and buyback and hold came in second (-52%). It seems to be a complete victory for burn.
But remove Hyperliquid and the story reverses. Without HYPE, buyback and burn averages -56%, and buyback and hold averages -52%. One token determines the entire category.
Meteora is the cleanest buyback and hold case. A 10 million USD buyback plan, Novora's investor relations score is 95/100, with transparent treasury accumulation. It has dropped about 40% this year, below the median of its peers. Tokens held in a transparent treasury for buyback retain optionality, creating visible, audited circulation. Destruction eliminates optionality in exchange for a marketing headline.
Revenue scale is the true signal
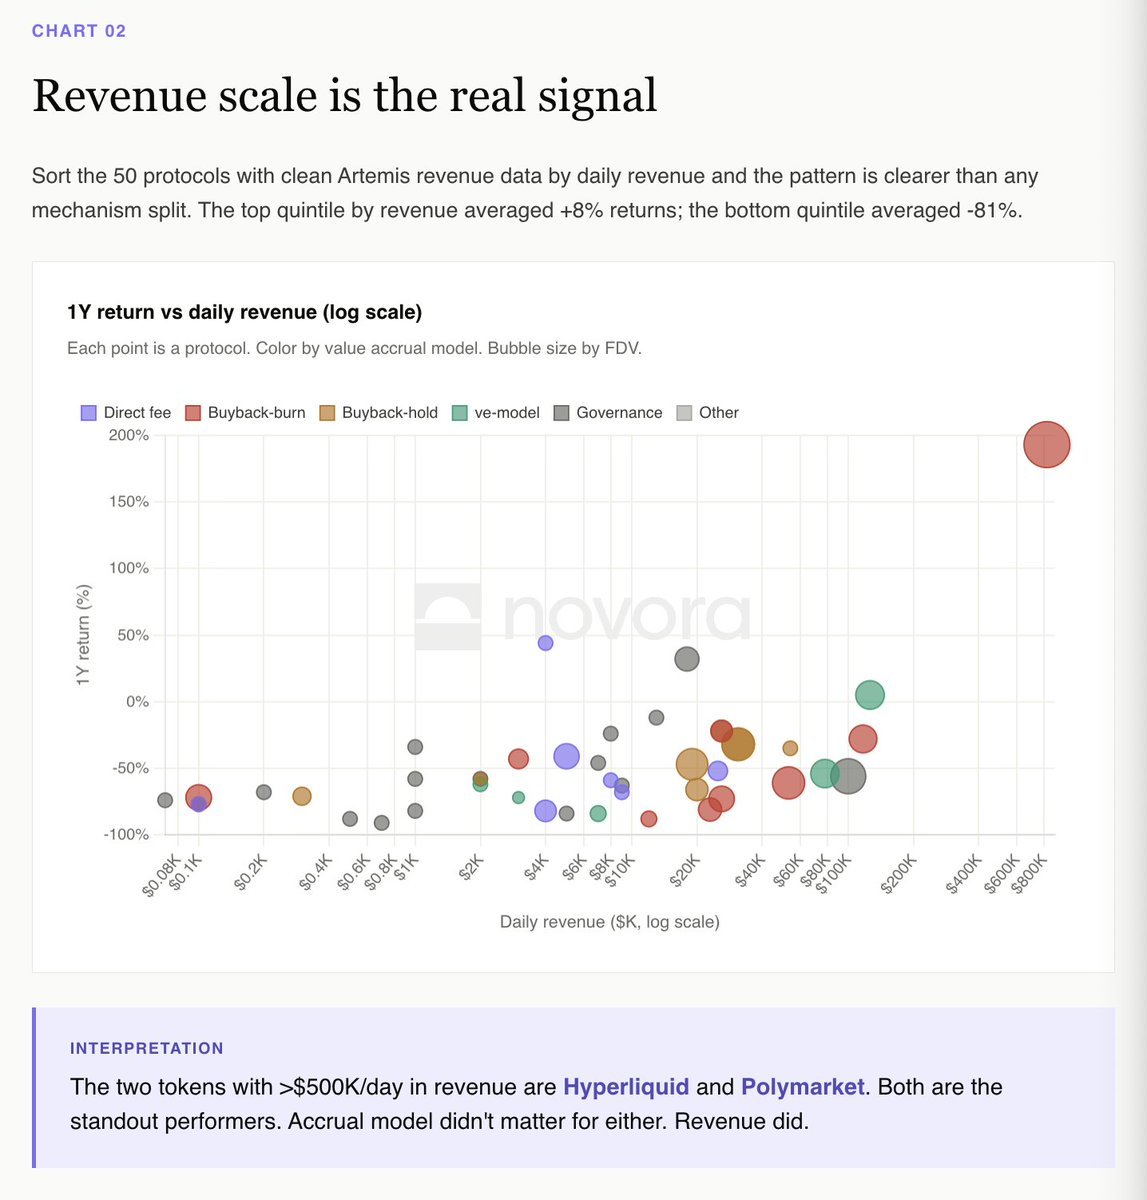
Sorting 50 protocols with clear Artemis revenue data by daily revenue reveals a pattern clearer than any mechanism classification.
The top fifth of protocols by revenue averages a +8% return. The bottom fifth averages -81%.
The two protocols with daily revenues exceeding 500,000 USD are Hyperliquid and Polymarket. Both are standout performers in the dataset. Their accumulation models differ, but revenue trajectories are the same.
dYdX Paradox vs Hyperliquid Paradox
Direct fee distribution is the most easily interpretable model for institutional allocators as it clearly maps to dividends. dYdX operates a textbook version: 100% of trading fees go to stakers, 75% of net income is used for buybacks, with the best investor relations infrastructure.
dYdX has fallen 82% over the past 12 months. The mechanism operates completely as promised, but the business does not.
Hyperliquid is the opposite. Through an aid fund buyback and burn (99% of fees), zero traditional investor relations infrastructure, annual +193%.
If you are an allocator, this is the clearest reading in the dataset: You are buying a piece of the protocol's income, and if income decreases, the token will drop too. Mechanism is a necessary requirement, but income trajectory is everything.
ve model needs permanent bribery to operate
Aerodrome is the only ve model token in the dataset with a positive 1-year return (+5%). The mechanism relies on inflow into the Base ecosystem to maintain a bribery market.
Velodrome, Curve, Balancer, and every smaller ve fork have fallen -54% to -84%. The ve flywheel is effective, but it requires a continuous influx of new capital. When capital stops flowing, the entire structure collapses.
This is not a criticism of the model. Rather, it acknowledges that ve tokens are a leveraged bet on ecosystem inflow, not necessarily a bet on the pure protocol fundamentals.
Mixed category averages -71%
Loyalty programs, RWA, LRT, memecoin, stablecoins. 62 protocols. The most heterogeneous category in the dataset. Average 1-year return: -71%.
This is the fate of most projects released in 2024-2025: EtherFi, Renzo, Puffer, Usual, Virtuals, AI16Z, the entire LRT cohort, memecoin cohort. These tokens rely on narratives and TGE airdrop trading, not on cash flow mechanics. Once the airdrop unlock is complete, there is nothing to support the price.
Investor readability is the fundamental issue. Allocators cannot underwrite a token whose accumulation mechanism relies on future narratives.
Panorama
Average 1-year returns categorized by accumulation model:
Buyback and burn: -35% (driven by Hyperliquid; without HYPE it's -56%)
Buyback and hold: -52%
Direct fee distribution: -55%
Pure governance: -65%
Voting escrow (ve model): -67%
Other/mixed: -71%
Out of 135 protocols with empirical performance data, 5 have positive returns in the past year. Median return: -66%.
What does this mean
The market will not pay a premium for good mechanism design but will punish tokens with absolutely no mechanism.
The clearest empirical interpretation for 2025 is that value accumulation has not generated excess returns, but income has. The dataset of 48 pure governance protocols shows the cost of having no mechanism. When the market chooses between tokens that pay you and those that do not, it will choose the one that pays.
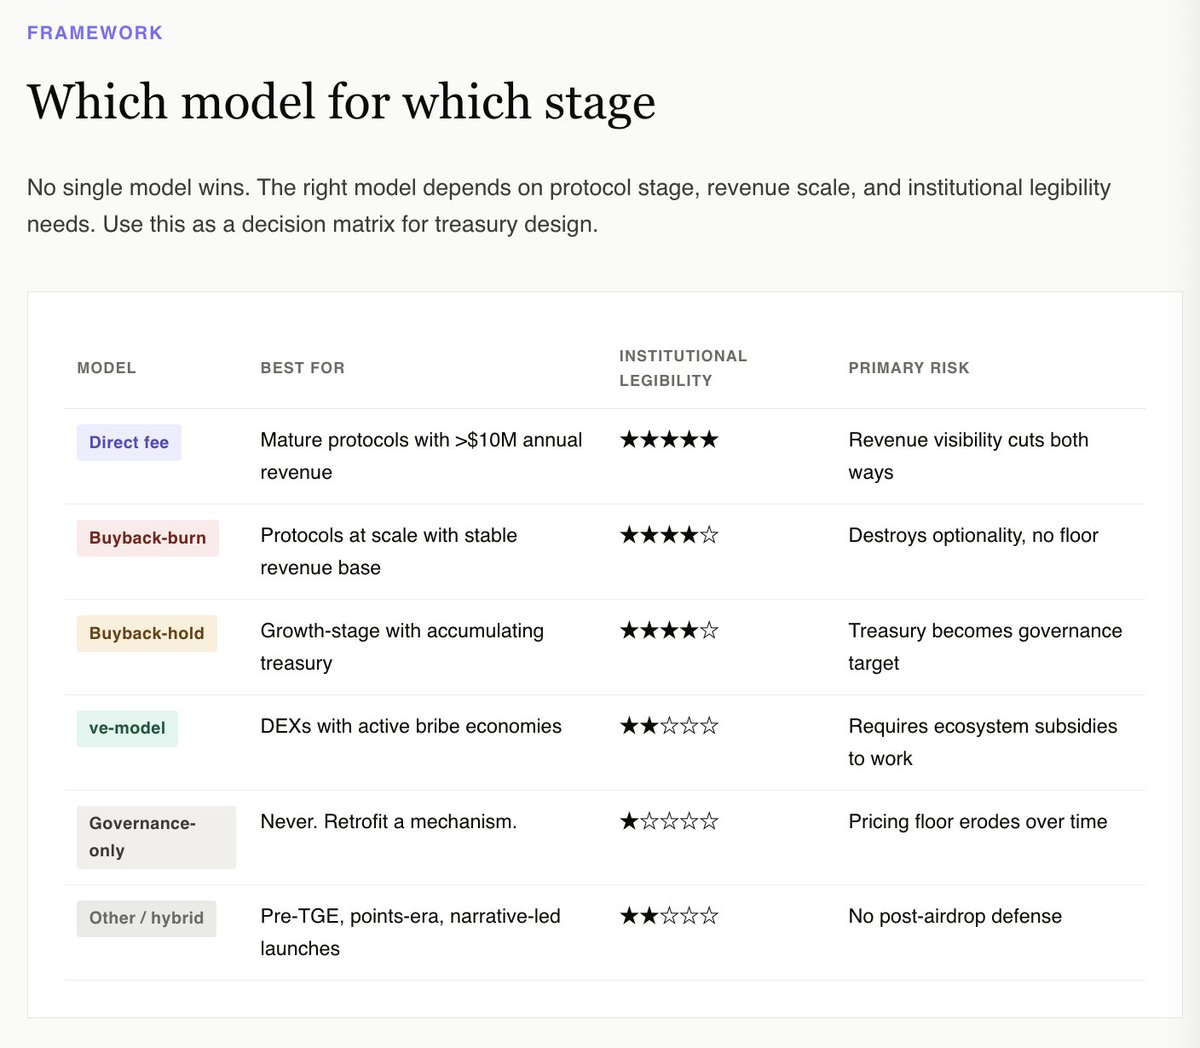
For the treasury, the right question is not which mechanism maximizes upside potential. The data suggests that none can reliably do so. The right question is which mechanism makes this token appear investable from the fundamental perspective of institutional allocators.
This perspective immediately excludes pure governance and mixed categories. It favors buyback and hold with transparent treasury disclosures, buyback and burn from scaled protocols (Hyperliquid), direct fee distributions from mature income-generating protocols, and for narrow range DEX native tokens, the ve model that binds an active bribery market.
For all other tokens, including the majority of tokens released in the past 24 months, the honest answer is: retrofit a mechanism before the next unlock. Do it while you still have optionality.
The complete interactive report containing all 159 protocols and a filterable dataset is now live:
https://www.novora.co/research/value-accrual-2026.html
This article is for informational purposes only and does not constitute financial, investment, or legal advice. All data is verified from public sources as of April 2026. Novora may have consulting relationships with the protocols mentioned in this report. Always conduct your own research and consult a qualified financial advisor before making investment decisions.
免责声明:本文章仅代表作者个人观点,不代表本平台的立场和观点。本文章仅供信息分享,不构成对任何人的任何投资建议。用户与作者之间的任何争议,与本平台无关。如网页中刊载的文章或图片涉及侵权,请提供相关的权利证明和身份证明发送邮件到support@aicoin.com,本平台相关工作人员将会进行核查。


