Coin Wave Riding: April 23 Bitcoin (BTC) Market Analysis Reference:
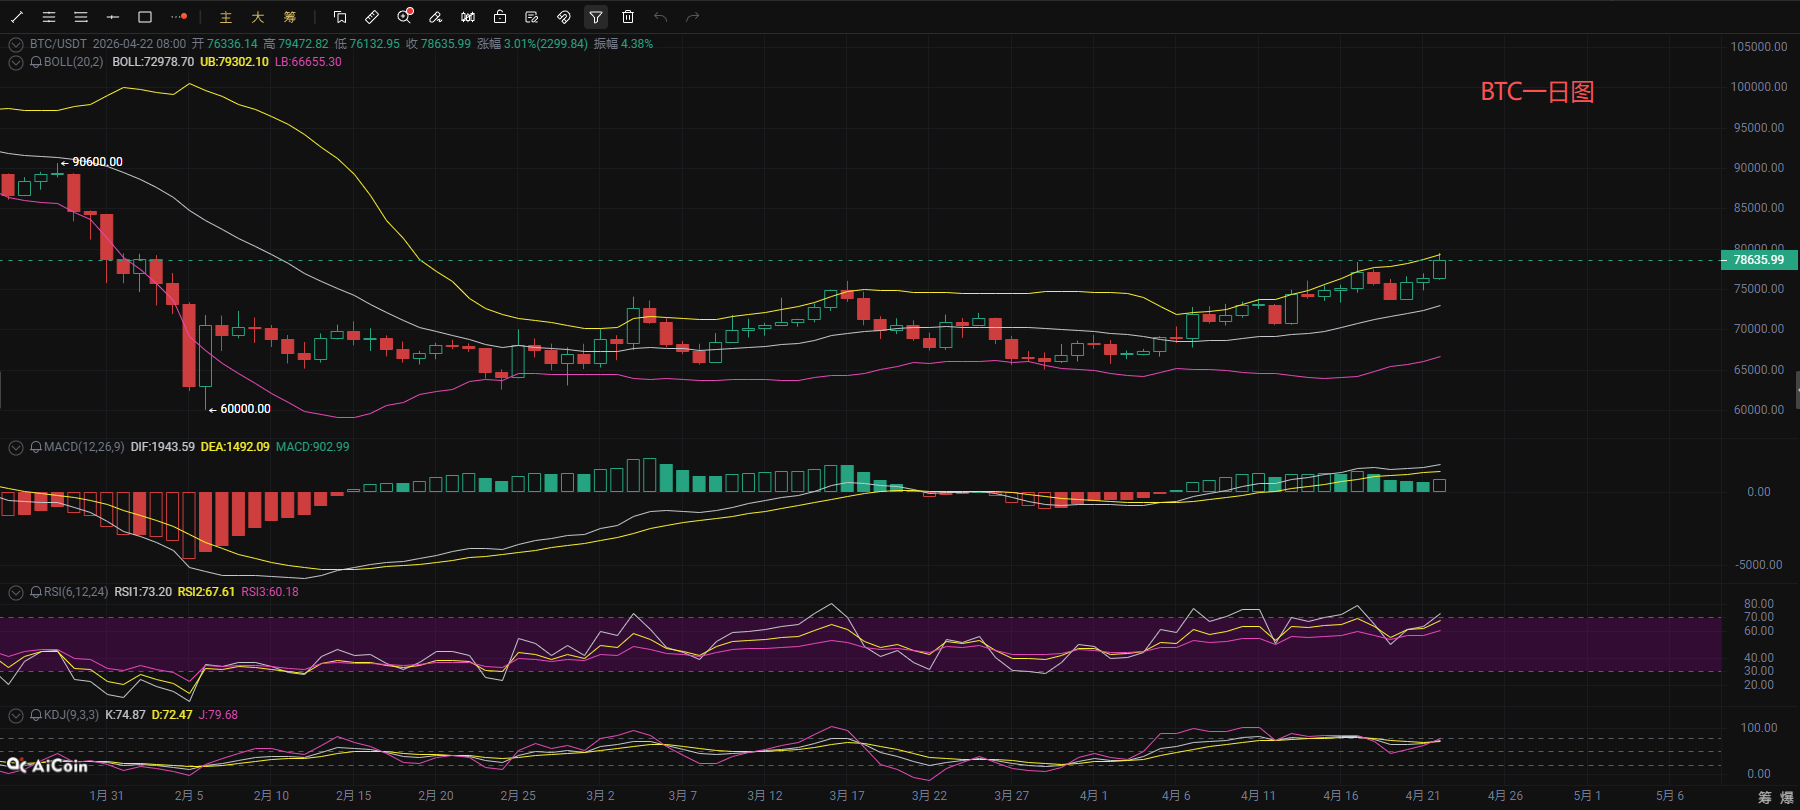
Bitcoin experienced a strong rebound yesterday, with the price continuing to rise and reaching the resistance level of 79,400 before falling back. As of publication, the price is operating around 78,600. Observing the daily chart, BTC is in a clear bullish trend, with prices steadily moving upward along the upper band of the Bollinger Bands. All cycle EMA moving averages are in a bullish arrangement, forming layered support; the MACD indicator continues to show a golden cross above the zero line, with bullish momentum not showing significant decline yet; although RSI and KDJ are in the overbought range, there are no high-level dead cross or turning signals, indicating that the current bullish force remains dominant. Overall, the daily upward structure remains intact, with a high probability of continuing a strong sideways trend at high levels in the short term. The first short-term support can be seen at EMA7, but as long as EMA15 is not effectively broken down, the upward trend will not be damaged, and there is still potential to challenge previous highs or even refresh high points.
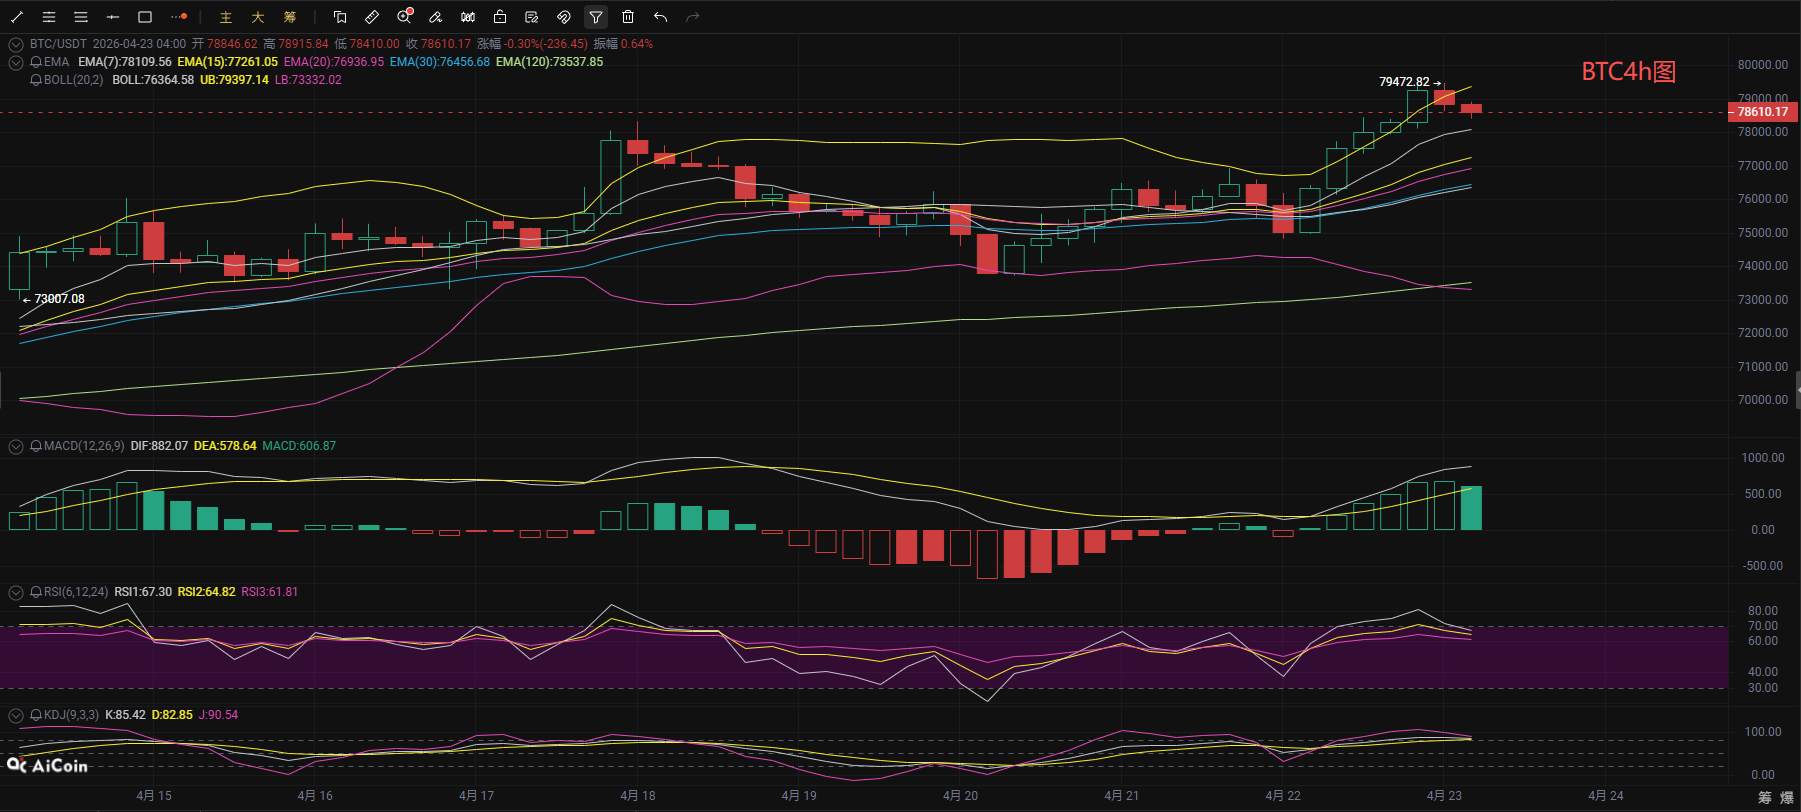
From the short cycle hourly chart, in the 4-hour level, BTC shows signs of a short-term pullback. The price has fallen back from the upper band of the Bollinger Bands. Although the openings of the Bollinger Bands still point upwards, there are signs of pressure near the upper band; the MACD is reducing, with the DIF line showing a trend of approaching the DEA line, reflecting a decrease in bullish momentum; at the same time, the RSI and KDJ indicators are turning down from high levels, indicating a strong demand for short-term pullback corrections. The key support below is located near the middle band of the Bollinger Bands and EMA20 moving average. If the price finds support in this area and re-establishes above the upper band of the Bollinger Bands, it is highly probable that it will restart the upward movement after a pullback. When operating, do not blindly chase high prices; it is more prudent to wait patiently for a signal of stabilization after a pullback before entering the market.
Coin Wave Riding: April 23 Bitcoin Short-Term Reference:
Long Position: Buy in the range of 76,500-77,500, stop loss at 500 points, target at 78,000-79,000,
Short Position: Sell in the range of 80,000-79,000, stop loss at 500 points, target at 78,500-77,500,
[The above analysis and strategies are for reference only. Please take risks at your own discretion. The publication of the article may have delays, and the strategy may not be timely. Do not operate blindly]

This article is originally shared by 【Coin Wave Riding】, representing personal views only. The article is sent with delays and is for reference only; do not operate blindly! Want to get more daily real-time signals? Then follow my official account! Here, you can learn online technical analysis and understand relevant knowledge on profits and exit strategies. I have many years of research experience in the market, focusing on the major trends in cryptocurrency. Mainly responsible for analyzing and guiding investment operations for BTC, ETH, SOL, BCH, etc. Welcome to study and research together.
免责声明:本文章仅代表作者个人观点,不代表本平台的立场和观点。本文章仅供信息分享,不构成对任何人的任何投资建议。用户与作者之间的任何争议,与本平台无关。如网页中刊载的文章或图片涉及侵权,请提供相关的权利证明和身份证明发送邮件到support@aicoin.com,本平台相关工作人员将会进行核查。