The daily chart shows Bitcoin closing with a bullish candle around 78100; current resistance is between 78500-79000. The previous level of 77000 has been broken above and has now turned into a support level; Ethereum has closed with a bullish candle near 2370, with current resistance at 2400. The previous level of 2350-2320 has been broken above and has now also turned into a support level;
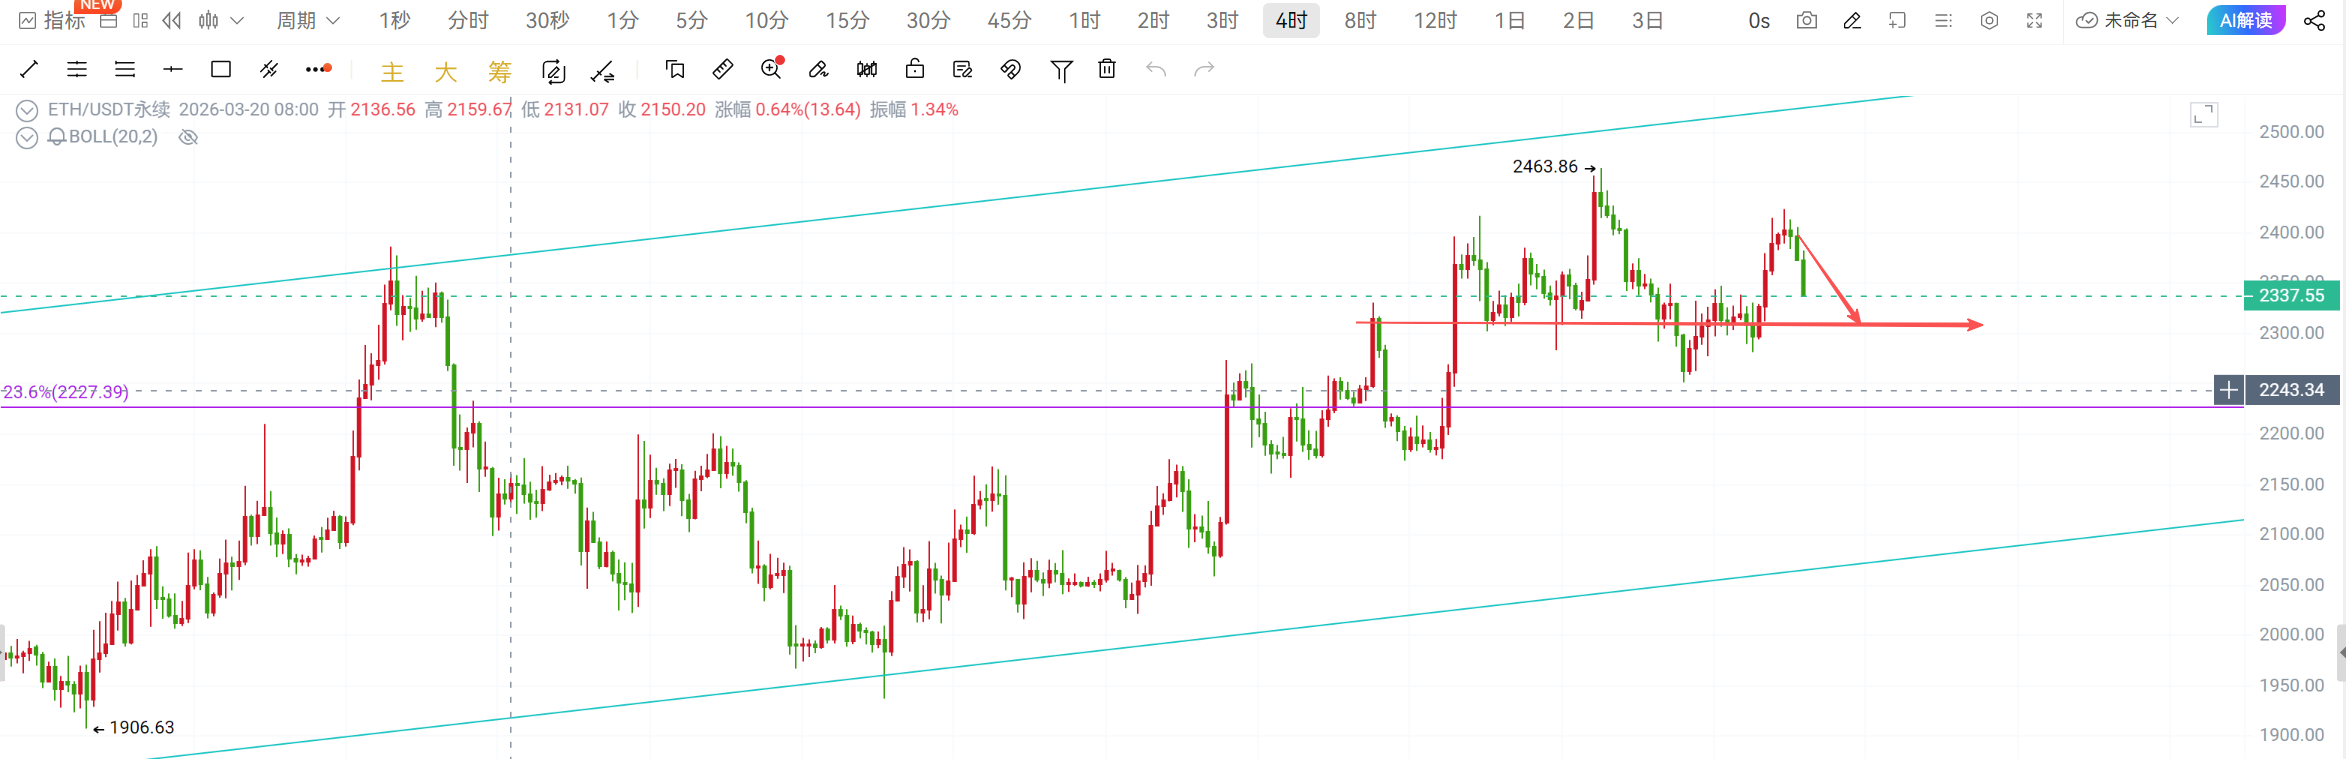
On the 4-hour chart, Bitcoin retraced to the support level of 74000 after which it gathered strength to break new highs up to 79500. It is currently under pressure again, with short-term support at 77000-76000. The extent of the pullback needs to be observed step by step, as breaking below 74000 would indicate a potential for a deeper correction; Ethereum's movement is slightly different, as it retraced to the support level of 2250. Although it gathered strength and rallied, it failed to break the previous high of 2460, reaching only up to 2420 before coming under pressure and retreating. The current short-term support is at 2330-2300, and the extent of the pullback also needs to be observed step by step. Breaking below 2250-2230 would indicate a possibility of a deeper correction;
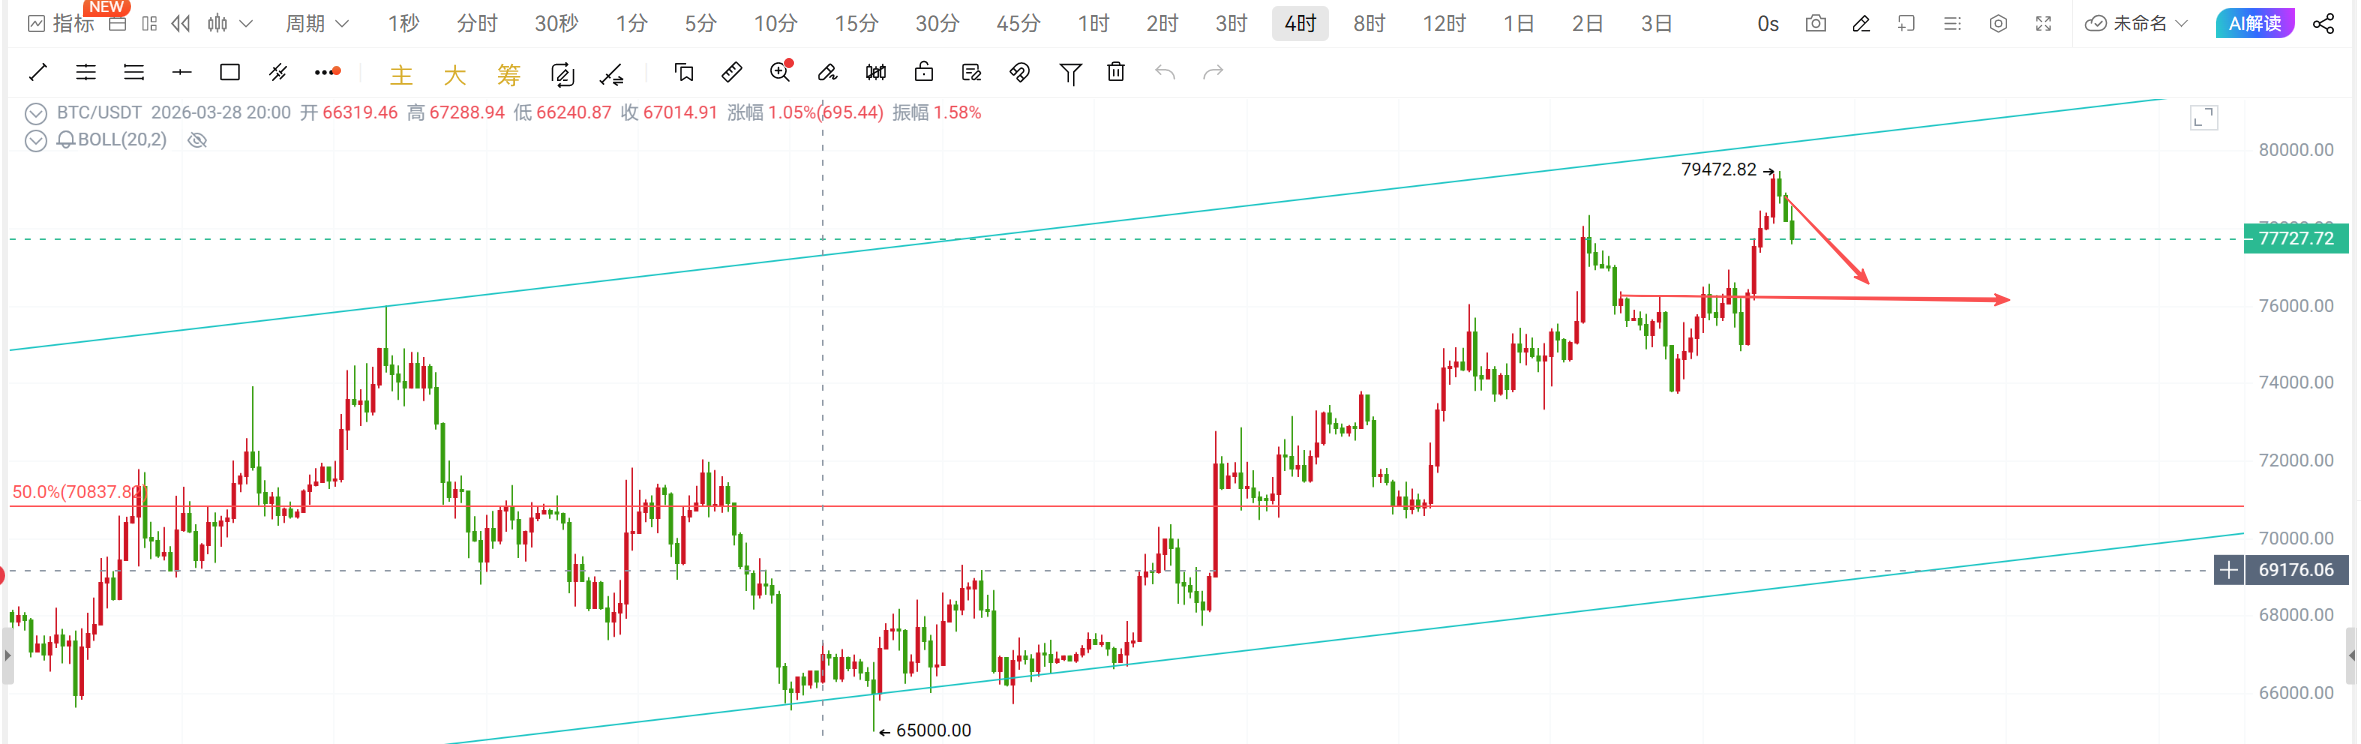
Trading strategy: The market has currently risen to near the upper bound of the trend channel. It is recommended to continue positioning for short positions, while long positions should be gradually established depending on the support situation!
Short Bitcoin at 78000-78500, target 77000-76000, stop loss above 79500; consider entering long positions at 76000-76500!
Short Ethereum at 2360-2380, target 2300-2250, stop loss above 2430; consider entering long positions at 2280-2300!
The strategy is time-sensitive, and specific instructions should be based on real-time guidance privately!

免责声明:本文章仅代表作者个人观点,不代表本平台的立场和观点。本文章仅供信息分享,不构成对任何人的任何投资建议。用户与作者之间的任何争议,与本平台无关。如网页中刊载的文章或图片涉及侵权,请提供相关的权利证明和身份证明发送邮件到support@aicoin.com,本平台相关工作人员将会进行核查。