Hello everyone, I am Sister Qinglan, welcome to the Qinglan Crypto Classroom! Today we will use my TPV three-point verification trading system to break down and analyze the latest market data thoroughly, providing practical insights!
Step One: Look at the Big Picture (Multi-Period Trend Overview)
Let’s first sort out the trends of the four periods:
1-Day Cycle: The closing price is 78350.01. The moving averages are in a typical bullish arrangement, MA5 is 76501.45, MA10 is 75936.68, MA30 is 71550.54, and the price is above all moving averages, indicating a strong upward trend!
4-Hour Cycle: The closing price is 78350.01. This also reflects a bullish arrangement, MA5 is 78589.55, MA10 is 77567.63, MA30 is 76265.81. The price is near MA5, with an upward trend but some short-term confusion.
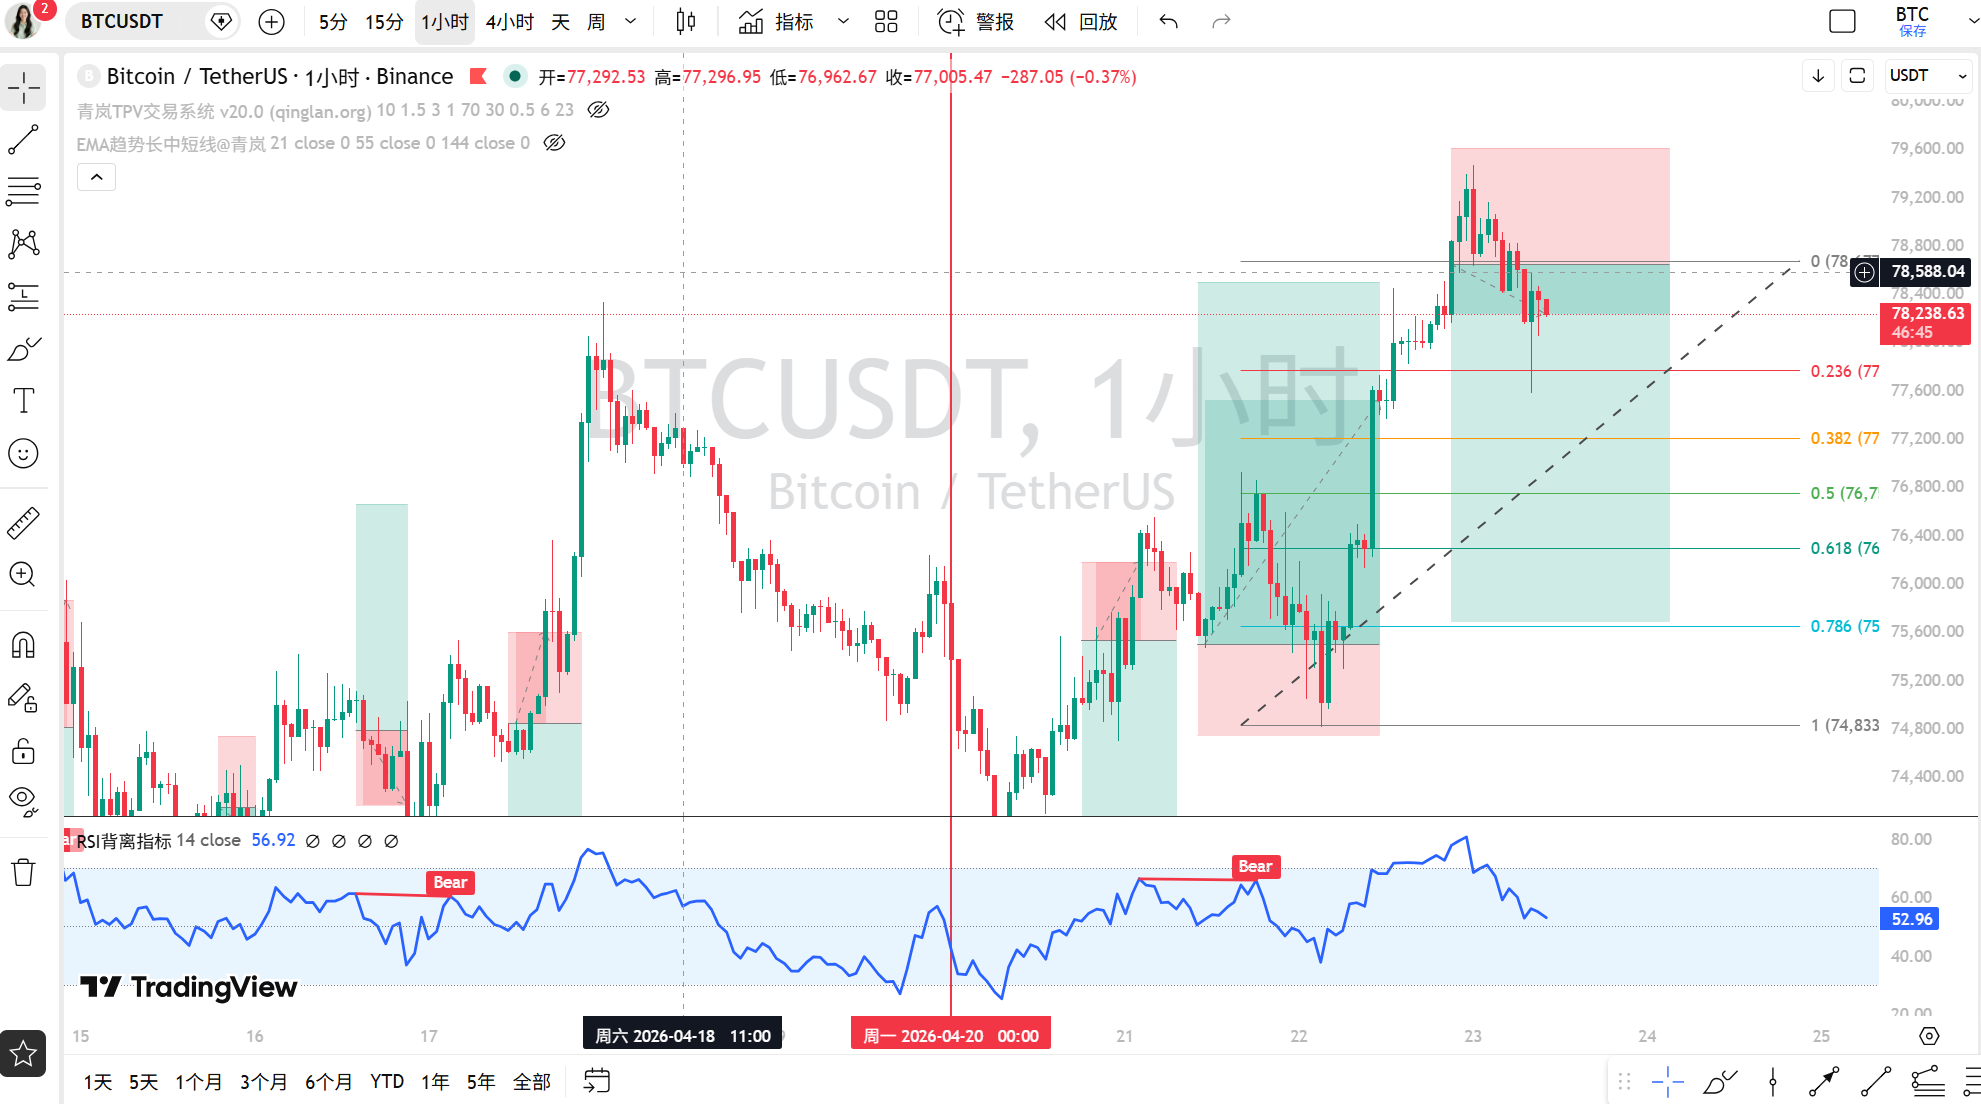
1-Hour Cycle: The closing price is 78350.01. The moving averages are intertwined, MA5 is 78383.94, MA10 is 78588.81, MA30 is 77978.99. The price is near the short-term moving averages, direction is unclear, and it is in a state of fluctuation.
15-Minute Cycle: The closing price is 78350.01. A bearish arrangement has appeared, MA5 is 78270.73, MA10 is 78270.95, MA30 is 78528.43. The price is below the moving averages, suggesting weakness in the short term.
Regarding market sentiment, on-chain data shows that the Fear and Greed Index is 46, which is “neutral.” This indicates that market sentiment is neither overly cold nor hot, with no extreme panic or fervent chasing of prices. The total market capitalization is 2698847340952.1675, showing a 24-hour change of 1.89, indicating that the market is still gently rising overall. News mentions “Bitcoin surges up and then falls back” and “breaks through the key level of $78,000,” which aligns with the small cycle correction we observed.
Step Two: Find the Pivot Points, Draw the Key Lines (Effective Highs and Lows + Trend Lines)
Let’s identify the key price points for each period:
1-Day: The most recent effective high (Pivot High) is 79472.82 (from the highest prices in the 4-hour series), and the effective low (Pivot Low) is 77582.17 (from the lowest prices in the 4-hour series). These two points have been repeatedly tested by subsequent prices, indicating a high level of effectiveness.
4-Hour: The effective high is also 79472.82, and the effective low is 77582.17. A rising trend line can be drawn connecting the recent lows, and currently, the price is hovering near this trend line.
1-Hour: The effective high is around 79400.0 and the effective low is around 78155.83. This range constitutes the recent fluctuation box.
15-Minute: The effective high is 78508.18, and the effective low is 78114.04. This small range represents the ultra-short-term battle zone.
The news “Bitcoin price dynamics: breaks below the key level of $78,000” corresponds to the testing of the lower edge of the 1-hour cycle, indicating that the news impacts the technical pivot points.
Step Three: Indicators for Support (Technical Indicator Verification)
Let’s see what the indicators say:
1-Day: MACD’s DIF is 2113.93, DEA is 1706.90, and the histogram is 407.03, with no crossover, showing that bullish momentum is still present. RSI is 67.95, close to overbought but not yet, indicating that the daily trend is strong but caution should be taken for retracement risks.
4-Hour: MACD’s DIF is 853.78, DEA is 624.54, and the histogram is 229.24, also showing bullish momentum. RSI is 62.41, slightly strong.
1-Hour: MACD’s DIF is 363.88, DEA is 509.13, and the histogram is -145.26, showing weaker momentum. RSI is 51.56, neutral.
15-Minute: MACD has formed a golden cross! DIF is -104.55, DEA is -110.61, and the histogram is 6.05. RSI is 46.30, slightly weak but showing signs of rebound.
A small detail here is that indicators in larger cycles (daily and 4-hour) are strong, while indicators in smaller cycles (1-hour and 15-minute) are weak, indicating a certain divergence in cycles, meaning that upward momentum is showing signs of weakening in smaller timeframes.
Step Four: Contesting Bulls and Bears (On News + On-Chain)
On News:
Bullish Factors: “S&P 500 and Nasdaq hit all-time highs, crypto concept stocks soar across the board,” “Nasdaq index hits a new high, and crypto concept stocks rise collectively” – Traditional market sentiment is good, boosting the crypto market. “Blockchain Capital plans to raise $700 million to establish two new crypto venture capital funds” – This indicates potential positive influence from capital.
Bearish Factors: “Bitcoin surges up and then falls back, the funding rate turns negative revealing bearish sentiment in the market,” “Bitcoin price dynamics: breaks below the key level of $78,000” – Directly reflects the short-term selling pressure and bearish sentiment in the market. “Risk aversion declines” – This may weaken Bitcoin's demand as a safe haven.
The most important core factor is the contest between "short-term bearish sentiment in the market" and "traditional market strength." The technical aspect (weakness in small cycles) and the news aspect (bearish sentiment) are currently resonating with each other.On-Chain Data:
Fear and Greed Index 46 (neutral), indicating calm market sentiment without extremes. BTC dominance at 58.16%, still occupying a significant portion. Total market capitalization has grown by 1.89%, showing that funds are still flowing in. On-chain data (overall mild and positive) and daily technical trends (bullish) are resonating together, but there is some divergence with the weakness in smaller cycles (1-hour, 15-minute).
Step Five: The Path of Least Resistance (Trading Strategy)
Overall, the big trend is upward, but the small cycles face adjustment pressure. The most suitable strategy now is: wait for a retracement to go long, rather than chase high.
Key entry area: Pay attention to the effective low of the 1-hour cycle around 78155.83 and the support area of the upward trend line in the 4-hour cycle (approximately in the 77800-78200 range).
Stop-loss basis: If the price breaks below the 4-hour key low of 77582.17, it indicates that the short-term upward structure may be damaged, and a stop-loss is needed.
Target area: First, look towards the recent high near 79472.82; if it breaks through, then look towards higher levels.
Step Six: Today's Forecast (Market Anticipation)
Currently (within a few hours): Expected to fluctuate in the small range of 78100 to 78500, direction is slightly weak, need to observe if the MACD golden cross in 15 minutes can trigger a rebound.
Today's and Recent Key Levels: The most important support level today is 78155.83 (1-hour low), followed by 77582.17 (4-hour low). The most crucial resistance level is 78508.18 (15-minute high), followed by 79472.82 (previous high). Pay special attention to the support effect of the 4-hour upward trend line.
Trade Thinking: The most suitable and only direction for trading now is "wait for a retracement to go long." The reason is that the trend in larger cycles hasn't changed, and the small cycle adjustment is close to a key support area, which offers a better risk-reward ratio. Avoid chasing the price above 78500.
Summary: The core contradiction in the current market is the confrontation between the “strong daily-level trend” and the “hourly-level adjustment demand.”
Trading Phrase: The news mentions “mining companies transforming to AI,” and we also need to learn to “transform” in trading, finding the “AI” (optimal entry points) for pullbacks within trends, rather than blindly chasing highs and selling lows.
[Qinglan TPV Trading System Backtesting Data]
Based on nearly 1024 historical backtests (sample size 1032), the accuracy rate is 71.8% (last backtest time 04-23 07:00:02). The backtesting results are for strategic confidence reference only; past performance does not guarantee future returns.
[Qinglan's Personal View]
Ah, looking at the market, Sister Qinglan feels that there's a bit of a “strong bow’s last pull” feeling now; although the overall direction is still upward, the force behind the surge is obviously lacking. We need more patience at this time, just like waiting for a fish to bite; one must not rush. Near key positions, the market will tell us the answer; if it breaks below key support, we must acknowledge it, but if it holds, then a rebound is an opportunity. Remember, preserving capital is always the first lesson!
This TPV system is something I've honed over the years of monitoring, reviewing, and real trading; I wouldn't dare say it's 100% accurate, but it can at least give us more confidence at key positions. If you want to get my latest entry opportunities captured based on the TPV system, feel free to visit the Qinglan Crypto Classroom official website www.qinglan.org
免责声明:本文章仅代表作者个人观点,不代表本平台的立场和观点。本文章仅供信息分享,不构成对任何人的任何投资建议。用户与作者之间的任何争议,与本平台无关。如网页中刊载的文章或图片涉及侵权,请提供相关的权利证明和身份证明发送邮件到support@aicoin.com,本平台相关工作人员将会进行核查。