The vulnerability of traditional financial margin rules is the anti-fragility of Bitcoin.
Author: Jeff Park
Translation: Deep Tide TechFlow
Deep Tide Introduction: Bitwise advisor and ProCap Chief Investment Officer Jeff Park reviews the real reasons behind Bitcoin's 13.2% crash on February 5 in this lengthy article. He believes that this was not a fundamental-driven sell-off, but rather a technical chain collapse triggered by traditional financial multi-strategy funds de-leveraging, amplified by short gamma in the options market. The key data: IBIT's trading volume on that day exceeded $10 billion, setting a record, while ETF fund flows were net inflows. This analysis is very valuable for understanding the deep embedded relationship between Bitcoin and traditional capital markets.
At the end of the article, the author also mentioned in the comments, "If you seize this opportunity, a great opportunity is right in front of you."

What Happened on 2/5?
As more data comes in, one thing becomes increasingly clear: the severe sell-off was related to Bitcoin ETFs and occurred on one of the most brutal days in the capital markets.
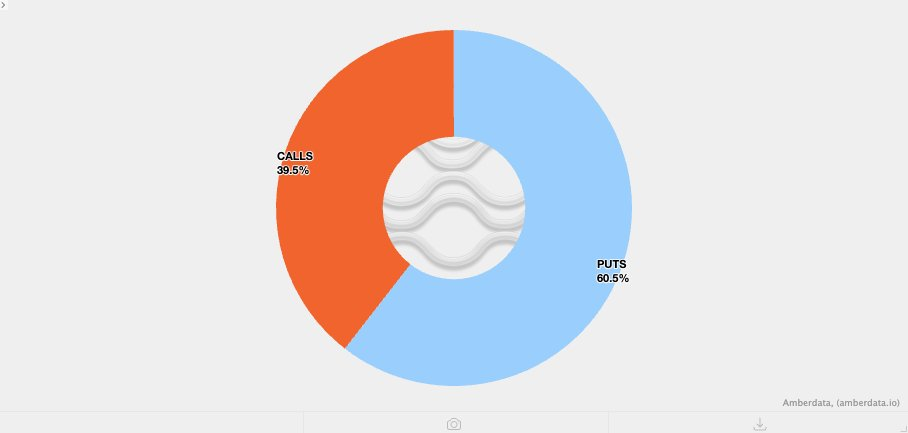
How do we know this? Because IBIT set a historical trading volume record (over $10 billion, double the previous record), and the options trading volume reached the highest contract number since the ETF's listing. Unlike previous instances, this time the options activity was dominated by put options, with trading volume clearly skewed towards the sellers. This will be discussed further.
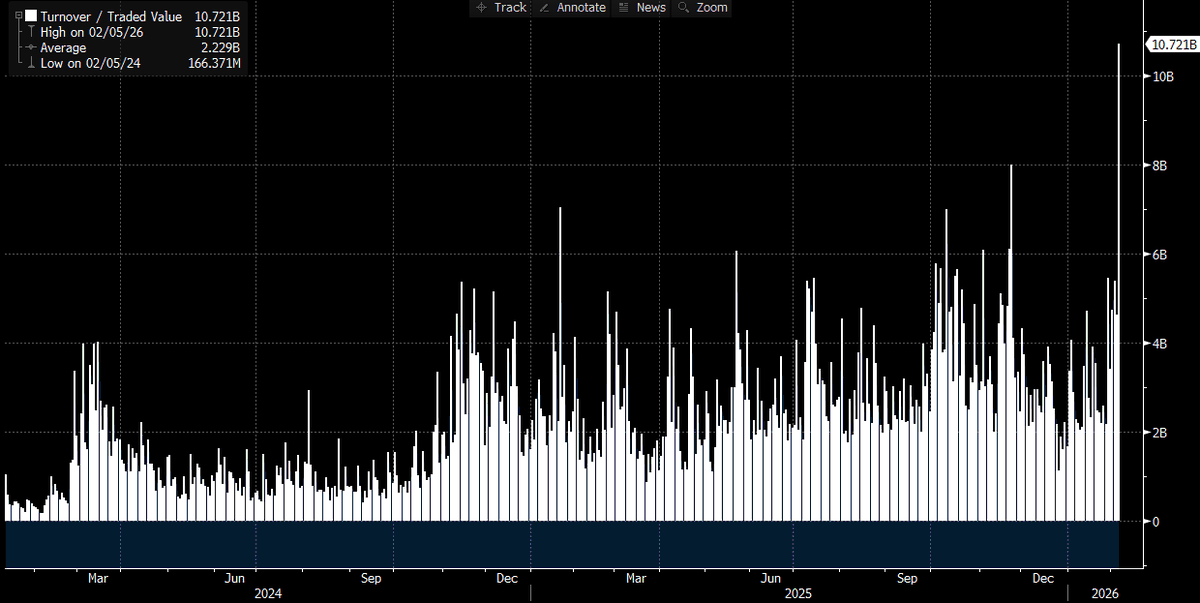
Caption: Historical trading volume data for IBIT, recorded a record high on 2/5
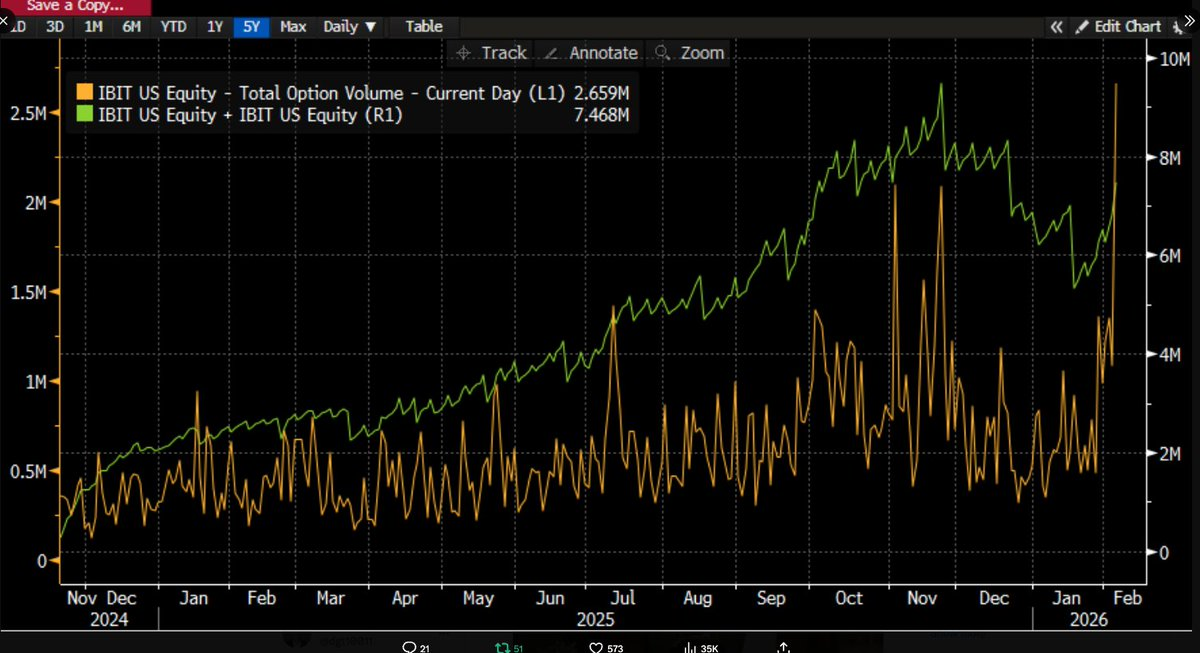
Caption: Total options trading volume for IBIT, with the highest contract number since the ETF's listing on that day
Meanwhile, the price movements of IBIT showed a strong correlation with software stocks and other risk assets over the past few weeks. Data from Goldman Sachs' PB (Prime Brokerage) department also indicated that February 4 was one of the worst days ever for multi-strategy funds, with a z-score of 3.5. What does this mean? This is a 0.05% probability event, ten times rarer than a three standard deviation event. It can be described as catastrophic.
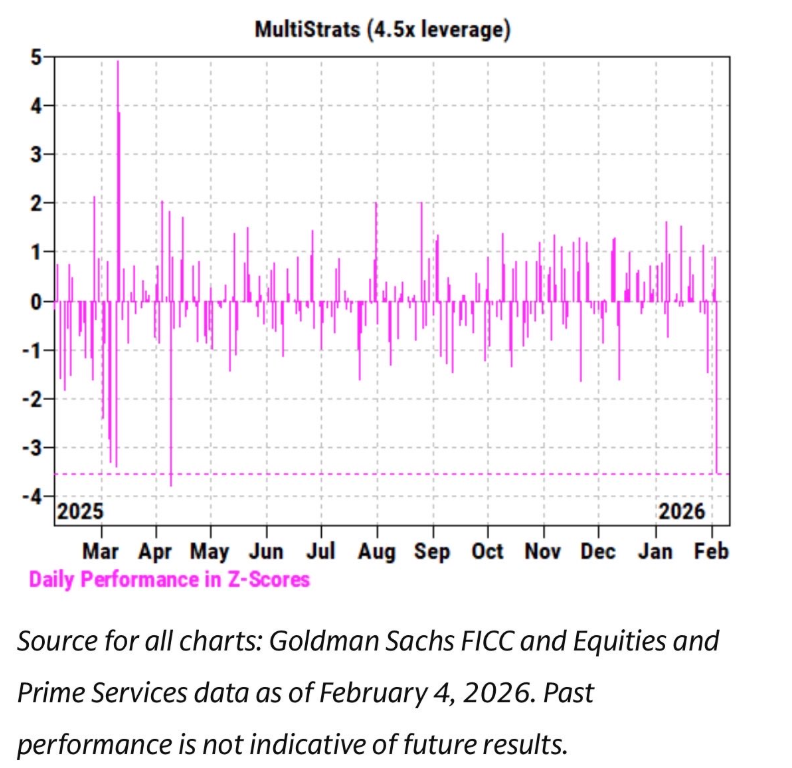
Caption: Source Goldman Sachs FICC and Equities and Prime Services, data as of February 4, 2026, past performance does not guarantee future results
After each occurrence of such a level of event, risk control managers from Pod Shops (trading groups under multi-strategy funds) would jump out and demand everyone to immediately reduce their positions indiscriminately. This explains why February 5 was also a bloodbath.
Abnormal Fund Flows in IBIT
Considering the record activity and price movement (a drop of 13.2%) that day, we would have expected to see net redemptions. Referring to historical data: on January 30, IBIT dropped 5.8% the day before, recording a historic maximum redemption of -$530 million; on February 4, it redeemed -$370 million amid continuous declines. By this logic, an outflow of $500 to $1 billion seemed reasonable.
But the reality was quite the opposite; we saw widespread net subscriptions: IBIT added about 6 million shares, with AUM increasing by over $230 million. Other ETFs also recorded inflows, totaling over $300 million and still increasing.
This is puzzling. You could barely explain that the strong rebound on February 6 reduced some outflows, but turning it into net subscriptions is a completely different matter. This indicates that multiple factors were at play simultaneously, but they did not point to a single narrative.
Based on the information currently available, several hypotheses can be made:
- The Bitcoin sell-off triggered a multi-asset investment portfolio or strategy that is not purely crypto-native (possibly the aforementioned multi-strategy hedge funds, or model portfolios like those under BlackRock that allocate between IBIT and IGV, which triggered automatic rebalancing after severe volatility).
- The acceleration of the Bitcoin sell-off is related to the options market, especially in the downward direction.
- The sell-off did not lead to a final outflow of Bitcoin assets, meaning that most of the activity was dominated by market makers and traders' "paper money" operations, which were generally hedged positions.
My Hypotheses
Based on these facts, my hypotheses are as follows:
- The catalyst is widespread de-leveraging of multi-asset funds/portfolios. Because the downward correlation of risk assets reached a statistically abnormal level.
- This led to severe de-leveraging, including Bitcoin, but a large amount of Bitcoin risk was actually "delta neutral" hedged positions. For example, basis trading, relative value trading (benchmarking crypto stocks), etc., which typically hedge out residual delta among the market maker community.
- De-leveraging triggered some short gamma effects, creating compounded acceleration in the downward direction. Market makers needed to sell IBIT, but due to the severe sell-off, they had to short Bitcoin without inventory. This effectively created new inventory, reducing the anticipated large outflows.
- Then on February 6, there was a positive inflow into IBIT, with buyers (the specific type of buyers is still uncertain) buying the dip, further offsetting what could have been a small net outflow.
Starting from Software Stock Correlation
I tend to believe the catalyst came from the sell-off of software stocks, as the correlation even extended to gold. Look at the two charts below:
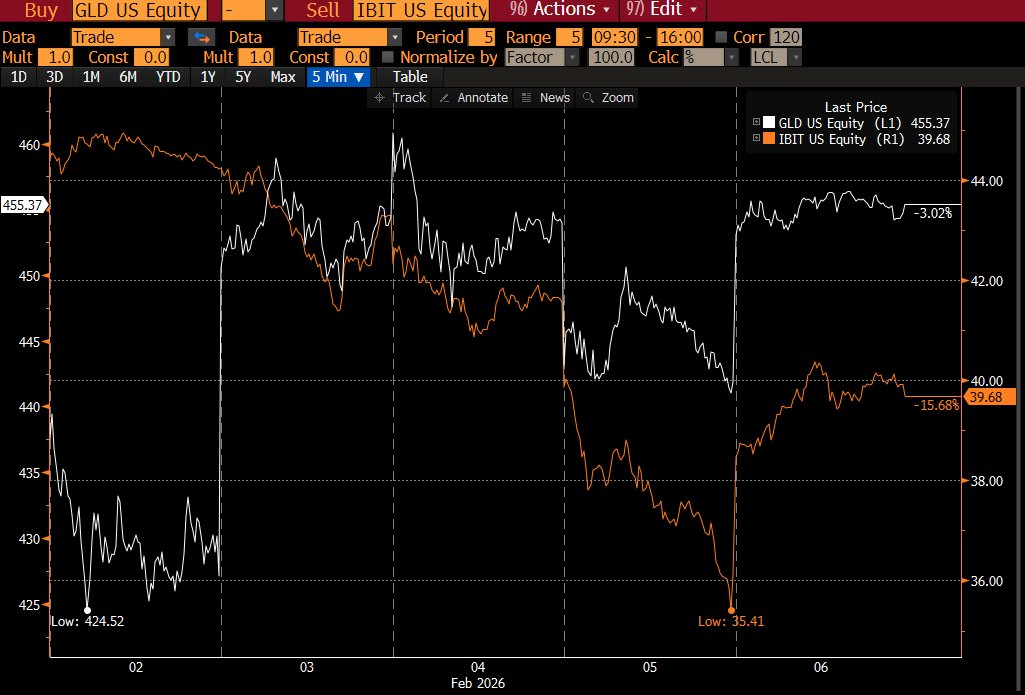
[Image: Correlation chart of GLD vs IBIT (Bloomberg terminal screenshot)]
Caption: Comparison of price movements between GLD (Gold ETF) and IBIT
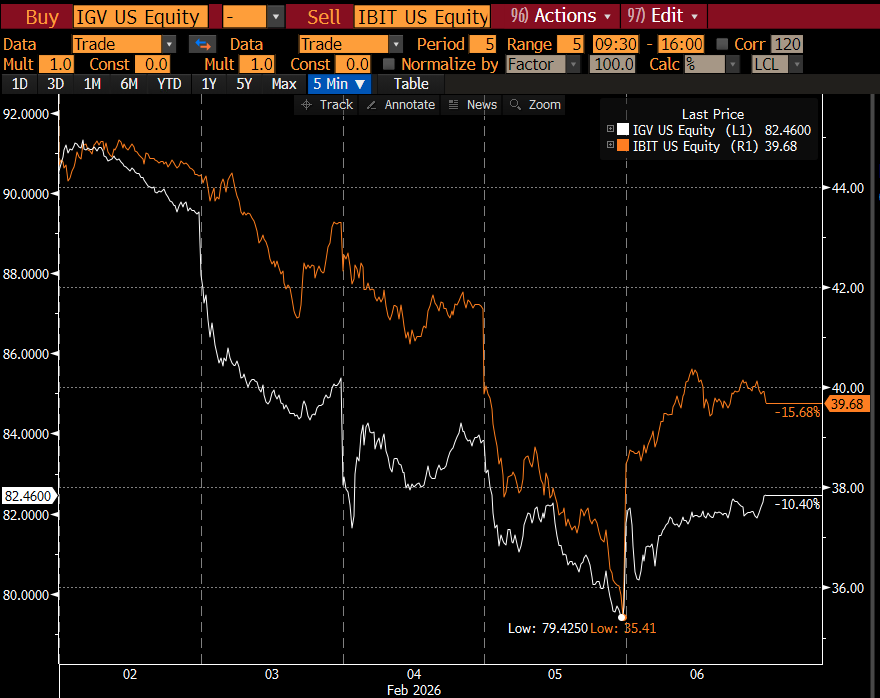
[Image: Correlation chart of IGV vs IBIT (Bloomberg terminal screenshot)]
Caption: Comparison of price movements between IGV (Software ETF) and IBIT
This makes sense to me. Gold is essentially not an asset used by multi-strategy funds for financing trades, but it may be part of RIA (Registered Investment Advisor) model portfolios. So this validates that the core of the event is more likely to be multi-strategy funds.
Collapse of CME Basis Trading
This leads to the second point: severe de-leveraging included hedged Bitcoin risks. Take the CME basis trading, favored by Pod Shops, as an example:
[Image: CME BTC basis data table (30/60/90/120 days)] Caption: CME BTC basis data from January 26 to February 6, thanks to @dlawant for providing
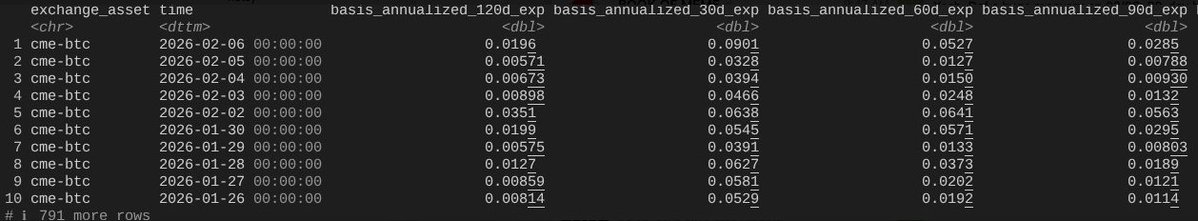
Looking at the complete data set, we see that the near-month basis skyrocketed from 3.3% on 2/5 to 9% on 2/6. This is one of the largest jumps we have observed since the ETF's listing, essentially confirming what happened: basis trades were forcibly liquidated under orders.
Think about giants like Millennium and Citadel, who were forced to execute basis trade liquidations (selling spot, buying futures). Considering their size in the Bitcoin ETF ecosystem, you can understand why it was blown up.
Structured Products: Downward "Fuel"
This brings us to the third leg. Since we understand the mechanism of IBIT being sold off in widespread de-leveraging, what is accelerating the downward movement? One possible "fuel on the fire" factor is structured products.
While I do not believe the scale of the structured products market is large enough to be solely responsible for this sell-off, when all factors align in a way that no VaR model could predict, it could very well become the trigger point for a chain liquidation event.
This immediately reminds me of my days at Morgan Stanley—Knock-In put barrier options can allow delta to exceed 1 under certain circumstances, a situation that the Black-Scholes model does not consider for ordinary options.
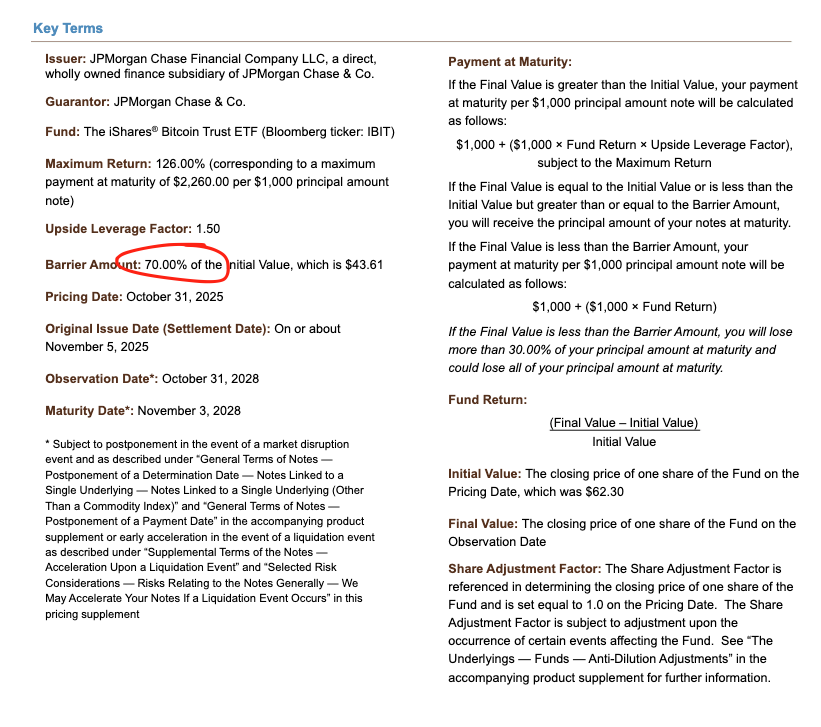
[Image: Structured note document priced by JPM last November]
Caption: JPM structured notes, with barrier levels around 43.6
Look at those notes priced by JPM last November, with barrier levels around 43.6. If Bitcoin dropped another 10% in December, many barriers would fall in the range of 38-39—right at the center of this storm.
When these barriers are breached, if market makers use a combination of short puts to hedge Knock-In risk, the gamma changes rapidly, especially under negative vanna (volatility sensitivity) dynamics, forcing market makers to aggressively sell the underlying asset during the decline.
What we are seeing is this: implied volatility (IV) collapsing to historically extreme levels, almost touching 90%, indicating a catastrophic squeeze. In this scenario, market makers may have to short a large amount of IBIT, ultimately creating net new shares. This part requires some imagination; without more spread data, it is hard to confirm. But considering the record trading volume, it is entirely possible that authorized participants (AP) were involved.
Overlay of Crypto-Native Short Gamma
Adding another factor: Due to the low volatility in recent weeks, clients in the crypto-native space have been buying put options. This means that crypto market makers are naturally in a short gamma state, essentially selling options at too low a price. When an unexpected large volatility arrives, the downside is further amplified.
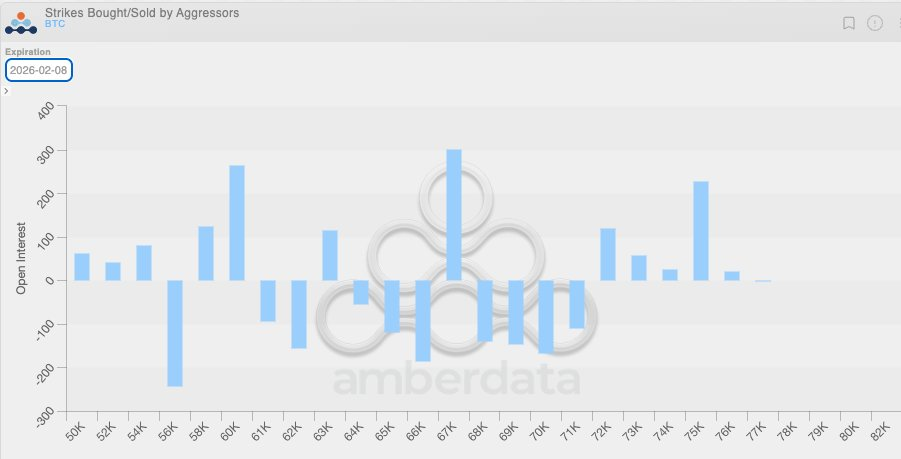
[Image: Market maker gamma position distribution chart]
Caption: Market makers primarily hold short gamma positions in put options in the range of 64k-71k
The Rebound on February 6
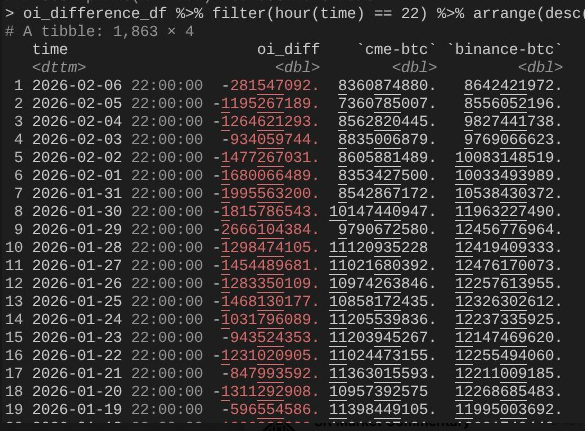
By 2/6, Bitcoin completed a heroic rebound of over 10%. An interesting phenomenon is that the expansion rate of open interest (OI) on CME is far faster than that on Binance.
[Image: Comparison chart of OI changes between CME and Binance]
Caption: Thanks to @dlawant for providing hourly snapshot data, aligned to 4 PM Eastern Time
We can see that OI significantly decreased from 2/4 to 2/5 (again confirming that CME basis trading was liquidated on 2/5), but it rebounded on 2/6, possibly to take advantage of the higher basis levels, offsetting the outflow effect.
This paints the entire picture: IBIT's subscriptions/redemptions were roughly balanced because CME basis trading net recovered; however, the price was lower because Binance's OI collapsed, indicating that a large amount of de-leveraging came from crypto-native short gamma and liquidations.
Conclusion: Not a Fundamental Event
So this is my best theory on what happened on 2/5 and 2/6. It has some assumptions and is not entirely satisfying—because there is no single "culprit" like FTX to blame.
But the core conclusion is: The catalyst came from non-crypto traditional financial de-risking operations, which coincidentally pushed Bitcoin to a level where short gamma accelerated the downside through hedging activities (rather than directional trading), leading to a need for more inventory—this quickly reversed traditional financial market neutral positions on 2/6 (but unfortunately, crypto directional positions did not recover in sync).
While this answer may not be satisfying, at least it can be confirmed that yesterday's sell-off had nothing to do with 10/10.
Refuting the "Hong Kong Fund Yen Arbitrage" Theory
I do not believe last week's events were a continuation of the de-leveraging from 10/10. Some have mentioned that a non-U.S. Hong Kong fund may have been involved in a yen arbitrage trade liquidation. This theory has two major flaws:
First, I do not believe there is a non-crypto prime broker that can simultaneously provide such complex multi-asset trading services, offer a 90-day margin buffer, and not run into problems when risk controls tighten.
Second, if financing arbitrage was used to buy IBIT options to "make up for losses," then a drop in Bitcoin would not lead to accelerated downside—options would simply become out-of-the-money (OTM) and then the Greeks would go to zero. This means that this trade must involve downside risk. If you are shorting IBIT put options while going long on dollar-yen arbitrage—then that prime broker deserves to go bankrupt.
The Next Few Days Are Crucial
The next few days are very important, as we will see more data to determine whether investors are using this pullback to create new demand, which would be a very bullish signal.
Currently, the outlook for ETF fund flows is encouraging. I have always believed that true RIA-style ETF buyers (not relative value hedge funds) are diamond hands. In this regard, we have seen a lot of institutional push, including everything that industry colleagues and Bitwise are doing. To verify this, I am focusing on net inflows that do not accompany basis trading expansions.
The Vulnerability of Traditional Finance is Bitcoin's Anti-Fragility
Finally, this incident also tells you: Bitcoin has now integrated into the financial capital markets in a very complex way. This means that when we are positioned for a squeeze in the opposite direction, the upward movement will be more vertical than ever before.
The vulnerability of traditional financial margin rules is the anti-fragility of Bitcoin. Once the reverse melt-up arrives—which I believe is inevitable, especially now that Nasdaq has raised the open interest limits for options—it will be spectacular.
免责声明:本文章仅代表作者个人观点,不代表本平台的立场和观点。本文章仅供信息分享,不构成对任何人的任何投资建议。用户与作者之间的任何争议,与本平台无关。如网页中刊载的文章或图片涉及侵权,请提供相关的权利证明和身份证明发送邮件到support@aicoin.com,本平台相关工作人员将会进行核查。


