Recently, the most frequently asked question is:
Can we bottom fish and go long now, including spot and contracts?
The conclusion is very clear: the conditions are not met at the moment.
From the current downward trend, the market has not yet reached its bottom and is still in a sharp decline. According to the basic principles of trend trading—do not catch a falling knife, do not touch the bottom—only after a reversal signal appears will we consider the bullish direction.
As of now, there hasn't even been a stop-loss signal, and the market remains in a downward structure.
The idea for high-level short positions: passive exit, not active closing
For friends who already hold short positions at high levels, during this round of decline, it is recommended not to actively exit but to choose a passive exit.
Passive exit means not subjectively guessing a rebound or reversal, but managing risk through position management, such as:
First, take profit on a portion
Move the stop-loss for the remaining position down
Lock in profits and let the position continue to follow the trend
Before a stop-loss signal appears, the bearish logic still holds.
The rebound space at the bottom can be overlooked for short profits.
Currently, short positions can still be held.
Review of the judgment from the day before yesterday: shorting opportunity at the 1-hour level
The day before yesterday, we clearly pointed out an excellent shorting area at the 1-hour level.
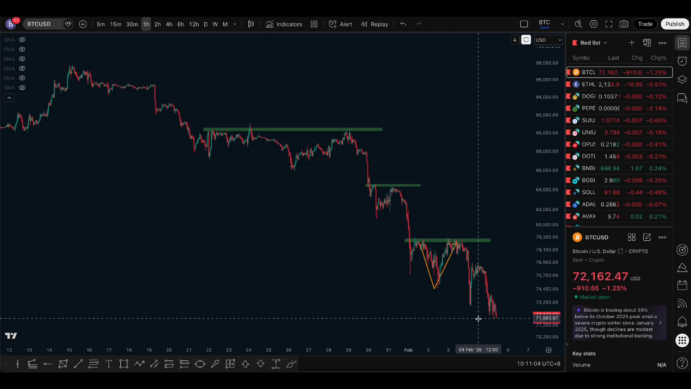
At that time, the key resistance level was around 79,000, which was tested twice:
Broke below the previous low and then retraced
Failed to break through the previous phase high
Resistance not broken, structure remains bearish
Therefore, the advice given was: only trade shorts, only take short positions, with the defense point set at 80,000.
Subsequently, the market dropped from 79,000 all the way down, with the lowest point last night reaching around 72,000, a drop of about 7,000–8,000 points, which was a profit that could be fully captured.
Until the structure changes, shorting on rallies remains the only logic
In the small cycle structure, to confirm a reversal, at least two conditions need to be met:
Key resistance levels are effectively broken
Market structure changes
Before these two signals appear, shorting on rallies remains the only trading direction.
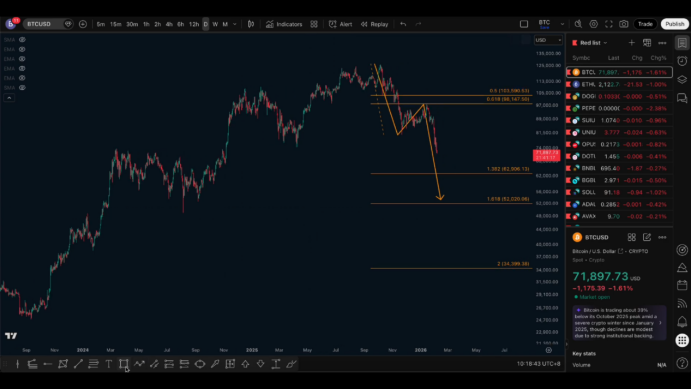
Daily analysis: at least another 15% extension space
After breaking below the previous low of 75,000, the market is likely to extend downwards by at least 15%.
This structure can refer to the previous trend after breaking the top, which also extended by about 15%, completing the bullish liquidation.
According to this calculation, a reasonable downward area is around 63,000.
Mid-term view unchanged: breaking below 70,000 is just a matter of time
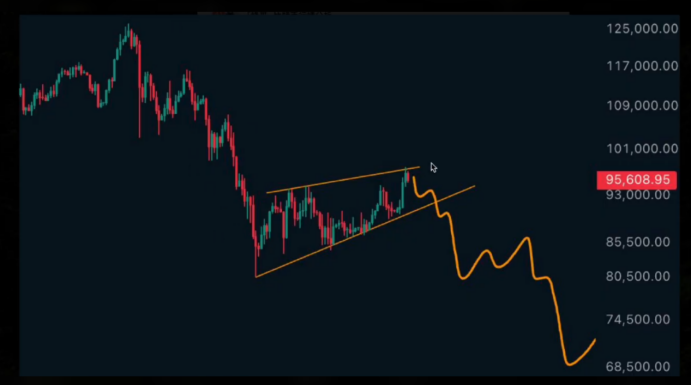
In fact, it was already clearly mentioned in mid-last month:
The daily level adjustment has ended
The bearish trend will continue
The mid-term target is to break below 70,000, looking towards the 60,000s
At that time, the price was around 95,000–96,000, and we had already given a top warning. The current trend is basically running according to this rhythm.
Current market: bearish signals are very dense
In this round of decline, almost every rebound has been a clear bearish signal:
Rebound under pressure
Low points broke and then retraced
Retracement did not break resistance
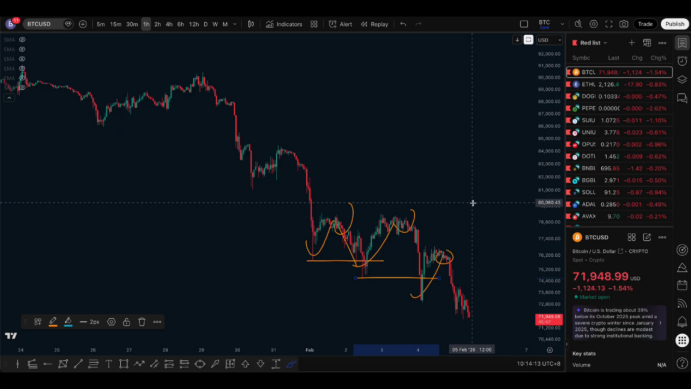
These positions have provided opportunities for short entries.
Long-term shorts can continue to be held.
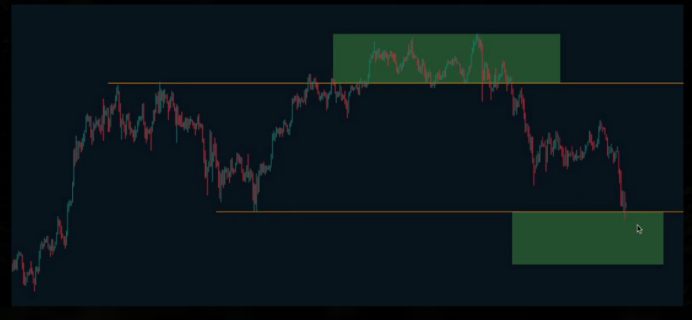
Where will it drop to? The resonance range of weekly and daily charts
From the weekly perspective, the Vegas channel is the spot strategy range we have been focusing on for a long time. The price has now entered the channel, and we just need to patiently wait for the bottoming to complete.
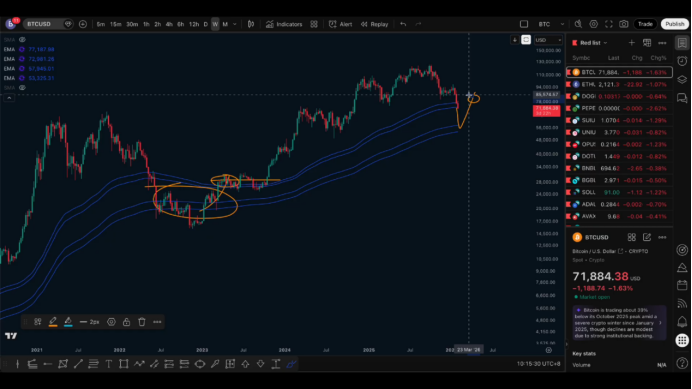
More detailed references come from two moving averages:
The 50-week average has broken down, and the trend has turned bearish
The 200-week average is often the final support
In this cycle, the 200-week average is roughly around 57,000–58,000, which means that below 60,000 is more inclined to be the area to consider for spot trading.
Daily structure: likely a two-phase decline
From historical bear markets, declines at the weekly and daily levels are usually two-phase structures.
If this round is the same, the bearish extension of 1.382–1.618 corresponds to a price range of 63,000–52,000.
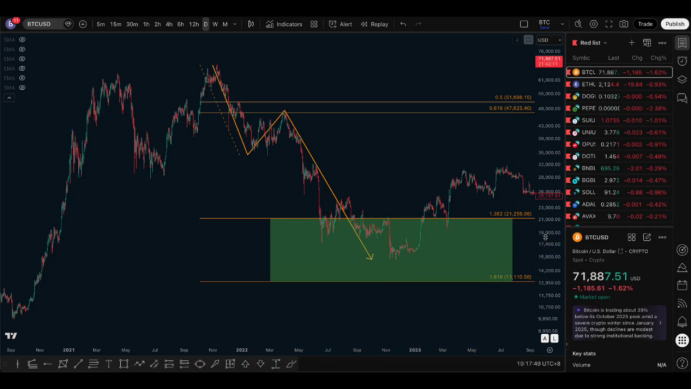
This range also possesses:
The daily bearish extension limit
Important past consolidation structures
The key high point range of the last bull market
It belongs to a clearly strong support resonance area.
Views on extreme declines
Some people are worried about a 70%–80% deep retracement.
I personally believe that the probability of this is not high.
A more reasonable trend still revolves around completing the drop and bottoming in the range of 63,000–52,000.
Long-term perspective: extremely rare spot opportunity
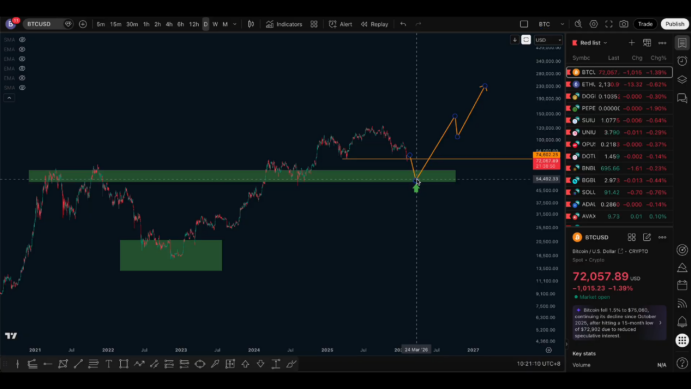
If the price falls back to this range, I believe there is over a 70% chance that it will become the only true spot bottoming opportunity below 100,000 for a long time to come.
Once the bottoming is completed here, the next round of rising is expected to break through the previous high, with a short-term target looking towards around 150,000, and Bitcoin below 100,000 will become very scarce.
More strategies, join the community, let's progress together.

免责声明:本文章仅代表作者个人观点,不代表本平台的立场和观点。本文章仅供信息分享,不构成对任何人的任何投资建议。用户与作者之间的任何争议,与本平台无关。如网页中刊载的文章或图片涉及侵权,请提供相关的权利证明和身份证明发送邮件到support@aicoin.com,本平台相关工作人员将会进行核查。


