From the current 1-hour level structure, friends who have been following me for a long time should be very clear about my understanding of trends—once a trend is formed, it is difficult to reverse easily.
- The essence of this decline: the beginning of a new trend
We started to pay close attention to this trend after breaking above 94,000.
When the price was around 98,000, I clearly stated my view of the top and pointed out:
This is not a complex adjustment of the previous rise, but the beginning of a new downward trend.
If one had followed the trend at that time, they could have participated in this decline at least around 94,000 or above 90,000.
From 98,000 to 74,000,
a decline of over 20,000 was achieved in a short period.
- Why this type of market is easier to hold onto
Generally, many friends who trade trends find it difficult to hold onto an entire large market move.
The reason is not complicated—market movements are too slow.
If a decline takes 3 weeks or even a month to complete, any rebound or consolidation during that time will trigger a lot of "plot development," causing people to constantly doubt whether the trend has ended, ultimately choosing to close their positions early.
However, this decline was completed quickly in a short time,
which made it easier for most trend-following traders to hold onto the entire trend.
- How to handle existing short positions
If you currently have short positions, the conclusion is quite clear:
At this position, there is no need to exit completely.
I have previously mentioned that you can consider taking partial profits, but you must retain some positions to bet on further larger downward space.
Trend positions are more suitable for passive exits rather than active exits.
As long as there are no clear signals of a stop or reversal, there is no reason to end trend trading early.
From the current perspective:
Whether on the daily or 1-hour level,
there are no clear reversal signals.
Therefore, short positions can continue to be held primarily with remaining positions.
- Key resistance levels and current structure
From a multi-timeframe structure perspective, it is still in a bearish state regarding moving averages.
On the 1-hour level, it can be clearly seen:
The most obvious horizontal resistance level is at 79,000.
This level has not been effectively broken.
This is completely consistent with the previous structures around 84,000 and even earlier around 90,000:
Resistance unbroken, look bearish.
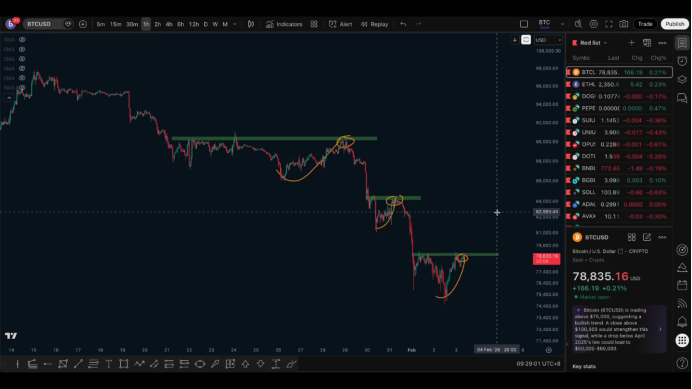
A rebound that does not break the previous high essentially provides an opportunity for a high short.
The current rebound has also not broken the previous high, so logically, short positions can still be held.
- What to do if you are currently flat
If you are currently flat, you can only consider short-term shorts.
In this case, you must prioritize defense:
Stop-loss should be placed above the key resistance level,
for example, above 79,000
or simply above the 80,000 round number.
It is important to note that short-term short trades must have strict stop-losses,
as there is a possibility of a short-term upward breakout.
- What conditions must be met for a true reversal
If the market is to undergo a trend reversal, two conditions must be met simultaneously:
Key resistance levels must be effectively broken.
The market must form a clear bullish structure, that is, up—pullback—up again.
This set of standards is consistent in both bullish and bearish trends.
It is particularly important to emphasize:
If a reversal only occurs at the 1-hour level,
it is more likely just a healthy adjustment within a larger downward trend.
It does not equate to a reversal of the larger cycle trend.
A large cycle reversal must see the formation of a larger bullish arrangement.
- If a reversal really occurs, which ranges to focus on
Assuming that subsequently at the 1-hour level:
A key resistance level is broken,
while forming a bullish structure,
and the market continues to rise,
then it may drive a daily level rebound.
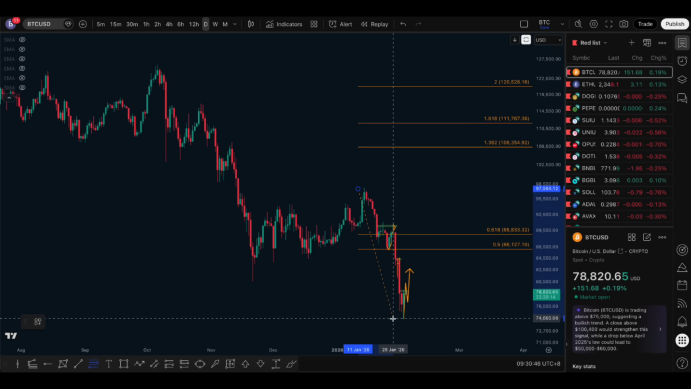
In this case, the key upper pressure range to focus on is:
86,000–89,000.
If participating in a bullish position, it can only be done after:
Key resistance is broken,
and structure is confirmed,
to participate in a bottom short-term long, looking for rebound space,
rather than preemptively ambushing.
- Why it is more suitable to only trade one side in a trend
I have always emphasized that in trending markets, only trading one side is the ideal choice.
The reason is simple:
Retracement risks are higher.
Both bulls and bears want to catch the move, which easily disrupts the rhythm.
Once the rhythm is disrupted, it is easy to see:
Chasing shorts at low levels,
Chasing longs at high levels,
Continuous stop-losses,
Imbalanced mindset.
Ultimately, this turns a clear trend into a reverse operation.
If you exit early in a trend, the best practice is not to immediately participate in new trades,
but to wait for the next clear adjustment structure to appear, then re-engage in high-position trend trades.
- Current conclusion
From the current 1-hour level structure, it still belongs to:
Decline—rebound—encounter resistance—then consider going short.
The logic is consistent with the movements at previous key positions.
Therefore, the current focus remains on a bearish trend.
In the coming days, I will also share my personal views on the larger cycle trend separately for a more systematic overview.
Follow me, join the community, and let's improve together.

免责声明:本文章仅代表作者个人观点,不代表本平台的立场和观点。本文章仅供信息分享,不构成对任何人的任何投资建议。用户与作者之间的任何争议,与本平台无关。如网页中刊载的文章或图片涉及侵权,请提供相关的权利证明和身份证明发送邮件到support@aicoin.com,本平台相关工作人员将会进行核查。