📊 Bitcoin Technical Analysis of Charts
Overall Trend and Key Support
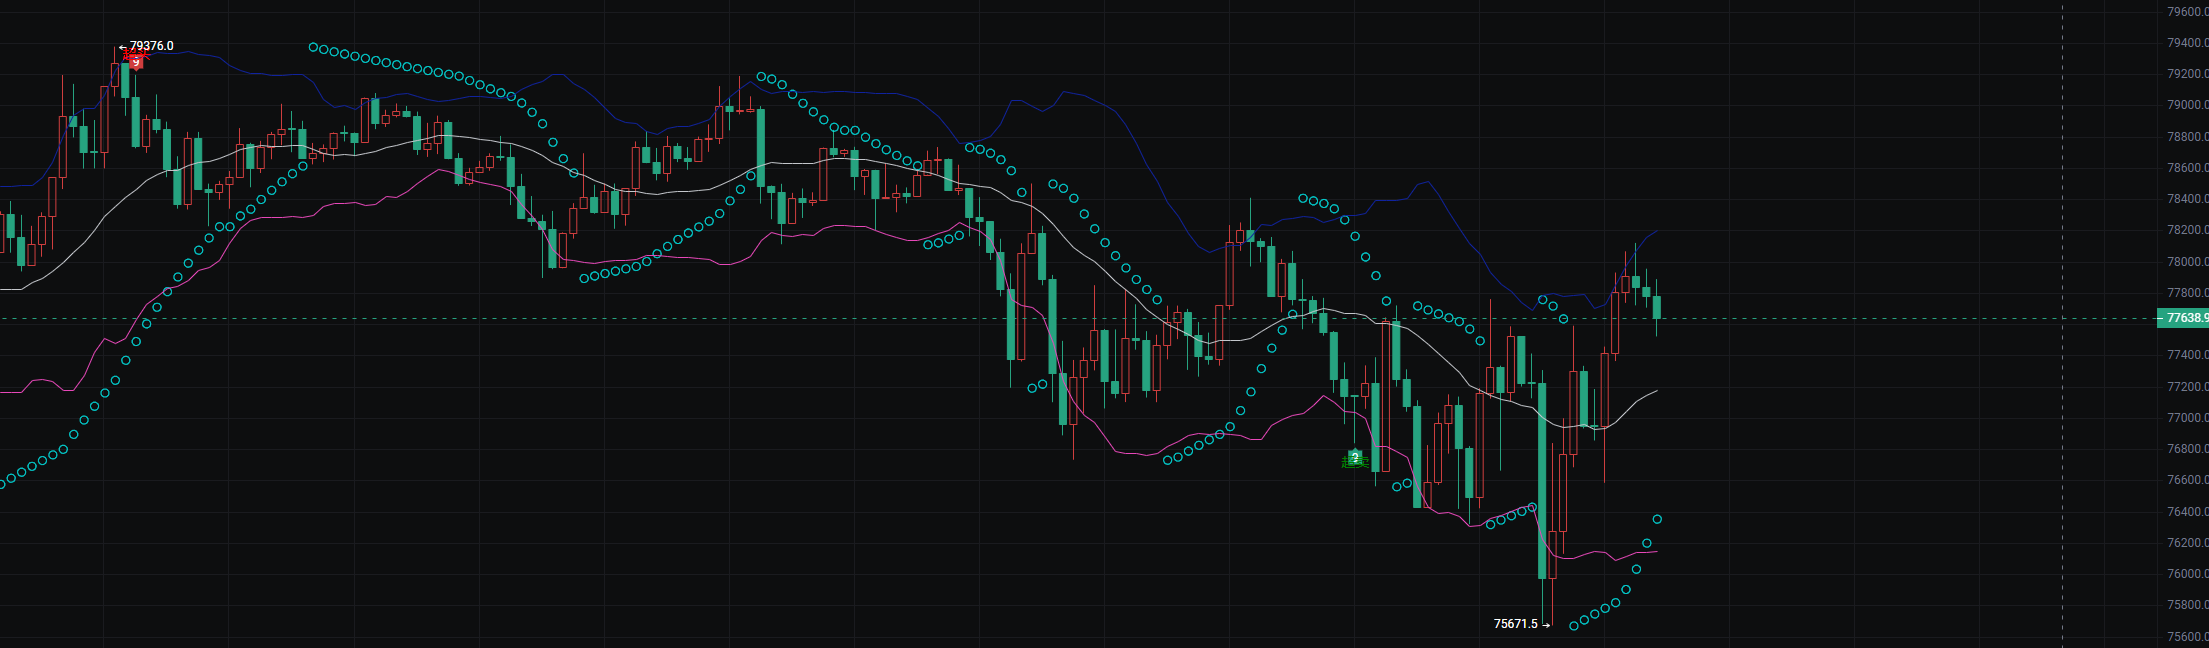
The price has retraced from the previous high of 79376.0, dipping to a low of 75671.5, and then rebounding.
75671.5 has become an important recent low; if this level is not breached again, it may serve as a short-term bottom.
Moving Averages and Indicator Signals
The price is currently above the white moving average, which shows signs of flattening and turning upwards, indicating a strengthening of short-term bullish momentum.
The pink moving average is still in a downward trend but is getting closer to the price, suggesting that medium-term downward pressure is gradually easing.
The channel formed by the blue upper and lower bands is narrowing after the price hit the bottom, indicating that short-term volatility may decrease, and the market is in a phase of directional choice.
The cyan dot indicator has been following the price down during the decline, and after the low, it has started to turn upwards, forming a bullish divergence with the price, which is a positive bullish signal.
Current Bull-Bear Battle
Bulls: The price has rebounded strongly from the low and has broken through the short-term moving average, indicating that funds are supporting at lower levels.
Bears: The pressure from the previous high remains, and the pink moving average has not yet flattened, meaning the medium-term trend has not fully reversed.
Short-term key levels: The current price is fluctuating around 77638.5, with resistance at the 78000 round number above and support at 77000 and 75671.5 below.
📈 Follow-up Strategy Reference
Bullish Outlook: If the price can stabilize above 77638.5, continue to hold long positions, targeting the 78000-78500 range.
Risk Control: If the price falls below 77000, be cautious of the risk of a failed rebound; it is advisable to reduce positions or exit and wait for a retest of the 75671.5 support for confirmation.
🎯 Key Price Level Bull-Bear Operation Tips
Below 77000
If the price effectively breaks below 77000, shift to a short-term bearish outlook, and it is recommended to reduce long positions or exit and observe, with a stop-loss reference at 77200.
77000–77638.5
This is a consolidation range; you can try a small long position, relying on the 77000 support for a swing, with a stop-loss reference at 76800.
77638.5–78000
After stabilizing above 77638.5, you can increase long positions, targeting the 78000 round number, with a stop-loss reference at 77400.
78000–78500
This is a previous pressure zone; if it breaks above 78000, you can continue to hold long positions; if it encounters resistance and falls back, reduce positions to lock in profits, with a stop-loss reference at 77800.
75671.5 (Previous Low)
This is a strong support level; if it retests this level without breaking, it presents an excellent buying opportunity, with a stop-loss reference at 75400.
📊 Ethereum Technical Analysis of Charts
Overall Trend and Key Support
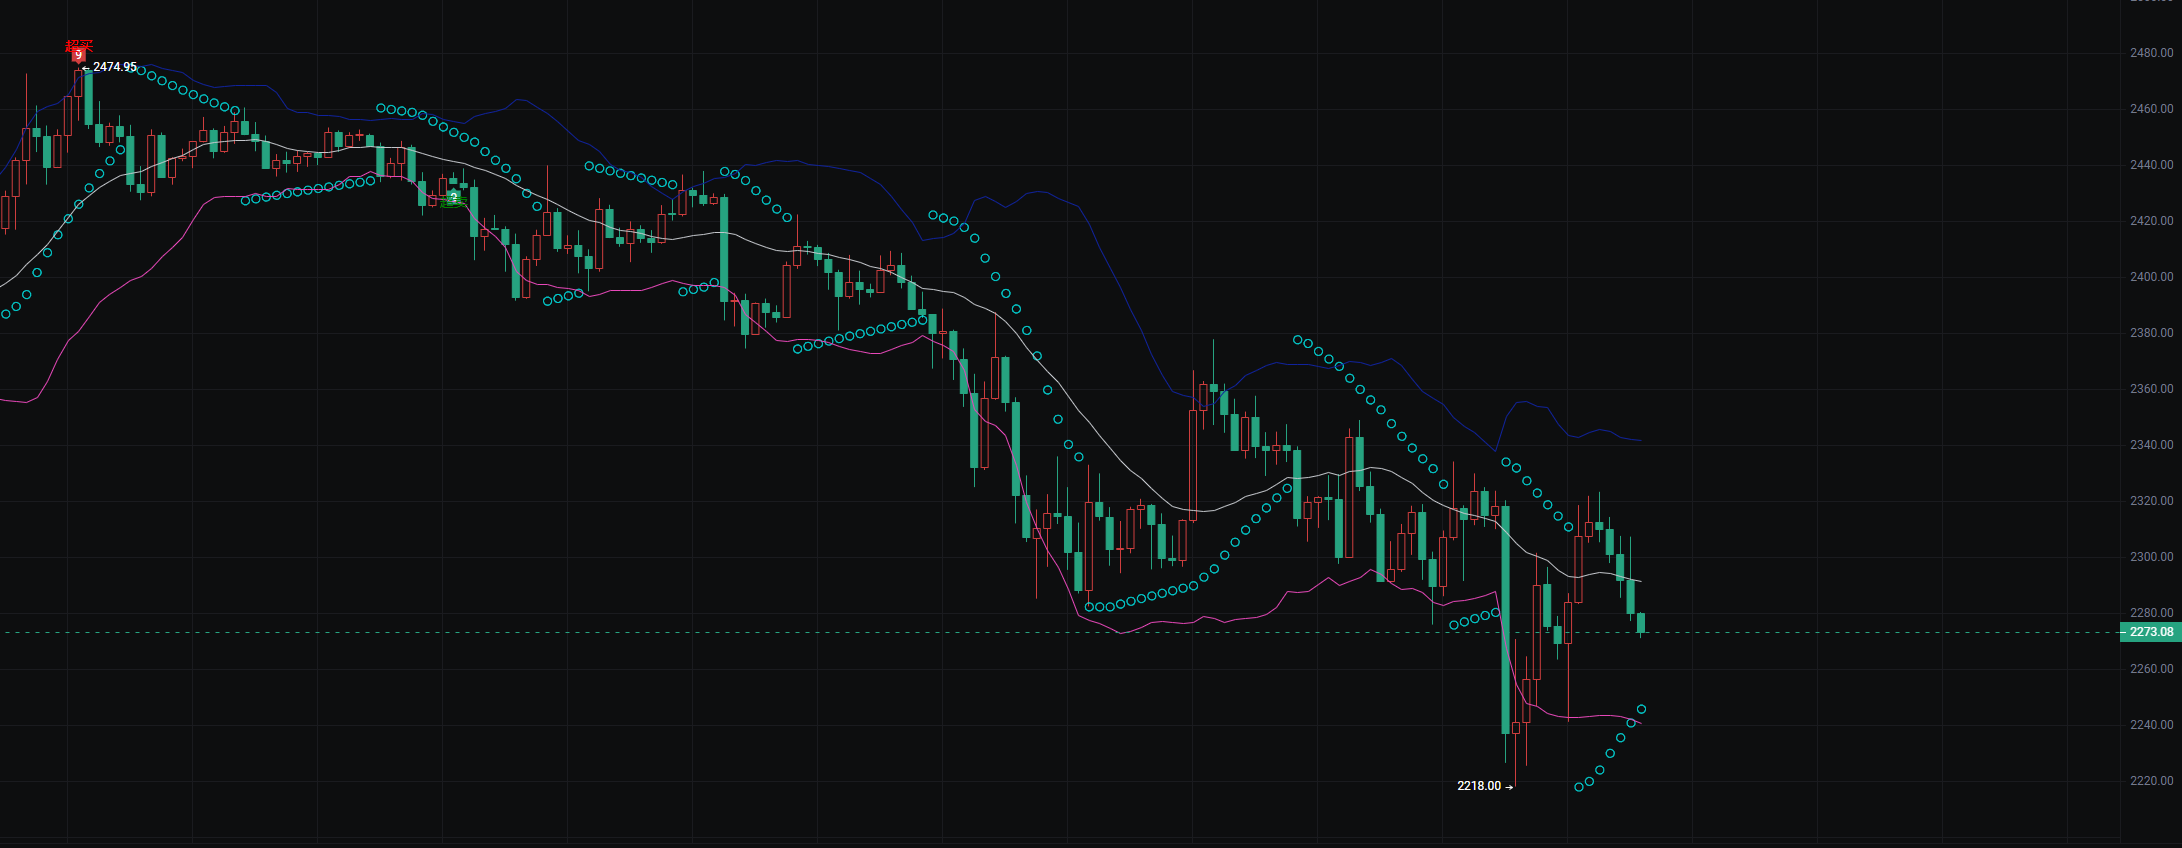
The price has been continuously retreating from the high of 2474.95, dipping to a low of 2218.00, and then showing a weak rebound.
2218.00 is the most important recent low; if it breaks below this level, it may open up further downside; if it holds, there is a chance to form a short-term bottom.
Moving Averages and Indicator Signals
The price is currently still operating below the white short-term moving average, which is turning downwards, indicating that short-term bullish momentum remains weak.
The pink moving average is also in a downward trend and is relatively far from the price, reflecting that medium-term downward pressure has not fully eased.
The blue channel indicator continues to open downwards; although it has slightly narrowed after the price hit the bottom, it remains in a bearish-dominated pattern.
The cyan dot indicator has been following the price down during the decline, and after the low of 2218.00, it has started to turn upwards, forming a brief bullish divergence with the price, which is a weak short-term bullish signal.
Current Bull-Bear Battle
Bears: The pressure from the previous high is clear, and the overall moving average system is downward, indicating that the medium-term trend has not reversed.
Bulls: The price has rebounded at 2218.00, and the indicator shows a bullish divergence, indicating that there are buying attempts at lower levels.
Short-term key levels: The current price is fluctuating around 2303.15, with resistance at the 2320-2340 range above and key support at the 2218.00 low below.
📈 Follow-up Strategy Reference
Bearish Outlook: If the price cannot break through the 2320 resistance level, the rebound may fail at any time; you can try a small short position relying on the 2320 resistance, with a stop-loss reference at 2330.
Risk Control: If the price breaks below the 2218.00 low, decisively exit and observe to avoid further downside risk; if it stabilizes above 2320, you can try a small long position, targeting 2340.
🎯 Key Price Level Operation Tips
2218.00 (Previous Low)
This is the most important support level; if it breaks, it confirms a bearish signal, and it is advisable to exit and observe; if it retests without breaking, you can try a small long position, with a stop-loss reference at 2210.
2280–2303.15
This is the lower edge of the current consolidation range; if the price stabilizes in this range, you can try a small long position, targeting 2320, with a stop-loss reference at 2270.
2303.15–2320
This is a short-term pressure zone; if it cannot effectively break through 2320, the rebound is likely to fail; you can try a small short position relying on the 2320 pressure, with a stop-loss reference at 2330.
2320–2340
This is a previous area of concentrated trading; if the price stabilizes above 2320, it indicates that bullish momentum is strengthening; you can increase long positions, targeting 2340, with a stop-loss reference at 2310.

(Note: 📣 Due to the limited timeliness and depth of information on public platforms, the market is ever-changing. Key turning points, precise operational strategies, and sudden risk alerts need to be synchronized in real-time on (public account - Bitcoin Bear). Here, you can receive: real-time strategy updates, in-depth analysis support, interactive Q&A, and risk warnings and optimization suggestions for personal holdings. 🚨 Remember: The market always rewards those who act faster and have more accurate information! Be a winner among the minority.)
免责声明:本文章仅代表作者个人观点,不代表本平台的立场和观点。本文章仅供信息分享,不构成对任何人的任何投资建议。用户与作者之间的任何争议,与本平台无关。如网页中刊载的文章或图片涉及侵权,请提供相关的权利证明和身份证明发送邮件到support@aicoin.com,本平台相关工作人员将会进行核查。