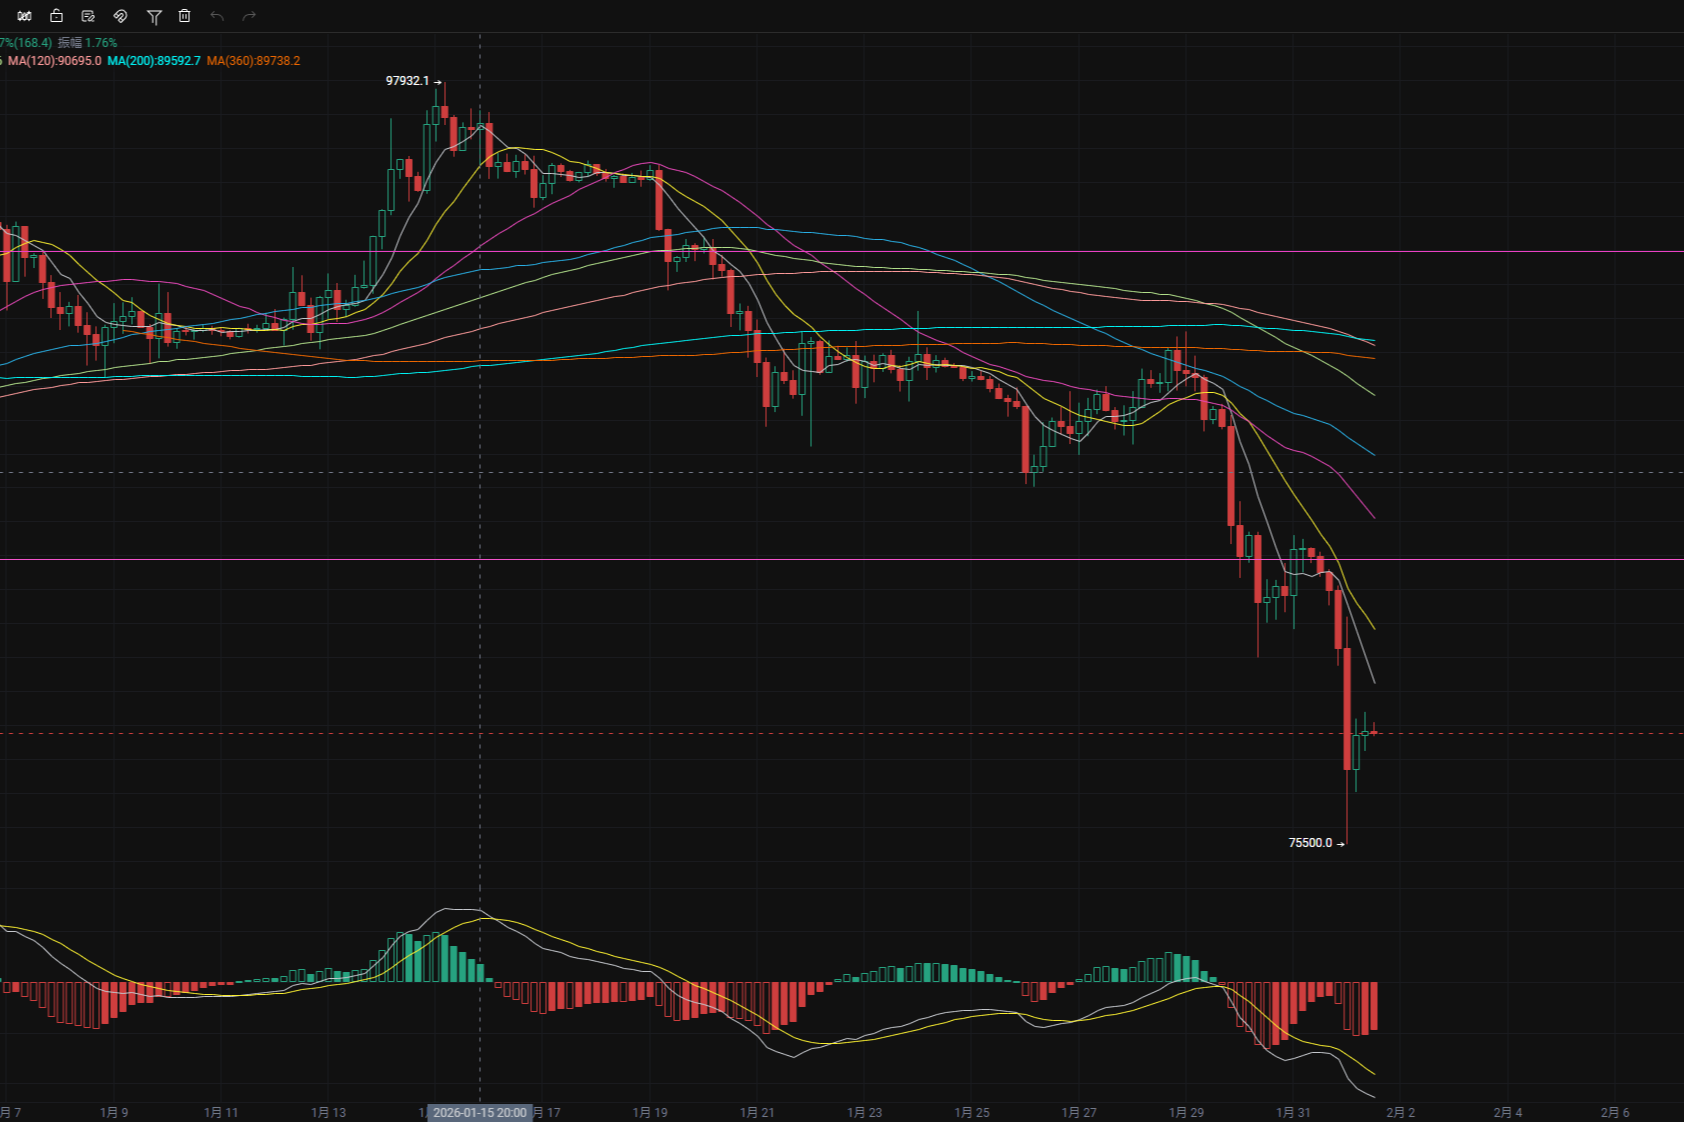
Bitcoin Market Analysis
1. Trend Analysis
Main Trend: This is a very clear breakdown trend. The price has been continuously declining from a high near 85000, with minor rebounds during the period, but overall the highs and lows are consistently decreasing.
Key Breakdown: The price first broke below the short-term moving averages (white and purple), and then directly broke through the support area below, reaching a low of 75658, which is a typical sharp decline with increased volume.
2. Key Signals
Moving Average System: The three moving averages (blue, white, purple) are all showing a downward turn, and the price is operating below all moving averages, indicating that the bullish strength in the short and medium term has been dominated by bears.
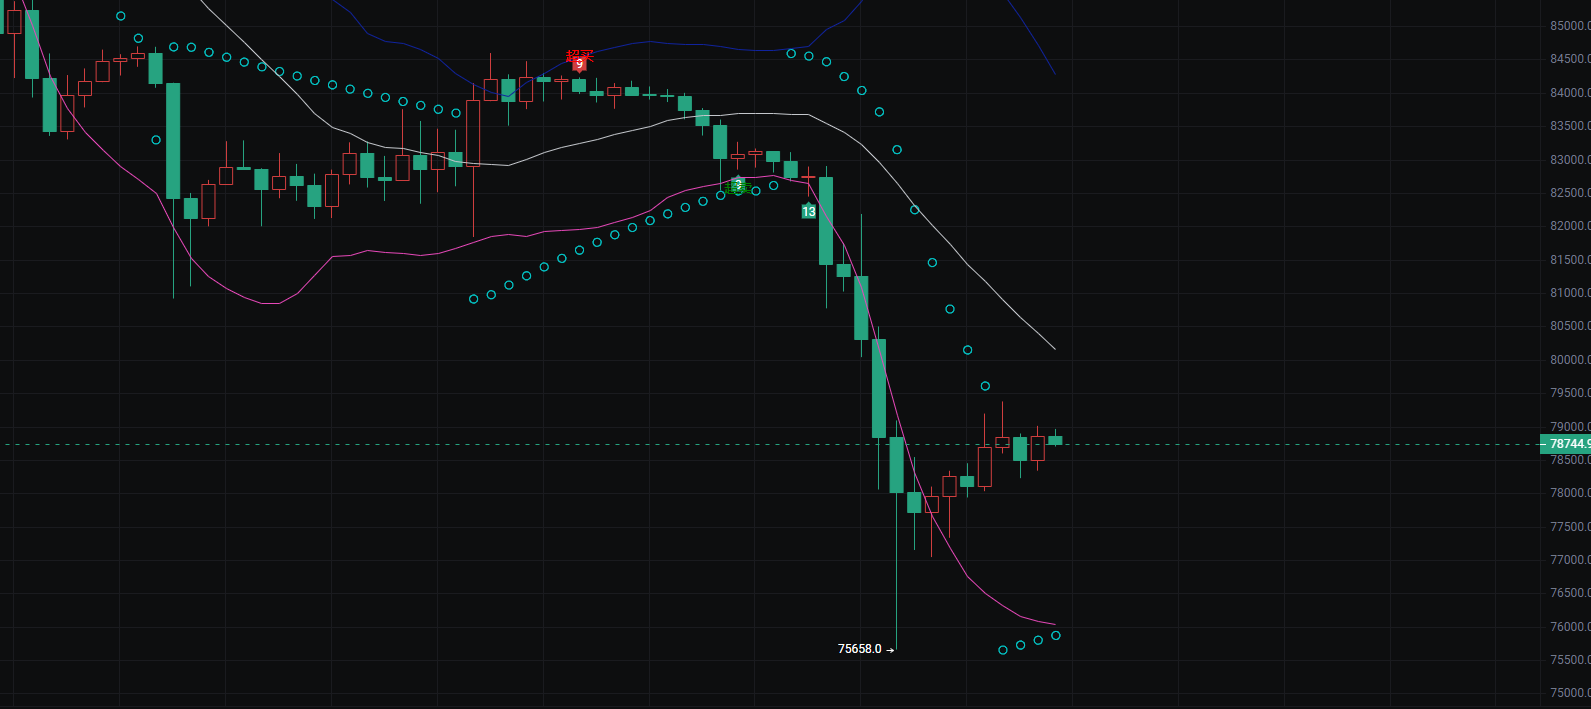
Support and Rebound: After reaching the low of 75658, the price showed a small bullish candle rebound, currently gaining temporary support around 78700. This is a technical correction after a sharp decline, but it cannot yet confirm a trend reversal.
Volume Characteristics: The decline is accompanied by long bearish candles, reflecting heavy selling pressure from bears; while the K-line entities during the rebound are relatively small, indicating that bullish strength is still relatively weak.
3. Subsequent Inference
Short-term Focus: Pay close attention to the support strength in the 78500-79000 range. If the price can stabilize and break above the short-term moving averages, a rebound may occur; however, if it breaks below the low of 75658 again, it is likely to open up new downward space.
Medium-term Strategy: Before the trend clearly reverses, it is recommended to adopt a wait-and-see approach or short on rallies. Only when the price re-establishes above all moving averages and shows clear bottoming signals (such as double bottoms, bullish engulfing, etc.) should one consider entering long positions.
Key Support Levels
First Support: 78500-78700 (current price range, a short-term battleground after the sharp decline)
Second Support: 75658 (recent low, if broken, it will open new downward space)
Extreme Support: 75000 (psychological support at a round number)
🎯 Key Resistance Levels
First Resistance: 79500-80000 (short-term moving average resistance, also a previous area of concentrated trading)
Second Resistance: 81000-81500 (lower edge of the previous platform, if broken, the rebound strength will increase)
Third Resistance: 83000-83500 (medium-term moving average pressure level, a key point for trend reversal)
📊 Moving Average Turning Point Observation
Purple Short-term Moving Average: Currently in a downward turn, if the price stands above this moving average and it flattens, it is a signal of short-term strength.
White Medium-term Moving Average: Continues to exert downward pressure, need to pay attention to whether its slope slows down.
Blue Long-term Moving Average: Still trending down from a high position, indicating that the medium-term trend has not yet reversed.
Ethereum Market Analysis
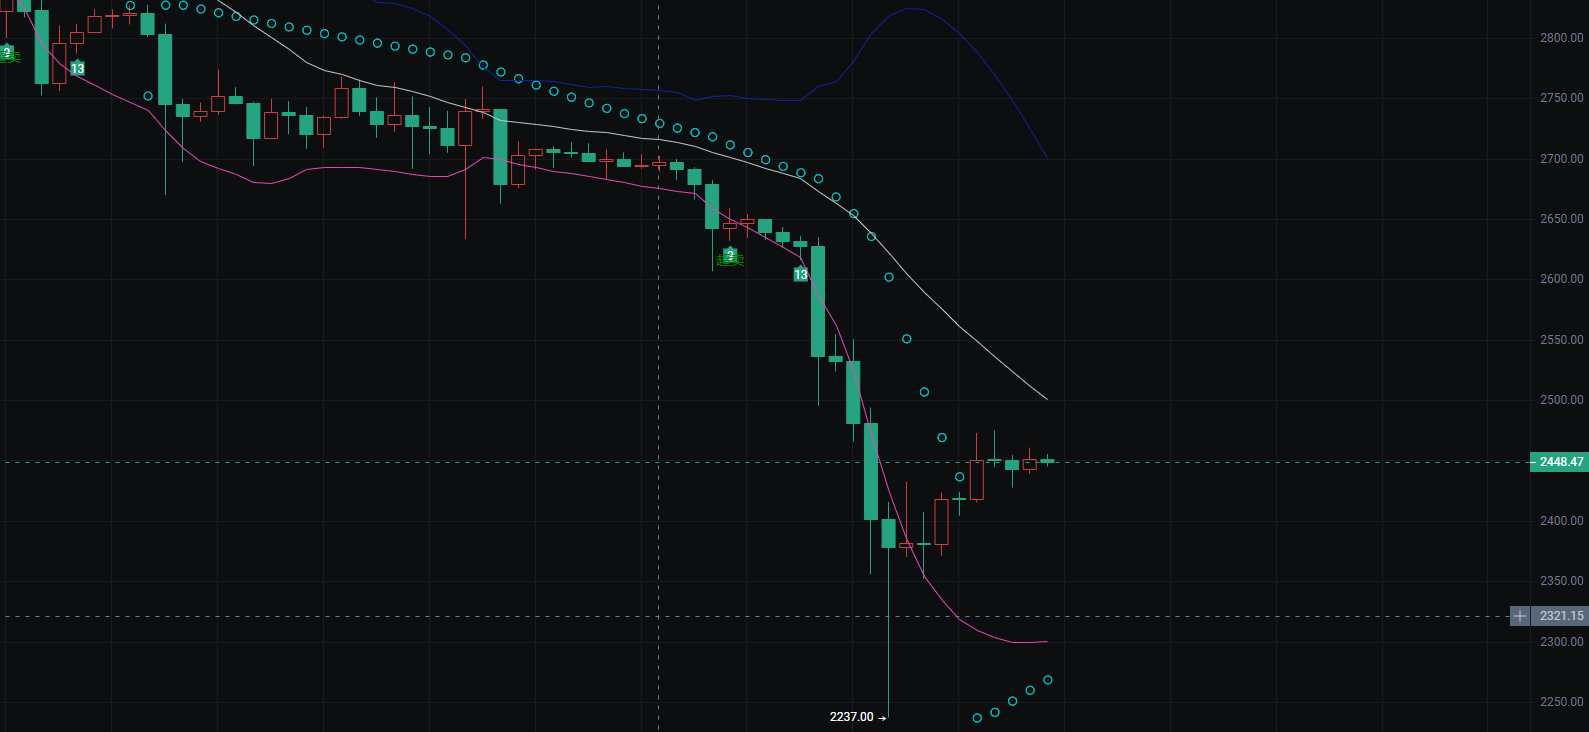
1. Trend Judgment
This is a stabilizing rebound trend after a one-sided sharp decline. The price has been declining from a high near 28500, reaching a low of 22370, followed by a series of small bullish candles, currently oscillating around 24450.
2. Key Signal Analysis
Moving Average Status: The purple short-term moving average is still turning down, but its slope has clearly slowed; the white medium-term moving average and blue long-term moving average continue to exert downward pressure, indicating that the medium-term trend has not yet reversed.
Support and Resistance:
Support Level: 24000 (the lower edge of the current oscillation range, also the first important support after the sharp decline), 22370 (recent low, if broken, will confirm a second bottom)
Resistance Level: 25000 (round number + short-term moving average resistance), 26000 (lower edge of the previous platform, key for whether the rebound can continue)
Volume and Patterns: The decline is accompanied by long bearish candles, indicating sufficient release of selling pressure; during the rebound phase, the K-line entities are relatively small and mostly bullish, indicating a technical correction, with bullish strength still accumulating.
3. Subsequent Inference
Short-term Trend: If the price can stabilize at 24000 and break above 25000, the rebound is expected to extend to around 26000; if it breaks below 24000, it may retest the low of 22370 to confirm support.
Medium-term Strategy: Before the price effectively stands above 25000, it is recommended to take light positions or wait and see; if it breaks above 25000 and stabilizes, positions can be gradually increased, while setting stop-loss below 22370 to control risk.
🎯 Key Support Levels
First Support: 24000-24200 (the lower edge of the current oscillation range, the core position for short-term bulls and bears)
Second Support: 22370 (recent low, if broken, will confirm a second bottom, opening new downward space)
Extreme Support: 22000 (round number, psychological support)
🎯 Key Resistance Levels
First Resistance: 24800-25000 (short-term moving average resistance, also a round number)
Second Resistance: 25800-26000 (lower edge of the previous platform, key for whether the rebound can continue)
Third Resistance: 27000-27200 (medium-term moving average pressure level, an important sign of trend reversal)
📊 Moving Average Turning Point Observation
Purple Short-term Moving Average: Currently turning down but with a slowing slope, if the price stands above this moving average and it flattens, it is a signal of short-term strength.
White Medium-term Moving Average: Continues to exert downward pressure, need to pay attention to whether its slope changes from steep to gentle.
Blue Long-term Moving Average: Still trending down from a high position, indicating that the medium-term bearish trend has not yet reversed.

(Note: 📣 Due to the limited timeliness and depth of information on public platforms, the market is ever-changing. Key turning points, precise operational strategies, and sudden risk alerts need to be synchronized in real-time on (public account - Bitcoin Bear). Here, you can obtain: real-time strategy push, in-depth analysis support, interactive Q&A, risk warnings, and optimization suggestions for personal positions. 🚨 Remember: the market always rewards those who act faster and have more accurate information! Be a winner among the minority.)
免责声明:本文章仅代表作者个人观点,不代表本平台的立场和观点。本文章仅供信息分享,不构成对任何人的任何投资建议。用户与作者之间的任何争议,与本平台无关。如网页中刊载的文章或图片涉及侵权,请提供相关的权利证明和身份证明发送邮件到support@aicoin.com,本平台相关工作人员将会进行核查。