Author: SixSigmaCapital
Compiled by: Yuliya, PANews
This article aims to summarize a buying process at the bottom of stock prices, detailing lessons learned in practice and establishing a sustainable framework for identification and execution. It is recommended that investors combine this strategy with other investment philosophies for a more comprehensive understanding of the market.
Initial Analysis and Catalyst Tracking
When a stock that an investor is interested in begins to decline, it should be closely monitored. Identify any upcoming catalysts, whether positive or negative. If there are no clear catalysts, this often means investors have more time for analysis.
At this point, the key is to determine the reason for the stock price decline: is it a company-specific issue or a broader industry dilemma? Is the price drop justified, or is the market overreacting? Is this a temporary issue, or is it a fundamental problem that will fundamentally change the original investment logic? If the reason for the decline does not break the initial investment logic, then one can proceed to the next steps for a deeper consideration of this investment opportunity.
Fundamental Due Diligence
It is essential to complete fundamental research as early as possible. The classic "4M framework" is an effective tool that includes four dimensions:
Business Model (Meaning): What specific business does the company engage in.
Moat: What competitive advantages does the company possess.
Management: How capable and principled is the management team.
Margin of Safety: Does the current stock price provide sufficient margin of safety.
Investors are advised to carefully review the company's financial reports and familiarize themselves with its three main financial statements (income statement, balance sheet, cash flow statement). Additionally, attention should be paid to earnings call conferences. If using a DCF (Discounted Cash Flow) model for valuation, it is crucial to use conservative estimates to determine the intrinsic value of the stock. This ensures that when the timing is right, investors clearly know they are buying at a significant discount.
Combining Technical Analysis
Do not attempt to catch the bottom too early; patience is key. Ideally, investors should aim to be among the last to catch the bottom. This is crucial as it allows time to study previous price movements and wait for selling pressure to gradually diminish. It is recommended to study charts across multiple time frames, with daily and weekly charts being good starting points.
Here are several technical analysis methods that can be used individually or in combination:
Buy on the right side of a "V-shaped reversal"
Wait for the 5-day EMA (Exponential Moving Average) to cross above the 20-day EMA
Buy at long-term support levels
Wait for the stock price to establish a bottom at least 5% above the 52-week low before making a tentative buy
Buy during a "waterfall decline" (this method carries higher risk)
Below are some case studies to illustrate the application of these methods.
1. Buy on the Right Side of a V-Shaped Reversal
This is a relatively simple strategy: first, determine an ideal price you are willing to pay, then patiently wait for the stock to stop declining. When the stock price rebounds back to that level, you can execute the trade. This is a higher probability entry method and allows you to set a stop loss at a recent low to protect your position.

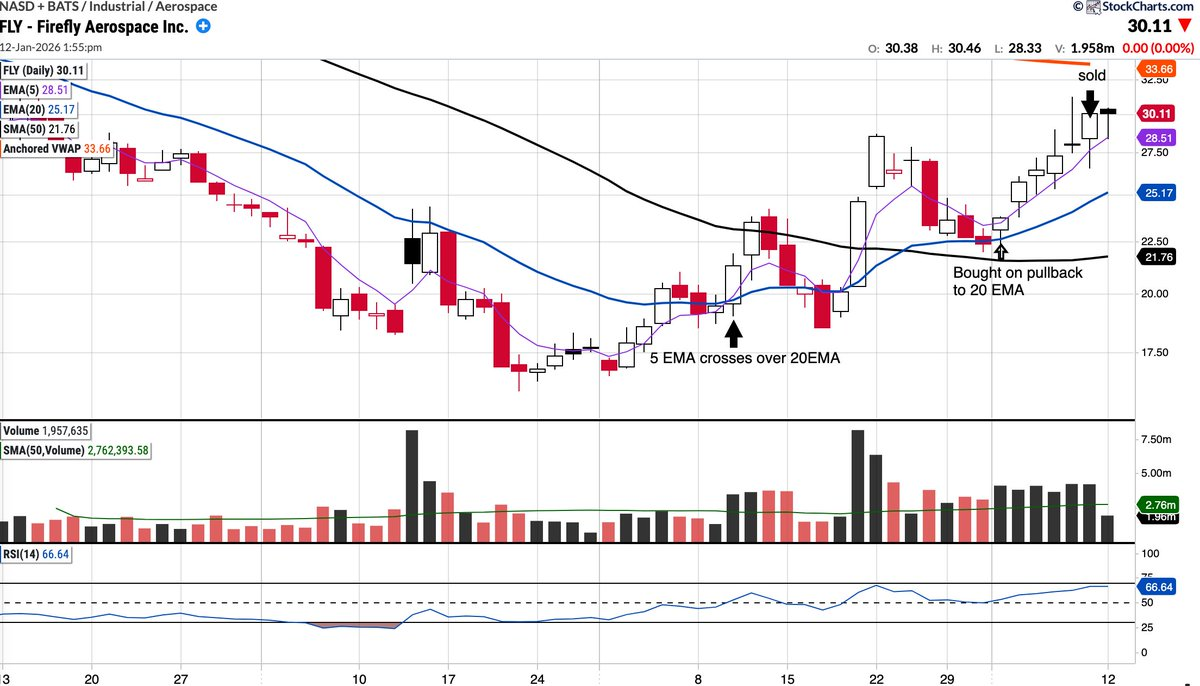
2. Exponential Moving Average Cross
Waiting for the 5-period EMA to cross above the 20-period EMA is a straightforward strategy. The core idea is to wait for a potential trend reversal confirmation signal before committing any funds.
Taking the recent FLY trade as an example. The stock had once attracted investor attention, but the entry was made only after waiting for the 5-day EMA to cross and hold above the 20-day EMA, entering when the stock price retested the 20-day EMA. This trade ultimately proved successful, yielding a return of 35% to 36% within about six trading days.
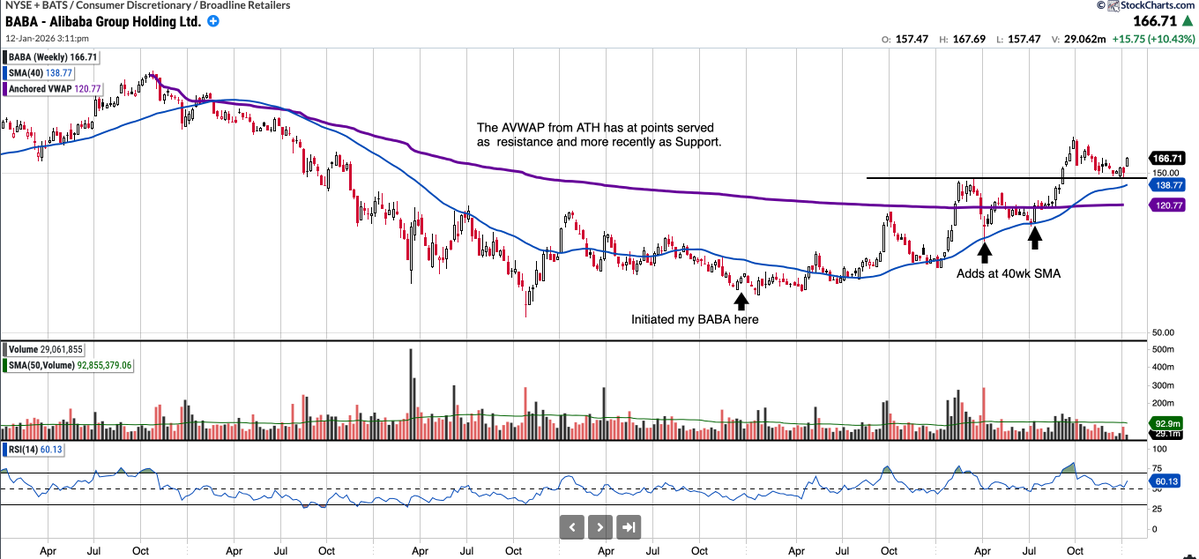
3. Bottom Formation
Waiting for a stock to stabilize above its 52-week low and begin forming a bottom (for example, at least 5% above the low) is another recommended strategy. The reason is simple: investors need to see evidence that the stock price is likely to hold the previous low and that a trend change may be occurring.
Looking back at 2023, BABA is a great example. Although the stock had bottomed at $55 per share the previous year, some investors chose to enter in December 2023 when the stock price was between $68 and $70. At that time, the stock was forming a bottom, and there was a significant misalignment between price and value, with a price-to-earnings ratio of only 7 times. Later, when the stock price retested the 40-week SMA (Simple Moving Average), that investor added to their position and still holds those shares today.
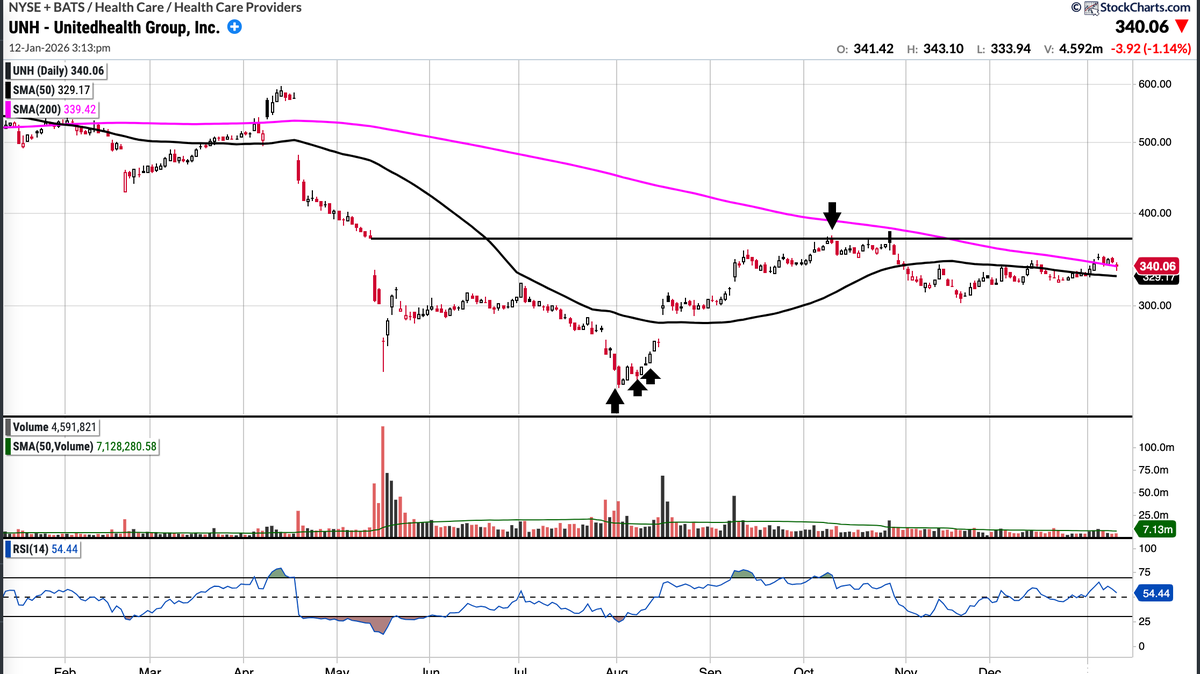
4. Waterfall Decline
UNH is a case of trading during a "waterfall decline." This is a higher-risk setup, but risk can be managed by combining "delayed buying" (waiting for sellers to reduce) and the principle of adding to positions on the right side of a "V-shaped reversal."
When UNH's stock price first declined in mid-May, it entered investors' watchlists but was not immediately bought. The massive selling volume at that time was enough to deter buying. However, after completing fundamental analysis, $240 was marked as a buy level worth considering from a valuation perspective. When the stock price began to drop rapidly in August, buying commenced. As the stock price started to recover, purchases were made in batches within the range of just over $230 to just over $240. Ultimately, the position was closed after the gap was filled in mid-October.
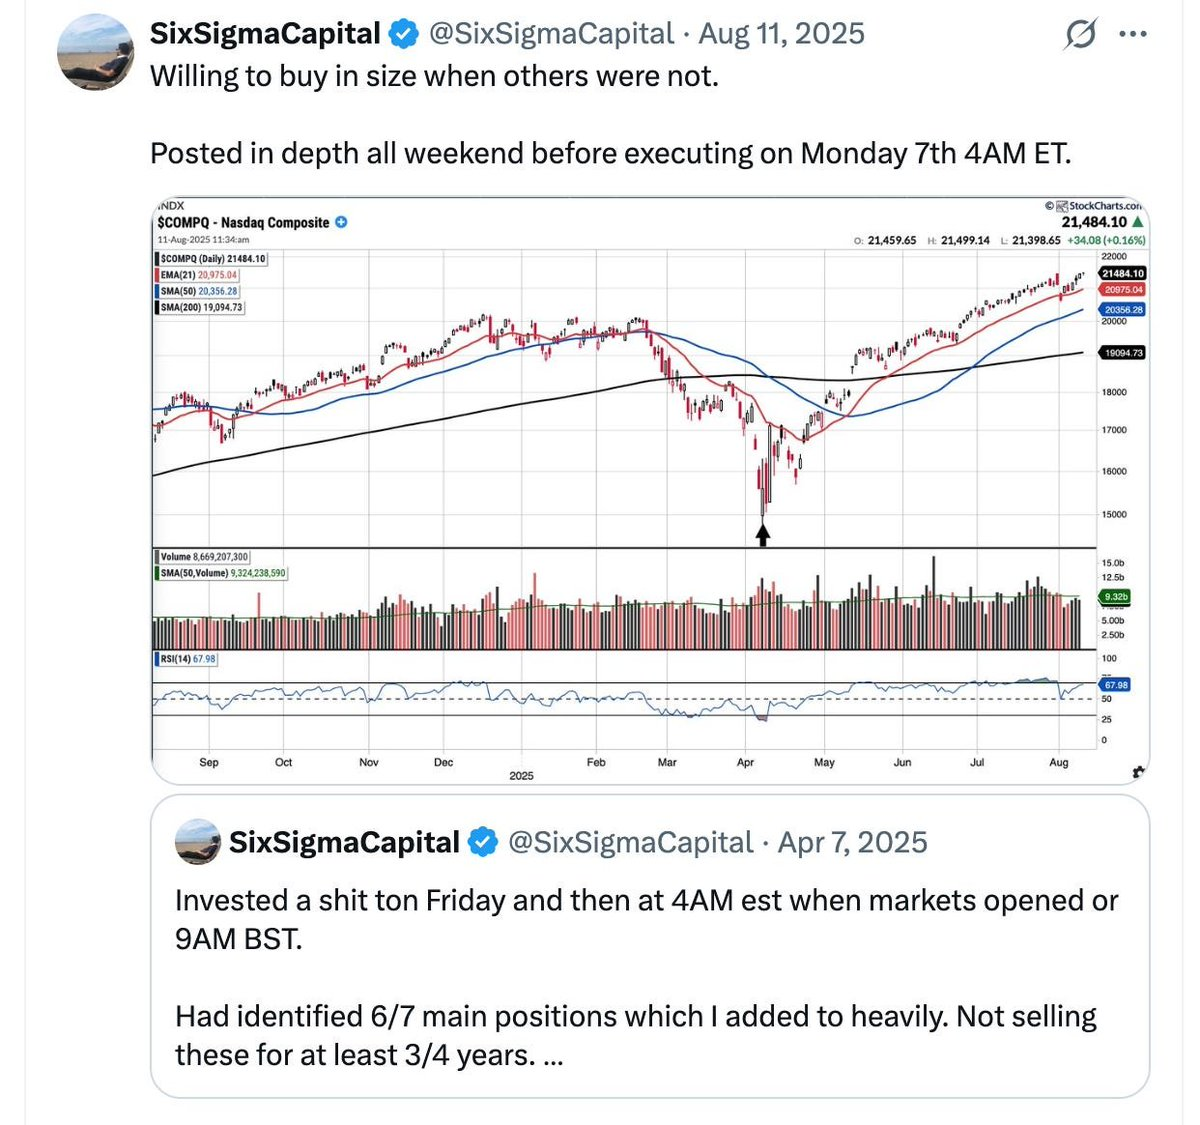
Another buying case during a waterfall decline successfully captured the bottom on April 7, 2025. In-depth analysis was conducted throughout the weekend before executing the trade at 4 AM (Eastern Time) that Monday.
Sentiment Analysis
Tracking market sentiment is another important piece of the decision-making puzzle. While it is not an exact science, there are several specific methods to incorporate it into the analysis process.
As mentioned earlier, it is not advisable to buy when the general public is bottom-fishing. Instead, one should look for entry points when early buyers have become frustrated and ultimately give up. An important signal is when extremely pessimistic target prices begin circulating in the market, or when investors who are "all in" on a single stock sell their positions out of despair. Typical examples include Tesla's crash when its stock price fell to $150 in April 2024, and the widespread belief at that time that Google was "doomed to fail" in the field of artificial intelligence.
Additionally, waiting for analysts to lower their expectations and target prices is also an effective strategy. This process typically reduces risk; once market expectations are lowered, the company only needs to achieve a small positive surprise to elicit a favorable stock price reaction.
Finally, if you have a certain following on social media, you can leverage them to gauge current market sentiment. For example, you could post a question on social media to test market sentiment, such as, "I bought UNH at $237, am I losing big?" If the post receives unusually high engagement and the majority of responses are bearish, with some even calling for prices below $100, this extreme pessimism can be seen as a good contrarian indicator.
免责声明:本文章仅代表作者个人观点,不代表本平台的立场和观点。本文章仅供信息分享,不构成对任何人的任何投资建议。用户与作者之间的任何争议,与本平台无关。如网页中刊载的文章或图片涉及侵权,请提供相关的权利证明和身份证明发送邮件到support@aicoin.com,本平台相关工作人员将会进行核查。


