Original Title: Cathie Wood's 2026 Outlook: The US Economy Is A Coiled Spring
Original Author: Cathie Wood, Founder of ARK Invest
Original Translation: Zhao Ying, Wall Street Insights
ARK Invest founder Cathie Wood ("Wood" sister) released her macro outlook in the latest 2026 New Year letter to investors, comparing the next three years to "Reaganomics on steroids." She pointed out that with deregulation, tax cuts, sound monetary policy, and the integration of innovative technologies, the US stock market is set to enter another "golden age," while the impending surge of the dollar may put an end to the upward momentum of gold prices.
Specifically, Cathie Wood believes that despite continuous growth in real GDP over the past three years, the underlying US economy has actually experienced a rolling recession and is currently in a "coiled spring" state, poised for a strong rebound in the coming years. She emphasized that with David Sacks taking on the role of the first AI and cryptocurrency czar to lead deregulation, along with the effective corporate tax rate moving towards 10%, the US economic growth will gain significant policy dividends.
On a macro level, Wood predicts that inflation will be further controlled, potentially turning negative, driven by a productivity boom. She expects that the nominal GDP growth rate in the US will remain in the range of 6% to 8% over the next few years, primarily driven by productivity improvements rather than inflation.
In terms of market impact, Wood predicts that the relative advantage of US investment returns will drive the dollar exchange rate significantly higher, reminiscent of the 1980s when the dollar nearly doubled. She warns that although gold prices have risen significantly in recent years, the strengthening dollar will suppress gold prices, while Bitcoin, due to its supply mechanism and low asset correlation, will exhibit a different trend from gold.
Regarding the market valuation issue that investors are concerned about, Wood does not believe that an AI bubble has formed. She points out that although the current price-to-earnings ratio is at a historical high, the explosion of corporate earnings driven by technologies like AI and robotics will absorb the high valuations, and the market may achieve positive returns while compressing price-to-earnings ratios, similar to the bull market path of the mid-1990s.
Here is the original letter to investors:
Happy New Year to ARK's investors and other supporters! We greatly appreciate your support.
As I outline in this letter, we truly believe that investors have many reasons to remain optimistic! I hope you enjoy our discussion. From an economic history perspective, we are at a significant moment.
Coiled Spring
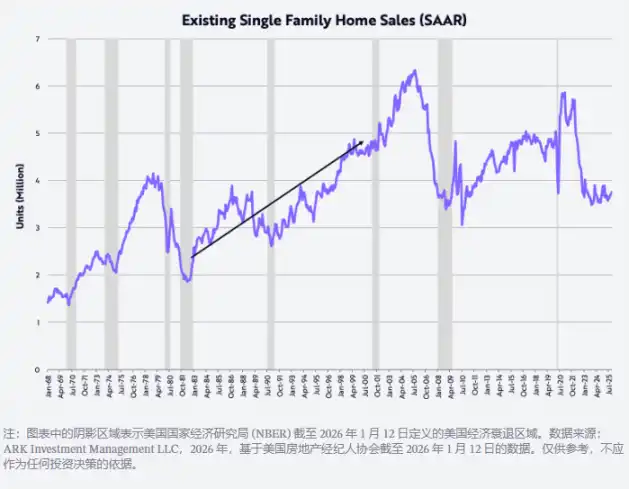
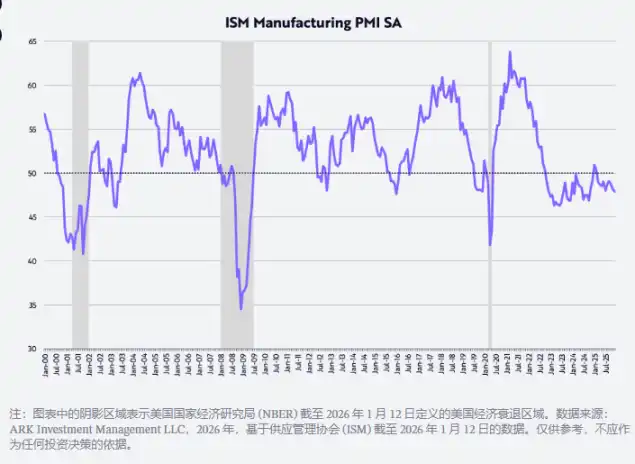
Despite continuous growth in the US real GDP over the past three years, the underlying structure of the US economy has experienced a rolling recession, gradually evolving into a spring that is compressed to the extreme, which may rebound strongly in the coming years. In response to supply shocks related to the COVID-19 pandemic, the Federal Reserve raised the federal funds rate from 0.25% in March 2022 to 5.5% in 16 months ending in July 2023, marking a record increase of 22 times. This rate hike has pushed housing, manufacturing, non-AI-related capital expenditures, and the middle and lower-income groups in the US into recession, as shown in the following chart.
Measured by the sales volume of existing homes, the housing market has dropped 40% from an annualized level of 5.9 million units in January 2021 to 3.5 million units in October 2023. This level was last seen in November 2010, and over the past two years, sales of existing homes have fluctuated around this level. This indicates how tightly the spring is compressed: the current sales level of existing homes is comparable to the early 1980s, when the US population was about 35% smaller than it is now.
Measured by the US Purchasing Managers' Index (PMI), manufacturing has been in a contraction state for about three years. According to this diffusion index, 50 is the dividing line between expansion and contraction, as shown in the following chart.
Meanwhile, capital expenditures measured by non-defense capital goods (excluding aircraft) peaked in mid-2022, and since then, the expenditure level has returned to that peak regardless of technological impacts. In fact, this capital expenditure indicator has struggled for over 20 years to break through since the tech and telecom bubble burst, until 2021, when supply shocks related to COVID-19 forced both digital and physical investments to accelerate. The previous spending ceiling seems to have transformed into a spending floor, as AI, robotics, energy storage, blockchain technology, and multi-omics sequencing platforms are ready to usher in a golden age. Following the tech and telecom bubble of the 1990s, the peak of about $70 billion in spending lasted for 20 years, and now, as illustrated in the following chart, this may be the strongest capital expenditure cycle in history. We believe that the emergence of an AI bubble is still a long way off!

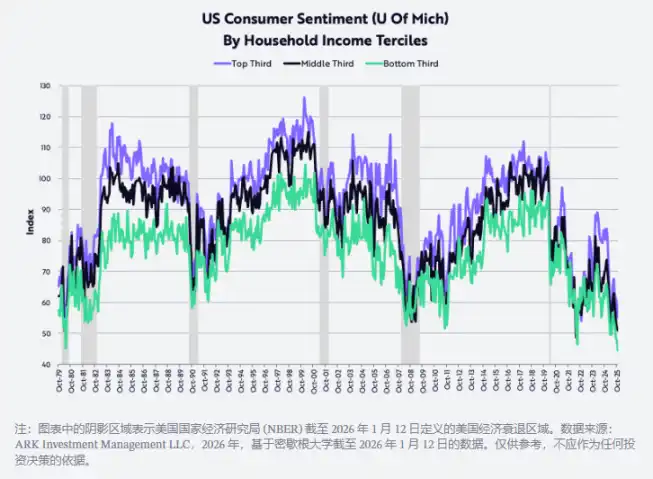
At the same time, data from the University of Michigan shows that confidence among middle and lower-income groups has fallen to its lowest point since the early 1980s. At that time, double-digit inflation and high interest rates severely weakened purchasing power and pushed the US economy into consecutive recessions. Additionally, as shown in the following chart, confidence among high-income groups has also declined in recent months. In our view, consumer confidence is currently one of the most tightly compressed "springs" with the greatest rebound potential.
Deregulation, While Reducing Taxes, Inflation, and Interest Rates
Thanks to the combination of deregulation, tax cuts (including tariffs), inflation, and interest rates, the rolling recession experienced by the US in recent years may rapidly and dramatically reverse in the coming year and beyond.
Deregulation is unleashing innovative vitality across various fields, particularly in AI and digital assets, led by the first "AI and cryptocurrency czar" David Sacks. Meanwhile, reductions in tips, overtime pay, and social security taxes will bring substantial tax refunds to US consumers this quarter, potentially boosting the annualized growth rate of real disposable income from about 2% in the second half of 2025 to about 8.3% this quarter. Additionally, as manufacturing facilities, equipment, software, and domestic R&D expenditures enjoy accelerated depreciation, the effective corporate tax rate will be lowered to nearly 10% (as shown in the following chart), and the scale of corporate tax refunds is expected to rise significantly, with 10% being one of the lowest tax rates globally.
For example, any company that begins construction of a manufacturing plant in the US before the end of 2028 can achieve full depreciation in the first year of the building's operation, rather than spreading it over 30 to 40 years as in the past. Equipment, software, and domestic R&D expenditures can also achieve 100% depreciation in the first year. This cash flow incentive policy has been permanently established in last year's budget and is retroactively applicable from January 1, 2025.

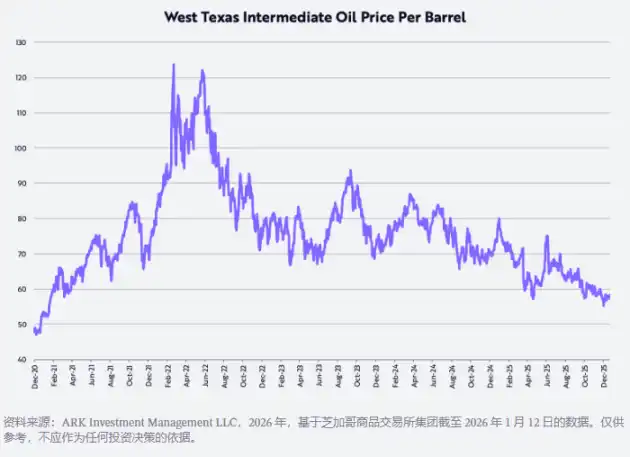
In recent years, inflation measured by the Consumer Price Index (CPI) has stubbornly hovered in the range of 2% to 3%, but in the coming years, for several reasons shown in the following chart, the inflation rate is likely to drop to an unexpectedly low level—potentially even negative. First, the price of West Texas Intermediate (WTI) crude oil has fallen about 53% from its post-COVID peak of around $124 per barrel on March 8, 2022, and is currently down about 22% year-on-year.
Since peaking in October 2022, the sales prices of newly built single-family homes have decreased by about 15%; meanwhile, the price inflation rate of existing single-family homes—based on a three-month moving average—has dropped from about 24% year-on-year at the peak after COVID-19 in June 2021 to about 1.3%, as shown in the following chart.

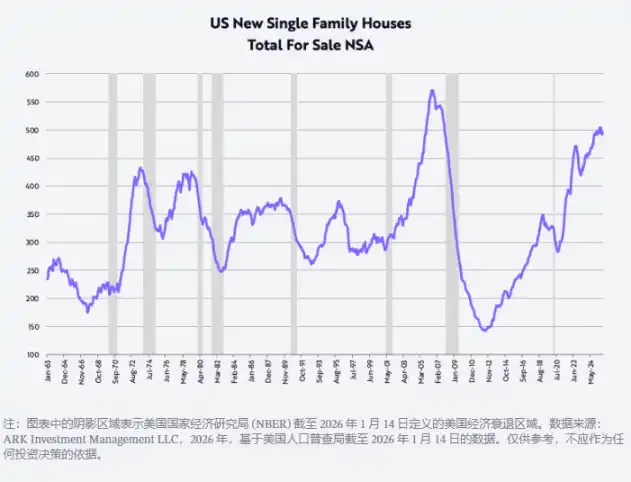
In the fourth quarter, to digest nearly 500,000 units of new single-family home inventory (as shown in the following chart, the highest level since just before the global financial crisis in October 2007), the three major home builders significantly lowered their prices, with year-on-year declines of: Lennar -10%, KB Homes -7%, and DR Horton -3%. The impact of these price declines will be reflected in the Consumer Price Index (CPI) with a lag over the next few years.
Finally, one of the most powerful forces in curbing inflation, non-farm productivity, has grown against the backdrop of a sustained recession, increasing by 1.9% year-on-year in the third quarter. In stark contrast to the 3.2% growth in hourly compensation, the increase in productivity has reduced the unit labor cost inflation rate to 1.2%, as shown below. This figure does not exhibit the cost-push inflation seen in the 1970s!

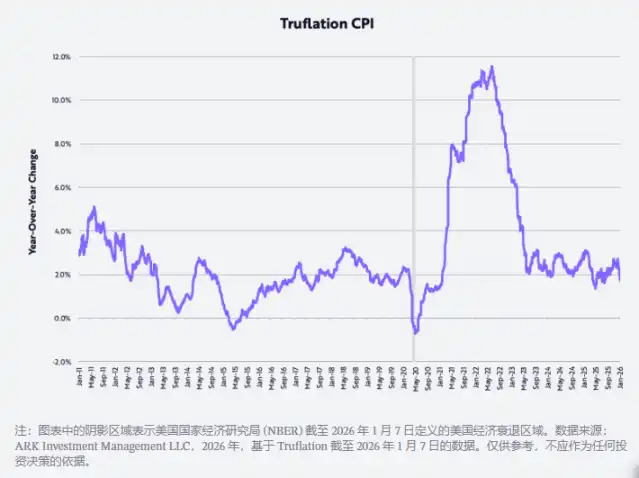
This improvement has also been validated: according to Truflation, the inflation rate has recently dropped to 1.7% year-on-year, as shown in the following chart, nearly 100 basis points (bps) lower than the inflation rate calculated by the US Bureau of Labor Statistics (BLS) based on CPI.
Productivity Boom
In fact, if our research on technology-driven disruptive innovation is correct, then in the coming years, influenced by cyclical and long-term factors, non-farm productivity growth should accelerate to 4-6% per year, further reducing inflation in unit labor costs. The integration of major innovation platforms currently under development—artificial intelligence, robotics, energy storage, public blockchain technology, and multi-omics technology—not only holds the promise of driving productivity growth to sustainable new highs but also has the potential to create significant wealth.
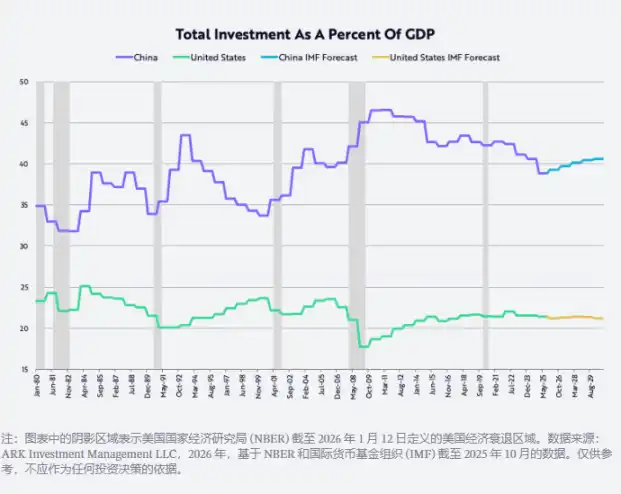
The increase in productivity may also correct significant geopolitical imbalances in the global economy. Companies can direct the gains from productivity improvements towards one or more of the following four strategic directions: expanding profit margins, increasing R&D and other investments, raising wages, and/or lowering prices. In China, raising wages for higher productivity employees and/or increasing profit margins can help the economy escape the structural issues of over-investment. Since joining the World Trade Organization (WTO) in 2001, China's investment as a percentage of GDP has averaged about 40%, nearly double that of the US, as shown in the following chart. Increasing wages will drive the Chinese economy towards a consumption-oriented transformation, breaking free from a commoditized path.
However, in the short term, technology-driven productivity gains may continue to slow US job growth, causing the unemployment rate to rise from 4.4% to above 5.0%, prompting the Federal Reserve to continue lowering interest rates. Subsequently, deregulation and other fiscal stimulus measures should amplify the effects of low interest rates and accelerate GDP growth in the second half of 2026. Meanwhile, inflation may continue to slow, not only due to declines in oil prices, housing prices, and tariffs but also thanks to technological advancements that drive productivity increases and lower unit labor costs.
Surprisingly, the cost of training artificial intelligence is decreasing by 75% annually, while the cost of AI inference (i.e., the cost of running AI application models) is decreasing by as much as 99% per year (according to some benchmark data). The unprecedented decline in various technology costs should drive a surge in their unit growth. Therefore, we expect that the nominal GDP growth rate in the US will remain in the range of 6% to 8% in the coming years, primarily driven by productivity growth of 5% to 7%, labor growth of 1%, and an inflation rate of -2% to +1%.
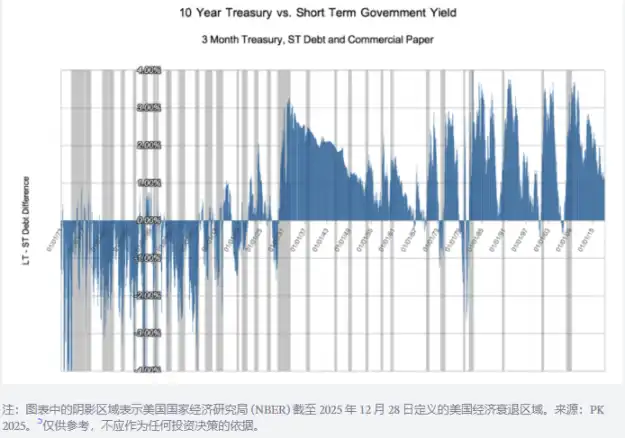
The deflationary effects brought about by artificial intelligence and the other four major innovation platforms will continue to accumulate, shaping an economic environment similar to the last major technological revolution triggered by the internal combustion engine, electricity, and the telephone over the 50 years leading up to 1929. During that period, short-term interest rates synchronized with nominal GDP growth rates, while long-term interest rates responded to the deflationary undercurrents accompanying technological booms, causing the yield curve to average an inversion of about 100 basis points, as shown in the following chart.
Other New Year Thoughts
Gold Price Increase and Bitcoin Price Decrease
During 2025, the price of gold increased by 65%, while the price of Bitcoin decreased by 6%. Many observers attribute the surge in gold prices from $1,600 per ounce to $4,300 per ounce, a 166% increase since the end of the US stock market bear market in October 2022, to inflation risks. However, another explanation is that global wealth growth (evidenced by a 93% increase in the MSCI Global Stock Index) has outpaced the annual growth rate of global gold supply of about 1.8%. In other words, the incremental demand for gold may have exceeded its supply growth. Interestingly, during the same period, the price of Bitcoin rose by 360%, while its supply growth rate was only about 1.3%. Notably, the responses of gold and Bitcoin miners to these price signals may be drastically different: gold miners will respond by increasing gold production, while Bitcoin cannot do so. Mathematically, Bitcoin is expected to grow by about 0.82% annually over the next two years, after which its growth rate will slow to about 0.41% per year.
Long-Term Perspective on Gold Prices
Measured by the ratio of market capitalization to M2 money supply, gold prices have only exceeded this level once in the past 125 years, during the early 1930s Great Depression. At that time, the gold price was fixed at $20.67 per ounce, while the M2 money supply plummeted by about 30% (as shown in the following chart). Recently, the ratio of gold to M2 has surpassed its previous peak, which occurred in 1980 when inflation and interest rates soared to double digits. In other words, from a historical perspective, gold prices have reached extremely high levels.
The long-term decline of this ratio is also closely related to robust returns in the stock market. According to research by Ibbotson and Sinquefield, the compound annual return of stocks has been about 10% since 1926. After this ratio reached two major long-term peaks in 1934 and 1980, stock prices measured by the Dow Jones Industrial Average (DJIA) achieved returns of 670% and 1015% over the 35 years and 21 years ending in 1969 and 2001, respectively, with annualized returns of 6% and 12%. Notably, small-cap stocks had annualized returns of 12% and 13%, respectively.

For asset allocators, another important consideration is the relatively low correlation of Bitcoin returns to gold returns and to returns of other major asset classes since 2020, as shown in the following table. Notably, the correlation between Bitcoin and gold is even lower than the correlation between the S&P 500 Index and bonds. In other words, for asset allocators seeking higher risk-adjusted returns in the coming years, Bitcoin should be a good diversification investment choice.

Dollar Outlook
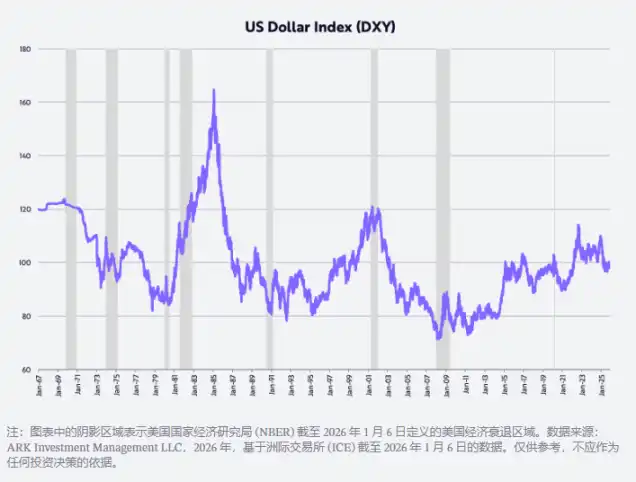
In recent years, a popular saying has been the end of American exceptionalism, with the dollar experiencing its largest decline in the first half of the year since 1973 and its largest annual decline since 2017. Last year, measured by the trade-weighted dollar index (DXY), the dollar fell 11% in the first half and 9% for the entire year. If our predictions about fiscal policy, monetary policy, deregulation, and US-led technological breakthroughs are correct, then US investment returns will improve relative to other parts of the world, thereby pushing up the dollar exchange rate. The policies of the Trump administration are reminiscent of the situation during the early 1980s Reaganomics, when the dollar exchange rate nearly doubled, as shown in the following chart.
AI Hype
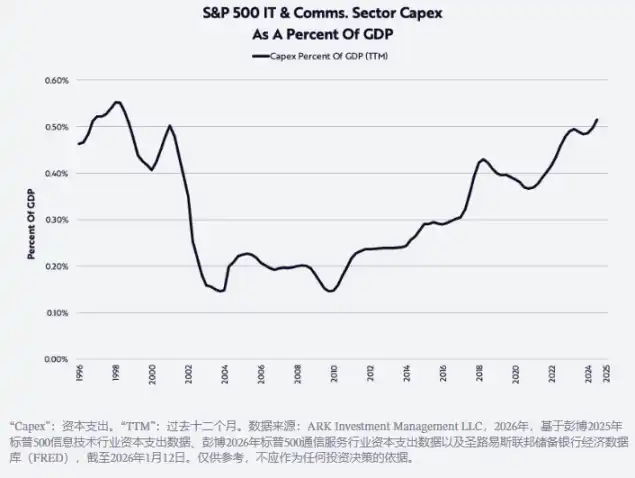
As shown below, the booming development of artificial intelligence is driving capital expenditures to their highest levels since the late 1990s. In 2025, investments in data center systems (including computing, networking, and storage devices) grew by 47% to nearly $500 billion, and are expected to grow another 20% in 2026 to about $600 billion, far exceeding the long-term trend of $150 billion to $200 billion per year in the decade prior to the launch of ChatGPT. Such a massive scale of investment raises the question: "What is the return on this investment? And where will it be realized?"
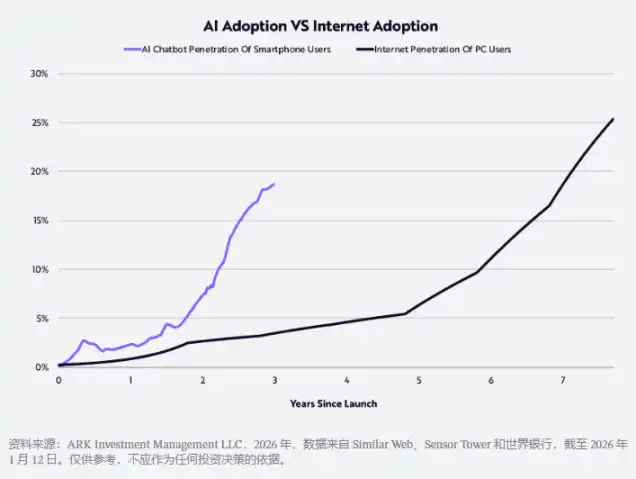
In addition to semiconductors and publicly listed large cloud companies, privately held AI-native companies are also benefiting from growth and investment returns. AI companies are among the fastest-growing businesses in history. Our research indicates that consumer acceptance of AI is twice as fast as the acceptance of the internet in the 1990s, as shown below.
Reports suggest that by the end of 2025, OpenAI and Anthropic will achieve annual revenues of $20 billion and $9 billion, respectively, representing increases of 12.5 times and 90 times compared to the previous year's revenues of $1.6 billion and $100 million! Rumors suggest that both companies are considering initial public offerings (IPOs) in the next year or two to raise funds for the large-scale investments required to support their product models.
As OpenAI's application division CEO Fidji Simo stated, "The capabilities of AI models far exceed the levels that most people experience in their daily lives, and 2026 is the year to bridge that gap. The leaders in the AI field will be those companies that can translate cutting-edge research into products that are practically useful for individuals, businesses, and developers." This year, as user experiences become more humanized, intuitive, and integrated, we expect to see substantial progress in this field. ChatGPT Health is an early example, a dedicated area within the ChatGPT platform aimed at helping users improve their health based on their personal health data.
In enterprises, many AI applications are still in the early stages, constrained by bureaucracy, inertia, and/or prerequisites such as restructuring and building data infrastructure, leading to slow progress. By 2026, organizations may realize that they need to leverage their own data to train models and iterate quickly, or risk being left behind by more ambitious competitors. AI-driven use cases should be able to provide instant and superior customer service, faster product release speeds, and help startups create more value with fewer resources.
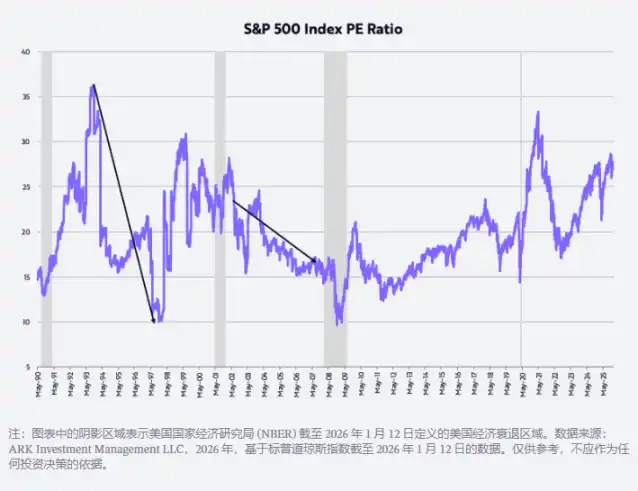
Market Valuation Concerns
Many investors are concerned that stock market valuations are too high and currently at historical peaks, as shown in the following chart. Our own valuation assumption is that the price-to-earnings (P/E) ratio will revert to around 20 times, which is the average level over the past 35 years. Some of the most significant bull markets have been accompanied by a compression in P/E ratios. For example, from mid-October 1993 to mid-November 1997, the annualized return of the S&P 500 Index was 21%, while its P/E ratio fell from 36 times to 10 times. Similarly, from July 2002 to October 2007, the annualized return of the S&P 500 Index was 14%, with its P/E ratio decreasing from 21 times to 17 times. Given our expectation that real GDP growth will be driven by productivity improvements and a slowdown in inflation, the same dynamics should reappear in this market cycle, and may even be more pronounced.
As always, a big thank you to ARK's investors and other supporters, and special thanks to Dan, Will, Katie, and Keith for helping me write this lengthy New Year message!
Recommended Reading:
RootData 2025 Web3 Industry Annual Report
The Power Shift of Binance: The Dilemma of a 300 Million User Empire
Delphi Digital: Three Major Trends in Predictive Markets
免责声明:本文章仅代表作者个人观点,不代表本平台的立场和观点。本文章仅供信息分享,不构成对任何人的任何投资建议。用户与作者之间的任何争议,与本平台无关。如网页中刊载的文章或图片涉及侵权,请提供相关的权利证明和身份证明发送邮件到support@aicoin.com,本平台相关工作人员将会进行核查。


