
Author: danny
As cryptocurrency policies gradually become clearer, mainstream capital is pouring into the crypto market. The valuation logic of Binance, the industry leader, and BNB has undergone a structural transformation. BNB is no longer just a simple functional token for the exchange; it has matured into a complex, multi-dimensional, composite asset that needs to be measured by establishing a multi-dimensional valuation framework.
This article proposes a "Three-Phase Growth Model" to assess its fair market value, isolating and analyzing three unique but interwoven economic engines: the Exchange Curve (driven by implicit dividends and structural deflation), the Public Chain Curve (driven by on-chain commodity demand and liquidity, staking), and the emerging Digital Asset Treasury (DAT) Curve (driven by institutional capital access and arbitrage).
This article aims to discuss the valuation model of this multi-dimensional, composite cryptocurrency, regardless of bullish or bearish perspectives.
Introduction
In 1873, after the darkest hour following the Selangor Civil War in the Malay Peninsula—the Klang War (now Kuala Lumpur, which was not yet a city but a muddy tin mining area).
At that time, the Klang Valley area was a true "ghost town." After years of bloody battles between the Hai San and Ghee Hin gangs, the mines were flooded, houses turned to ashes, and plagues ran rampant. Tin prices plummeted, and all the merchants believed it was over, hastily packing up and fleeing back to Malacca and Singapore.
At this point, Ye Yalai had also reached a dead end. His savings were exhausted in the war, and the miners under him were preparing to revolt due to lack of food.
His associates urged him: "Leave. There is no hope here; as long as the green mountains remain, we need not fear the lack of firewood."
The moment he "came riding in": Ye Yalai did not leave.
According to historical records, this burly and strong-willed Southeast Asian patriarch rode around the devastated ruins. He pulled the reins, looked at those preparing to flee, and made a decision that defied commercial logic.
He shouted to his subordinates: "As long as the tin mines are still underground, Kuala Lumpur will not die! Those who leave now should not think of coming back to share in the spoils!"
This was not just a slogan; it was a gamble. Ye Yalai rode through the night to Malacca. He was not fleeing but borrowing money. He used his own head and reputation as collateral to borrow life-saving funds from an old friend (some say it was a British merchant, others say it was a wealthy businessman from Malacca) sufficient to buy rice and tools. With his own strength, he maintained order in the city, distributing rice to miners, repairing roads, and even opening casinos and opium dens to collect taxes to pay the British "protection fee."
In 1879, just when Ye Yalai was about to collapse, global tin prices suddenly skyrocketed.
Even God seemed to be on his side. Due to his previous persistence, the tin mines in Kuala Lumpur were the only ones ready to operate at any time. Wealth poured in like a flood, and Ye Yalai instantly became the richest man in the South Seas, laying the foundation for Kuala Lumpur to become a metropolis.
"There are no skies that cannot be reached, and no mountains that cannot be endured."
I. Macroeconomic Background: The Landscape of Crypto Assets in 2025
The macroeconomic environment in 2025 is a transition from speculative frenzy to institutional consolidation.
1.1 Post-GENIUS Act Era
The financial landscape in 2025 underwent fundamental changes due to the enactment of the GENIUS Act, which established clear regulatory standards for the issuance of digital assets and stablecoins. This regulatory certainty became a catalyst for institutional participation, allowing corporate treasuries to hold tokenized assets with legal protection.
The clarity provided by the act facilitated a surge in merger and acquisition activities, increasing from $1.3 billion in 2024 to $17.7 billion in 2025. This environment of consolidation and legalization paved the way for publicly listed companies to adopt proactive digital asset treasury strategies, eliminating fears of regulatory retaliation.
1.2 Binance's Growth Rate
User adoption metrics in 2025 indicate a structural shift in the way crypto assets are used. Binance's user base expanded to over 300 million, with significant increases in activity in payment layers and wealth management products.
The cumulative trading volume of Binance in spot and futures exceeded $64 trillion. In comparison, this figure surpasses the GDP of most major countries, highlighting Binance's dominant liquidity.
User Growth: The user base surpassed 300 million registered accounts. This metric is crucial for the valuation's "network effect" component (Metcalfe's Law), indicating that the utility value of holding BNB (for fee discounts and access) grows quadratically with the user base.
In addition to achieving impressive results in trading, Binance has also flourished in other areas:
Binance Pay: This vertical handled $121 billion in transaction volume, involving 1.36 billion transactions. Integration with over 20 million merchants indicates that BNB is being used as a medium of exchange, not just a speculative asset. This "velocity of currency" supports the token's monetary premium.
Binance Earn: Approximately 14.9 million users utilized wealth management products, generating over $1.2 billion in rewards. This capital lock-up reduced effective circulation velocity, acting as a soft staking mechanism that removed supply from the order book.
Web3 Wallet: With 13.2 million users and $546.7 billion in transaction volume, the Web3 wallet serves as a key bridge between centralized exchanges and decentralized chains (BNB Chain). This integration reduces friction for users transferring liquidity to the chain, thereby supporting BNB Chain's TVL.
This high turnover of capital flow and regulatory safety background lays fertile ground for BNB's three growth curves. Unlike the 2021 bull market driven by retail speculation, the valuation expansion in 2025 is supported by the expansion of exchange business, organic integration of on-chain and off-chain resources, and tangible earnings.
II. First Growth Curve: Exchange Ecosystem—Shadow Earnings and Deflationary Alpha
The first growth curve is the Exchange Curve. This curve values BNB as a "pseudo-equity" tool for the Binance ecosystem. Although BNB is not equity, it captures the platform's economic surplus through two powerful mechanisms: implicit dividends (via Launchpool, HODLer airdrops, etc.) and equity-like deflation (via Auto-Burn).
2.1 Shadow Dividend Theory
In traditional finance, companies distribute profits to shareholders through cash dividends. In the crypto economy, regulatory restrictions often prevent direct cash distributions. Binance circumvented this by creating an "implicit dividend" model, where value is not transferred to holders in cash but in the form of equity in new enterprises (Launchpool tokens).
This mechanism serves as both a customer acquisition tool for new projects and a revenue generation tool for BNB holders. The flow of value is as follows:
Project Demand: New projects crave Binance's liquidity and user base.
Project Tribute: Projects allocate a portion of their total token supply (usually 2-7%) to Launchpool.
Distribution: This supply is proportionally distributed to users who stake BNB.
Realized Earnings: BNB holders receive these tokens with immediate market value, effectively realizing "dividends."
2.1.1 Annual Yield Quantitative Analysis
The speed of these dividends accelerated sharply during 2024-2025. In 2024, the total value of tokens distributed through Launchpool exceeded $1.75 billion, nearly four times the $370 million in 2023.
Although the listing rate for Launchpool significantly decreased in 2025, Launchpool remains a heavy weapon for revenue generation. High-profile projects still require staking BNB to receive corresponding airdrop rewards.
Typically, 85% of Launchpool rewards are allocated to BNB stakers (relative to FDUSD). This forces users wanting exposure to popular new tokens to buy/borrow BNB.
In 2025, the visibility of HODLer airdrops significantly increased: "Shadow Dividends."
Binance introduced "Hodler Airdrops" to reward loyalty. This mechanism retroactively distributes tokens to users holding BNB in Simple Earn products.
Users deposit through Simple Earn (either flexible or fixed), and Binance takes snapshots. Tokens from partner projects are airdropped.
Statistics show that in 2025, there were a total of 57 Hodler airdrops distributed.
User analysis indicates that holding 100 BNB generated $7,160 in cumulative earnings in 2025.
Yield Calculation: 7,160 / (100 * 850) = ~8.4%. (Note: Some users reported yields exceeding 10.29%)
You can understand this portion of earnings as "shadow dividends." They are not paid in BNB but in external assets (such as APRO, BANANA, LISTA, etc.). However, this represents direct cash flow attributable to the asset. The 10% yield of "blue-chip" crypto assets is significantly higher than the risk-free rate (4-5%) or the S&P 500 dividend yield (~1.5%), proving the reasonableness of the valuation premium.
2.2 Auto-Burn: Structural Deflation
The second component of the Exchange Curve is BNB Auto Burn, divided into quarterly burns based on exchange performance and fees, and real-time burns on BNB Chain. This burn mechanism resembles a buyback + burn deflation mechanism for circulating shares, with higher transparency and immutability in execution.
2.2.1. Quarterly Burn of the Exchange Curve
Each quarter, Binance destroys a corresponding amount of BNB based on trading performance and fees.
2025 Burn Data
- Q1 2025 (30th Burn): 1,580,000 BNB destroyed, valued at approximately $1.115 billion.
- Q2 2025 (31st Burn): 1,579,207 BNB destroyed, valued at approximately $916 million.
- Q3 2025 (32nd Burn): 1,595,599 BNB destroyed, valued at approximately $1.024 billion.
- Q4 2025 (33rd Burn): 1,441,281 BNB destroyed, valued at approximately $1.21 billion.
In 2025, a total of 6,196,087 BNB was destroyed, valued at approximately $5 billion, accounting for 4.2% of the circulating supply.
Interestingly, in October 2025, 1,441,281.413 BNB was removed from circulation, valued at approximately $1.208 billion at the time. This single burn represented a reduction of about 1% in the supply of BNB within a single quarter.
2.2.2 BNB Real-time Burn (BEP-95)
Unlike a company's board deciding to buy back stock, BNB Auto-Burn (on-chain) is algorithmic, determined by a formula based on the BNB price (P) and the number of blocks generated on the BSC.
This automatic burn mechanism was designed to replace the initially volume-based burn, creating an objective, verifiable, and predictable supply contraction. The formula used in 2025 is:
B = N * K / P
Where:
- B = the number of BNB to be burned.
- N = the total number of blocks generated on the BNB Smart Chain (BSC) in the quarter.
- P = the average price of BNB against the US dollar.
- K = price anchoring constant (initially 1000, adjusted to ~465 through BEP updates).
When the BNB price (P) falls, the denominator decreases, leading to an increase in the burn amount (B). Conversely, if the BNB price rises to ~$850 at the end of 2025, the original number of tokens burned decreases, but the value of the burned tokens remains high. This protects the ecosystem from excessive burning during bull markets while accelerating deflation during bear markets.
By the end of 2025, this mechanism had cumulatively removed approximately 280,000 BNB. Although smaller in scale compared to the burns from the trading curve, it provides ongoing, transactional deflationary pressure that scales linearly with network usage.
The formula ensures that the burn is counter-cyclical in terms of the number of tokens (more tokens are burned when prices are low) but continuous in terms of dollar value.
2.2.3 Supply Shock from Deflation
The ultimate goal of the BNB protocol is to reduce the total supply to 100 million tokens. As of December 2025, the circulating supply was approximately 137.7 million BNB.
Remaining to be burned: ~37.7 million BNB.
Current burn rate: ~1.5 million BNB per quarter.
Expected timeline:
37.7 / 1.5 = 25.1 quarters, approximately 6.25 years
This sets the target completion date around mid-2032.
For investors in 2025, holding BNB means owning a piece of a cake that is guaranteed to shrink by about 27% over the investment period. In financial modeling terms, this is equivalent to a company retiring 27% of its outstanding shares. If BNB's market value remains unchanged over the next seven years, each token's price will mathematically appreciate by about 37% solely due to the reduction in supply. This provides a strong "deflationary alpha" independent of market sentiment.
In traditional equity valuation, a company buying back $4 billion in stock (about 3-4% of market value) within a year would be seen as an extremely aggressive bullish signal. For BNB, this happens automatically. The deflationary pressure acts as a constant upward force on the price (P), assuming demand (D) remains constant or grows.
Some analysts believe that the burn mechanism creates a "soft floor." If the BNB price drops significantly, the burn formula stipulates that the number of tokens burned will increase, thereby accelerating the deflation rate and correcting supply-demand imbalances; this viewpoint is subjective.
III. Second Growth Curve: BNB Chain Economic Engine
The second growth curve moves away from centralized exchanges, focusing on BNB as a decentralized computing resource. In this context, BNB serves as the raw material (Gas) needed to power a decentralized global computer, akin to the logic of commodities. This curve is driven by the technical performance of BNB Chain, on-chain transaction activity, and the "locking" demand of DeFi protocols. (Related reading: Beneath Human Nature, Above Mechanism: Using the Anchor of Chaoshan Money House to Explain the BNB Chain Ecological Empire)
3.1 Overall Market Environment
2025 was a year of "layered solidification" in on-chain activity: Solana won the "casino" (Meme/high-frequency trading) battle, while BNB Chain stabilized its base with a strong retail user base and "zero-fee" strategy, and Base became the fastest-growing L2 thanks to support from Coinbase.
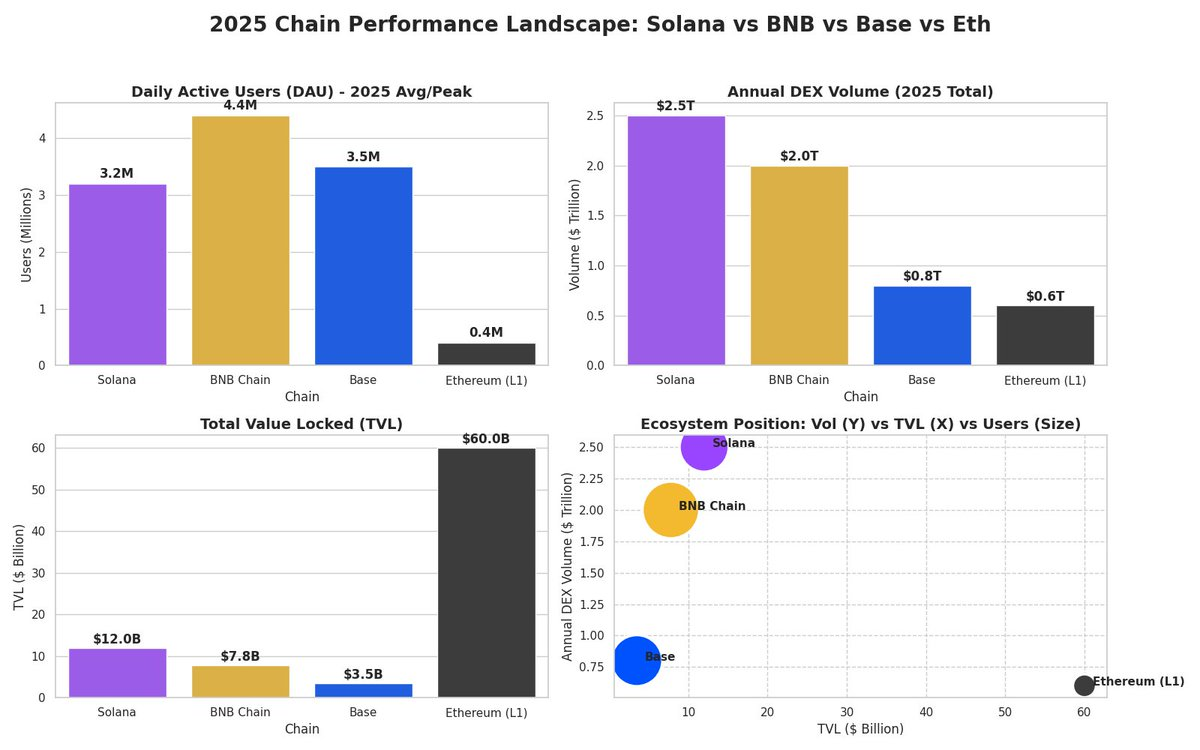

User Scale (DAU): BNB Chain maintained its lead with existing retail users and a "zero Gas" strategy, followed closely by Solana.
Capital Flow (DEX Volume): Solana led significantly in capital turnover due to Meme and high-frequency trading.
Asset Accumulation (TVL): Ethereum remains the place where whales and institutions store "old money," far ahead of other chains.
3.2 Technical Architecture and Capacity
By 2025, BNB Chain had evolved into a multi-layer ecosystem, including BNB Smart Chain (BSC), opBNB (Layer 2), and BNB Greenfield (storage) (although the latter two have not yet made significant progress).
The BNB Chain network processes 12 to 17 million transactions daily, with throughput second only to Solana, and BNB Chain is the most densely populated chain for retail users, with daily active users exceeding 2 million.
In 2025, BNB Chain implemented an aggressive "Gas reduction" strategy, even achieving "0 gas" for stablecoin transfers. This allowed it to maintain a significant advantage in stablecoin payments and small, high-frequency transfers. Interestingly, BNB Chain processed DEX transaction volumes equivalent to Italy's GDP (approximately $2 trillion) throughout the year.
3.3 BEP-95: Real-time Scarcity
While Auto-Burn (Exchange Curve) is a quarterly event, the BEP-95 mechanism is a real-time burn for each transaction. A portion of the Gas fee paid on the BSC is permanently destroyed. (Details can be found in Chapter Two)
Burn Rate: As of December 2025, approximately 279,736 BNB had been burned through this mechanism.
This mechanism makes BNB "ultrasonic currency" during periods of high usage. When network activity surges—such as during the Meme coin frenzy at the end of 2025—the burn rate accelerates.
With the rise of the "Yellow Season" and Meme coin trading on BNB Chain, daily active users exceeded 2.37 million, and DEX trading volume occasionally surpassed Solana (reaching $1.3 billion daily), with Gas burns becoming a significant contributor to scarcity.
3.3 DeFi and Liquidity Staking Derivatives (LSD)
The most significant development in the on-chain curve in 2025 was the explosion of the Liquidity Staking Derivatives (LSD) market. Historically, BNB holders had to choose between staking (with about 2-3% yield) or using capital in DeFi.
Lista DAO and slisBNB: The emergence of Lista DAO changed this calculation. By the end of 2025, the total locked value (TVL) of Lista DAO exceeded $2.85 billion. It introduced slisBNB, a liquid staking token that allows users to earn staking rewards while using the tokens as collateral.
Integration with Launchpool/soft staking: A key innovation in 2025 was the integration of DeFi assets (like slisBNB) into Binance Launchpool. Users can now stake BNB in Lista DAO to earn on-chain yields, receive slisBNB, and then stake that slisBNB in Binance Launchpool to earn airdrops. This "dual yield" increases the stickiness of BNB. It eliminates the opportunity cost of participating in DeFi, locking more supply in smart contracts.
3.4 On-chain Vitality, Capital Flow, and Trading Willingness
In 2025, BNB Chain adopted a "defend first, counterattack later" posture. It successfully maintained its existing retail users and followed market trends in the first half of the year, while finding its rhythm in the second half, leveraging resources from Binance's main site to counterattack against the trend. The highlight of 2025 was the explosion of Binance alpha (which boosted Pancake Swap) and Aster, creating significant trading volume, but ecological innovation appeared somewhat fatigued, leaning more towards replication (such as replicating Meme strategies).
In 2025, the average TVL on BNB Chain stabilized at around $65 billion (peaking at $90 billion). Although lower than Ethereum's peak, the capital turnover rate and trading activity were higher. This was thanks to Aster's "trading incentive activities," Binance alpha's "point brushing" activities, and the meme rush activities of Four meme, which allowed BNB Chain to compete effectively in trading activity, even surpassing its rivals at times.

3.5 Binance Alpha Phenomenon: The Comeback of Pancake
The performance of Binance Alpha in 2025 can be described as "the concubine entering the East Palace." It successfully bridged the vast user base of CEX (centralized exchanges) with the liquidity of DeFi (decentralized finance), creating a significant "spillover effect."
It seamlessly directs hundreds of millions of Binance App users to the blockchain through "One-Click." Data shows that its monthly active users (MAU) once exceeded 100 million, with a large number of CEX users completing on-chain interactions for the first time through the Alpha interface. On May 20, 2025, Binance Alpha set a record for daily trading volume at $2 billion, an astonishing figure in the "first-and-a-half market" that is not listed on the main board.
The explosion of Binance Alpha also brought PancakeSwap back to prominence, reclaiming the top spot in DEX trading volume (even surpassing Uniswap at one point in Q2). According to incomplete on-chain statistics, Binance's "one-click DEX" entry contributed about 12% of new users to PancakeSwap; additionally, due to Alpha providing a zero-fee/low-slippage arbitrage channel between CEX and DEX, as much as 18% of PancakeSwap's trading volume came from arbitrage activities related to Binance Alpha.
Essentially, Binance Alpha "feeds" PancakeSwap with Binance's massive traffic (users) and liquidity (capital). For PancakeSwap, it has transformed from merely a DEX into an "on-chain extension" and "new asset testing ground" for Binance Exchange. However, as time passes and market liquidity diminishes, the glory of Binance Alpha has gradually declined.
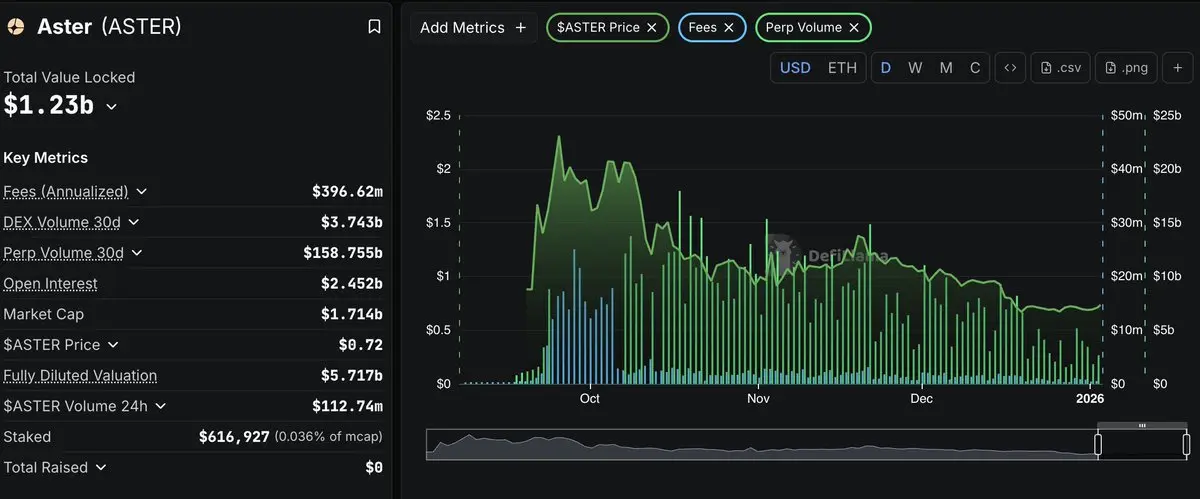
3.6 The "Aster" Phenomenon of BNB Chain: Miracles from Hard Work
Aster was the biggest dark horse of 2025 and one of the most controversial protocols. Relying on extremely aggressive trading incentives and the endorsements of industry leaders, Aster's daily trading volume even exceeded $20 billion on certain days, temporarily surpassing the industry leader Hyperliquid and forcibly pulling BNB Chain back to the center of the DeFi stage. (However, if you look at the open interest, Aster may only have about 1/5 of its competitors.)
(Aster's positioning can be referenced here: https://x.com/agintender/status/1972549024856318180?s=20)
Although the data is astonishing, the market generally believes that there is a significant amount of wash trading and volume manipulation. This makes BNB Chain's Perp data look very attractive, but the actual user stickiness may not be as strong as that of Solana and Hyperliquid.
Despite being criticized for "data fabrication," Aster serves as a "shot in the arm" for BNB Chain.
In 2025, Solana's meme coin frenzy drained most of the active capital. While BNB Chain's spot (Alpha and PancakeSwap) remained stable, it lacked explosive potential; coupled with Hyperliquid's watchful eye, Aster provided a reason for capital to "move"—high-yield farming.
Managers are aware of the dangers of wash trading, but if we look at the bigger picture: every transaction requires BNB as Gas, then everything makes sense. Aster contributed about 15%-20% of the Gas consumption on BNB Chain in 2025, directly driving BNB's deflation and supporting its price.
In the crypto circle, TVL and Volume are advertisements in themselves. Aster's impressive trading data made institutions and retail investors feel that "BNB Chain can still fight," thus retaining some existing capital from flowing to competitors.
Unlike Hyperliquid (where users make a living by establishing real trading strategies) or Jupiter (where retail investors gamble on meme price fluctuations), most of Aster's trading volume lacks real counterparty demand. Once the token price drops, the arbitrage space disappears (i.e., the value of returned fees), and trading volume can instantly drop to zero. To maintain high trading volume, Aster must continuously issue tokens to reward traders, falling into a passive spiral of time-for-space exchange. Data also shows that Aster's trading volume and fee capture ability are entering a downward trend.
Next, we may need to look at the relay of the prediction market.
IV. Third Growth Curve: Digital Asset Treasury (DAT) Arbitrage
The third growth curve is a new phenomenon of 2025: the Digital Asset Treasury (DAT) of altcoins. This phenomenon represents BNB's financialization as a corporate reserve asset, hoping to replicate Bitcoin's "MicroStrategy script." However, unlike Bitcoin, BNB is an income-generating asset.
4.1 DAT Argument: Why Public Companies Buy BNB
Public companies in the U.S. and international markets have begun to adopt BNB as a primary treasury asset. The logic includes three aspects:
Inflation Resistance: BNB has structural deflationary characteristics (due to burns).
Yield Generation: Unlike idle Bitcoin, BNB generates about 2-5% native yield through staking, HODLer airdrops, and Launchpool.
Coin-Stock Arbitrage: The trading price of the company may be at a premium relative to its net asset value (NAV), allowing them to raise cheap capital to purchase more BNB.
4.2 CEA Industries (Nasdaq: BNC)
CEA Industries, formerly a struggling e-cigarette technology company on the verge of delisting, has become the "BNB version of MicroStrategy." The company explicitly stated its goal to acquire 1% of the total supply of BNB (approximately 1.3-1.4 million tokens).
CEA utilized an "At-The-Market" model to issue stock financing, selling shares when the stock traded at a premium. They sold 856,275 shares at an average price of $15.09 to purchase BNB. As of November 18, 2025, CEA Industries reported holding 515,054 BNB, valued at approximately $481 million.
Notably, the company reported achieving about a 1.5% yield over several months (from August to November), implying an annualized yield of over 5%. This yield set a good example—it covered capital costs (such as interest on convertible notes), serving as a model for other treasury companies.
The company's cost basis was approximately $851.29/BNB. By the end of 2025, as BNB traded around this level, the portfolio was at the breakeven/profit margin. However, due to the massive holding size (accounting for 0.37% of the total supply), CEA Industries effectively removed a significant amount of spot liquidity from the market, further reducing liquidity.
Currently, CEA's NAV premium rate (mNAV) is around 2.1x, meaning **investors are willing to pay *$2.1* to purchase $1 of BNB assets held by the company. Some analysts believe this may be due to the fact that this is the only channel for institutions to buy BNB on Nasdaq. However, this article argues that the main reason is BNB's leverage effect: during the BNB price surge in Q4 2025 (when BNB broke the historical high of $1,200), BNC's stock price increase was typically 1.5 to 2 times that of BNB's spot increase. However, when BNB retraced by 5%, BNC often fell by 10%-15%. This is because once market sentiment cools, its NAV premium of up to 2 times will quickly compress (killing the valuation).
4.3 Nano Labs (Nasdaq: NA)
Nano Labs, a Hong Kong chip design company listed on Nasdaq, followed closely behind.
$45 million ATM: Nano Labs reached an agreement to raise $45 million through equity financing, specifically to fund its "BNB and crypto asset reserve strategy." Additionally, Nano Labs integrated this treasury with its business operations, launching the "NBNB plan" to build real-world asset (RWA) infrastructure on BNB Chain and issued $500 million in convertible notes to actively acquire BNB. The company accumulated approximately 128,000 BNB by mid-2025.
As of the end of 2025, its publicly held position was valued at approximately $112 million - $160 million (including BNB and a small amount of BTC). Although it is still far from the $1 billion mark, for a small-cap stock with a market value of only a few tens of millions of dollars, this is already a "full-house bet."
Combining CEA and Nano Labs, over 643,000 BNB were locked in corporate treasuries in 2025. This accounts for nearly 0.5% of the circulating supply. As this trend matures, the "free float" of BNB decreases, increasing volatility and upward price pressure during demand surges.
4.4 Premium/Discount Arbitrage Cycle
The engine of the DAT curve is the NAV premium, meaning as long as there is a trading premium, the public company can continuously finance the purchase of the token, thereby pushing up the company's trading premium. (Related reading: What to Do After a Halving? Decoding the Anti-Fragile Mechanism and Breakthrough Code of DAT Companies)
If CEA Industries' stock ($BNC) trades at a market capitalization of $600 million, but its underlying BNB is valued at $481 million, then its trading premium is approximately 25%.
The company can issue new shares at this inflated valuation. Investors buy shares to gain exposure to BNB (possibly because they cannot directly hold the tokens due to authorization restrictions). The company uses cash to purchase more BNB. This buying pressure pushes up the price of BNB. An increase in BNB's price raises the company's NAV. If the premium holds, the stock price will rise further. But the question is, in this market environment, are there still institutions willing to pay for DAT?
There is actually a fourth growth curve, but it is still too early to discuss.
As a side note, will Abu Dhabi, which just announced becoming Binance's global headquarters, be able to maintain a long-term relationship with this industry giant? Can the lovers who have passed the honeymoon phase achieve a lasting relationship? Let's wait and see.
Interests: The author holds $BNB.
Postscript
Traditional cryptocurrency valuation models (MV=PQ) fail to capture the complexity of BNB. Therefore, it is recommended to adopt a Sum of the Parts (SOTP) model to aggregate the value of the three curves.
BNB = V_Yield + V_Commodity + V_MonetaryPremium
Component A: V_Yield (Exchange Curve)
We can compare the valuation of BNB with its closest publicly traded peer, Coinbase (COIN).
Coinbase Metrics (2025): Coinbase's price-to-earnings ratio (P/E) is approximately 20.51, and its price-to-sales ratio (P/S) is 10.34. Its revenue for 2024 is approximately $6.2 billion.
For Binance's metrics, you can calculate them yourself.
Component B: V_Commodity (Public Chain Curve)
This value derives from Gas demand and Total Value Locked (TVL).
BNB Chain processes about 17 million transactions daily. If we use a "Network Value to Transactions (NVT)" ratio comparable to high-speed L1 networks to value the network, we can compare it to ETH and SOL.
Component C: V_MonetaryPremium (DAT Curve)
This is the speculative premium increased by institutional accumulation.
As DAT locks up supply, the marginal price of available BNB rises. The "tradable supply" decreases.
Historically, assets that become institutional reserves (such as gold or Bitcoin) tend to have a certain premium relative to their industrial use at the liquidity access (shell value) threshold.
免责声明:本文章仅代表作者个人观点,不代表本平台的立场和观点。本文章仅供信息分享,不构成对任何人的任何投资建议。用户与作者之间的任何争议,与本平台无关。如网页中刊载的文章或图片涉及侵权,请提供相关的权利证明和身份证明发送邮件到support@aicoin.com,本平台相关工作人员将会进行核查。


