Alphabet is currently a "reasonably expensive / slightly premium quality stock," reflecting the secondary growth expectations brought by AI in the cloud sector, but it has not yet entered a severe bubble phase completely disconnected from fundamentals.
Author: Alex Xu, Mint Ventures
I. Research Summary
1. Key Points
Alphabet (GOOGLE), as the cornerstone of the global digital economy, has a strong cash flow generation capability due to its monopoly in search and advertising. By 2025, its core business is expected to maintain steady growth, with operating profit margins steadily increasing to the 30%+ range.
The AI-driven cloud business has become an important second growth curve, with Google Cloud's revenue contribution in Q3 2025 at 15%, showing a year-on-year growth rate of 34%, returning to a high-speed growth trajectory, and profit margins continuing to rise from 17% in the same period last year to 24%, with further upside potential.
The explosive development of the AI industry and its rapid penetration into the global user base have complex and far-reaching implications for Alphabet, presenting both opportunities and challenges:
In the short term, the rapid development of AI has not yet posed a substantial impact on Alphabet's core business—search advertising—and Google has enhanced the conversion rates of search ads through AI capabilities. The rollout of the AI overview feature has maintained Alphabet's foundational position in search. From the current advertising revenue and the ROI data disclosed by management, there is no evident decline in search conversion rates or the value of individual ads. Instead, there is a noticeable efficiency boost across various product lines due to AI capabilities.
However, in the medium to long term, Q&A-style AI poses a real threat to Alphabet's business model. User search behavior has begun to shift towards AI products. Even though Google's AI overview has temporarily slowed user attrition, the competitive landscape of AI is difficult to change. Google faces challenges in replicating its monopoly in the search field within AI products. Even if it maintains a monopoly in AI search, the high unit costs and low advertising display space of AI search will reduce Google's profit margins in its advertising business.
Nevertheless, Google's strong product ecosystem can provide significant advantages in the AI era. Unlike GPT and Claude, which have to build and retain customers from scratch, Google can efficiently distribute Gemini and other AI tools to users through its rich product matrix (search, Chrome browser, YouTube, Gmail, Maps, Android, and enterprise products). In the upcoming wave of AI Agents, Google will undoubtedly integrate AI into various products, embedding its AI Agents into the lives and workflows of the public and enterprises, which will generate massive data returns, aiding the upgrade and optimization of underlying models, creating a more powerful comprehensive moat than in the information internet era.
Alphabet's TPU-based AI accelerator product series poses a certain internal and external substitute to NVIDIA's GPU market. Coupled with Berkshire's recent purchases, the current market narrative is that "Google has the most complete AI industry chain" and "Google can take on ten competitors," helping its valuation to recover rapidly. However, NVIDIA's fundamentals remain solid, and AI infrastructure products are still in short supply in the short term. Both companies are in a phase of expanding the market together, but in the medium term, TPU is expected to capture some of NVIDIA's market share.
The market's warnings about an "AI bubble" focus on: 1. High company valuations and market capitalization concentration; 2. Excessive capital expenditures that are difficult to cover long-term downstream revenues; 3. Financial concerns such as excessively long depreciation periods and supplier financing. The author believes that the market's concern over the third point is overstated, with limited actual impact, while the first point is far below the levels seen during the 2000 bubble. The real focus should be on the second point, which is the actual demand situation in the downstream market (currently, demand appears to be relatively sufficient). However, even if the AI bubble bursts, representative companies like Google, due to their solid core business and dominant contribution to revenue and profits, have the ability to smooth over the transition, making it difficult for the market to replicate a crash of over 70% like in 2000.
The risk of a breakup resulting from the U.S. federal court's antitrust ruling in 2024 was settled in a September ruling this year, ultimately having limited harm to Alphabet, as it did not require the separation of Android and Chrome, which is the best outcome previously anticipated. However, antitrust lawsuits in Europe continue to arise, with billions in fines and various investigations (on December 9, the EU initiated an antitrust investigation into Google's AI).
2. Valuation Assessment
Alphabet is currently a "reasonably expensive / slightly premium quality stock," reflecting the secondary growth expectations brought by AI in the cloud sector, but it has not yet entered a severe bubble phase completely disconnected from fundamentals. If one is fully optimistic about the downstream demand in the AI industry and believes that Alphabet's medium to long-term profit and free cash flow growth can maintain low double digits (above 12%), then the current valuation is acceptable, although it will still require time to digest the multiples. However, if expectations regarding AI monetization and the regulatory environment are more conservative, Alphabet should be viewed as a "quality but currently not cheap" long-term investment rather than a clearly undervalued opportunity for heavy investment.
3. Potential Catalysts and Risks
Catalysts: Full commercialization of the Gemini model, cloud business profit margins benchmarked against AWS/Azure levels and continuing to grow, sustained explosive downstream demand for AI, and significant new orders for TPU cluster services.
Risks: Intense industry competition is far from resolved, coupled with the proliferation of open-source AI models, which poses a risk of commoditization of AI computing power; tightening global regulation and antitrust scrutiny (especially breakup risks); excessive AI capital expenditures dragging down profits; slow or insufficient growth in downstream AI demand; and macroeconomic slowdown.
II. Company History
Before understanding the industry and the specific business of the company, it is necessary to understand Google's past development history, from which we can extract the character traits of the founders and the overall strategic level of the company.
Phase One: Establishment and the Rise of Search Dominance (1996 – 2003)
This phase was crucial for Google to establish its core technology and business model (advertising) and for the formation of the "triumvirate" management structure.
1996: Larry Page and Sergey Brin developed the search engine BackRub at Stanford University, which is the predecessor of Google.
September 1998: Google Inc. was officially registered. The first investment came from Sun co-founder Andy Bechtolsheim ($100,000). The office was moved into the garage of Susan Wojcicki, a future Google veteran and former CEO of YouTube (now deceased).
1999: Raised $25 million in funding from Sequoia Capital and KPCB. The company moved to Mountain View, California.
2000: Launched AdWords. This became the cornerstone of Google's business empire, allowing advertisers to purchase search keywords and establishing its search-based profit model. The famous informal motto "Don't be evil" was also established.
August 2001: Page and Brin realized the need for an experienced manager. Eric Schmidt was appointed CEO, forming the "triumvirate" management structure that lasted for a decade.
The so-called "triumvirate" refers to the power triangle within Google during Schmidt's tenure, consisting of:
Eric Schmidt — Chairman and CEO, who played the role of "parent" and "diplomat," responsible for all external affairs (Wall Street, investor relations, government regulation), sales team building, legal litigation, and daily operational management.
Larry Page — Co-founder / Product Head, focused on the company's core products—search engine, advertising products, and future grand visions. Page has a perfectionist attitude towards user experience and an obsession with speed and efficiency, but due to his lack of social skills and attention to management details, early investors considered him unsuitable for the CEO role (though he eventually achieved it).
Sergey Brin — Co-founder / Technology Head, responsible for recruiting top talent, maintaining the company's unique engineering culture, and exploring "moonshot projects" outside the main business (such as Google Brain and AI business later on).
In this system, the three had distinct roles, but major decisions required consensus among all three. Schmidt once joked that his job was to "decide who is right when Larry and Sergey argue."
Phase Two: IPO, Acquisitions, and Ecosystem Expansion (2004 – 2010)
During this period, Google raised funds through its IPO and established its dominance in the mobile internet era through key acquisitions, making a series of far-reaching strategic decisions that laid the foundation for its advertising traffic moat.
April 2004: Launched Gmail, shocking the industry with 1 GB of storage space.
August 2004: Went public on NASDAQ. The company adopted a dual-class share structure, with Page, Brin, and Schmidt holding Class B shares, giving them absolute voting power.
2005: Secretly acquired Android (for about $50 million). This became one of Google's highest-return acquisitions, providing a crucial foundation for competition in the mobile era, becoming its main platform for mobile advertising and app distribution, and a primary source of data, solidifying its core ecological position in the mobile industry. In the same year, Google also launched Google Maps, which is a critically important infrastructure product, serving as the geographical foundation for various products in the mobile era.
October 2006: Acquired YouTube for $1.65 billion, establishing dominance in the streaming video field.
September 2008: Launched the Chrome browser and the first Android phone (T-Mobile G1). Google officially entered the operating system and browser markets, forming a highly interconnected and collaborative core ecosystem that continues to this day.
January/March 2010: Exited the mainland China market.
Phase Three: Mobile-First, Restructuring, and Antitrust Clouds (2011 – 2018)
Schmidt stepped down, Page returned, and then Pichai rose. The company structure underwent significant changes while facing severe global regulatory scrutiny.
April 2011: Larry Page took over as CEO, with Schmidt becoming Executive Chairman. Page began to streamline the product line (shutting down Google Reader, etc.) and focus on core businesses.
The background factors for Schmidt's transfer of power are complex and varied: the rapid increase in Google’s employee count led to the emergence of "big company syndrome"; the rapid rise of Facebook in 2010-11 diverted users to social networks, and Schmidt's response was slow; after more than a decade of experience, Page became more mature in handling affairs and had always desired to take control of the entire Google.
In 2013: As the business continued to expand, internal development of TPU began to reduce computing costs. The first generation product (TPU v1) was deployed and put into use internally at Google in 2015.
In 2014: Acquired DeepMind. This UK AI lab later developed the world-shocking AlphaGo, becoming the core engine of Google's subsequent AI strategy.
In August 2015: A significant reorganization led to the establishment of Alphabet Inc.
Governance structure reform: Google became a wholly-owned subsidiary of Alphabet. The aim was to separate the core internet business (search, YouTube, Android) from "moonshot projects" (Waymo autonomous driving, Verily life sciences, etc.), improving financial transparency and enhancing Google's valuation.
Personnel changes: Page became CEO of Alphabet, Brin became president, and Sundar Pichai, who came from the advertising plugin product management background, was promoted to CEO of Google.
In addition to financial transparency and facilitating Sundar Pichai's promotion, the establishment of Alphabet also considered factors such as protecting innovation (separating innovative businesses from mature ones, with independent teams and operations to avoid interference from main business departments in budgeting and KPIs) and legal risk isolation (the legal and brand risks brought by autonomous driving businesses like Waymo could be isolated from Google's main brand).
In 2016: Announced a shift from a "mobile-first" to an "AI-first" strategy. Launched Google Assistant and the Pixel series of phones. In May of the same year, at its developer conference Google I/O, TPU was officially disclosed to the public for the first time, introducing this ASIC chip designed for deep learning, and starting in 2018, Google began supplying TPU through its cloud services.
In 2017: Google Brain published the famous Transformer paper titled "Attention Is All You Need."
From 2017 to 2019: A series of antitrust actions from the EU. The European Commission imposed fines totaling over €8 billion on Google for Google Shopping, Android bundled applications, and AdSense advertising monopolies, followed by a long and ongoing series of antitrust lawsuits from the EU.
Phase Four: Post-Founder Era and AI Arms Race (2019 – 2024)
The founders completely withdrew, and Pichai held all the power. Facing challenges from OpenAI, Pichai issued a "Code Red" alert to recall the founders, entering a state of war in AI, while also facing the most severe antitrust lawsuits in U.S. history.
In December 2019: Page and Brin stepped down as CEO and president of Alphabet, with Sundar Pichai concurrently serving as CEO of both Alphabet and Google. The founders still controlled the company through the board and voting rights but no longer participated in daily management. Their withdrawal was due to Pichai's excellent work and the trust it inspired, as well as fatigue from complex congressional inquiries and employee protests (Android founder Andy Rubin left due to sexual harassment but took away a $90 million bonus; Google’s involvement in military projects).
In October 2020: The U.S. Department of Justice (DOJ) filed an antitrust lawsuit, accusing Google of maintaining an illegal monopoly in the search and search advertising fields (such as paying Apple billions to become the default search engine).
From November to December 2022: ChatGPT was released. Pichai issued a "Code Red" alert, believing that the core search business faced the greatest survival threat since its inception, prompting urgent calls to Page and Brin. The two founders returned multiple times to the Mountain View headquarters for strategic meetings to review Google's AI product roadmap. Brin decided to return to frontline work, residing at Google's newly established AI headquarters—Charleston East building. Based on employee feedback, Brin actively participated in Gemini's technical meetings, personally intervened to retain key AI talent, and even directly contributed to code submissions. From subsequent developments, Google's progress in AI noticeably accelerated, thanks in large part to Brin's timely return.
In January 2023: A historic large-scale layoff was announced, cutting about 12,000 jobs (6% of the total workforce), ending a long-standing myth of high benefits and no layoffs, causing internal morale turmoil.
In January 2023: The U.S. Department of Justice filed a second major antitrust lawsuit, this time focusing on Google's digital advertising technology (Ad Tech).
From February to December 2023: The AI counteroffensive. The rushed release of Bard (later renamed Gemini) faced negative reviews, leading to the merger of Google Brain and DeepMind to form Google DeepMind, led by Demis Hassabis (the original founder of DeepMind, who won the Nobel Prize in Chemistry in 2024), to accelerate AI research and development.
In August 2024: A significant ruling: A U.S. federal judge ruled that Google is an illegal monopolist in the search service and general text advertising fields. This is the largest antitrust defeat for the U.S. tech industry since the Microsoft case, potentially leading to Google being prohibited from paying manufacturers like Apple for pre-installation fees and even facing breakup risks.
Phase Five: Regulatory Boot Drops and Technological Revival (2024 – 2025)
From being ruled a monopoly by the federal court to the implementation of a "light penalty," from being an "also-ran" in the AI era to a resurgence in product reputation, and through the release of Gemini 3.0, Alphabet's past year has been tumultuous.
In May 2024: AI Overviews took over search. Despite initial controversies (issues with hallucinations), Google insisted on placing AI answers above blue links, and AI began to be integrated into ecosystem products, transitioning from "retrieval" to "Q&A."
In September 2025: The U.S. federal court made a final ruling. Although it imposed several unfavorable restrictions on Google, such as:
Being prohibited from bundling search distribution through certain exclusive agreements, such as signing arrangements with device manufacturers and browsers to "only pre-install Google Search / not allow competitors to be pre-installed";
Ordering Google to share a certain range of search index data and user interaction data with competitors to lower the barriers for new entrants to build usable search services;
For AI assistants like Gemini and new entry points like Google Assistant, the court prohibited Google from locking distribution channels through exclusive promotion agreements to prevent it from replicating its past monopoly path in traditional search during the "AI search era."
But more critically, the court did not agree to the DOJ's request to force Google to break up and sell Chrome or Android, nor did it restrict Google from paying Apple, Samsung, and other phone manufacturers to make Google the default search engine, allowing Google to retain its main source of search traffic, which was the best possible outcome for Google.
In October 2024: A change in search leadership occurred. Prabhakar Raghavan, who had overseen the core search advertising business for many years, stepped down and became CTO. Nick Fox took over. This adjustment was seen as a key deployment by Pichai to accelerate the integration of "AI + Assistant + Search," aiming to break down departmental walls and fully promote the AI Agent strategy.
In November 2025: Gemini 3.0 reclaimed the throne. After a year of catching up, Gemini 3.0 was released, surpassing competitors like GPT-5 in complex logical reasoning and native multimodal understanding (directly comprehending video streams). It even received praise from competitors' founders Sam Altman and Elon Musk, reaffirming Google's leading position in foundational models and largely dispelling capital market concerns about "Google falling behind in the AI era."
Throughout 2025: The computational power advantage based on TPU became evident. Against the backdrop of NVIDIA GPU shortages and high prices, Google's self-developed TPU v6 (Trillium) became a killer app, surpassing NVIDIA's products in "overall efficiency" and "unit cost." Besides its own use, major companies like Apple Intelligence and Anthropic also used Google's TPU clusters for core training, bringing substantial revenue and endorsement to Google Cloud, with Meta also in discussions for billions in TPU procurement.
Summary
Looking back at Google's 30 years of entrepreneurship, the two founders established a core spirit of pursuing innovation and not being evil, which once served as the highest beacon of Silicon Valley's engineering culture. In the first 15 years of development, they made a series of crucial strategic decisions that built a wide moat for the company. However, as the company grew larger, the gradual withdrawal of the founders led to issues such as decreased product sensitivity, reduced corporate efficiency, increased cultural differences, unfavorable transitions from basic research to engineering/products, and a sudden rise in antitrust risks, marking the beginning of Google's midlife crisis. Although its AI products regained some reputation over the past year, the increasing penetration of AI among user groups poses a direct threat to its core search advertising business, which we will elaborate on in the following sections.
III. Comprehensive Analysis of Business and Industry
Alphabet's business spans digital advertising, cloud computing, online video, consumer electronics, and autonomous driving, and it attempts to drive the accelerated development of each business through artificial intelligence.
This section will analyze the business data and industry development of each business line, especially the artificial intelligence part. Although artificial intelligence is not separately classified as a business segment by Alphabet, it serves as an "accelerator" for various business segments within the group, and its directly provided AI computing services embedded in Google Cloud, centered around TPU, represent Google's future core value. Therefore, I will also isolate it for analysis in a separate section.
It should be noted that there is some overlap in the following business classifications. For example, the total revenue of the "digital advertising and search business" segment includes revenue from YouTube display ads, but due to the importance of the YouTube segment itself, I have still listed it as a separate segment for analysis; similarly, the subscription revenue from the YouTube segment is also counted in the broader category of "subscriptions, platforms, and consumer hardware."
3.1 Digital Advertising and Search Business
3.1.1 Industry Overview and Competitive Landscape
The global advertising market is expected to surpass $1 trillion for the first time in 2024, with digital advertising's share continuing to rise, projected to account for 82% of total ad spending by 2025. Alphabet, through Google and YouTube, has long held the top position in global digital advertising revenue.
However, the landscape has changed in recent years:
Google's market share is being eroded by giants like Meta and Amazon.
In terms of search advertising, Google still holds about 90% of the user share in the global search engine market, but according to eMarketer data, its share of advertising revenue in the U.S. may fall below 50% for the first time in 2025 (due to the generalization of search behavior and the rising share of ads from vertical e-commerce, social platforms, and short video searches).
In the overall digital advertising market, Google's share has also declined by about 7.6 percentage points to below 50% from 2021 to 2025, while Meta and Amazon have increased their shares by approximately 3 and 4 percentage points, respectively.
The main reasons include:
1) The rise of social advertising: Meta has rapidly grown its social advertising through Instagram and Facebook, attracting more brand marketing budgets;
2) The emergence of e-commerce advertising: Amazon has expanded its advertising business by leveraging traffic from its e-commerce platform for search ads and display placements;
3) The rise of short video platforms: Short video platforms like TikTok, owned by ByteDance, are competing for new traffic.
Despite the intensified competition, Alphabet still holds advantages in the digital advertising field:
Search advertising has clear effects and high ROI, with most small and medium-sized enterprises still considering Google Ads as one of their primary online promotion channels;
The overall digital advertising market continues to grow—global digital ad spending is expected to increase by about 15% year-on-year in 2024, with the market size projected to reach $72.3 billion by 2026, growing at an average annual rate of about 9%.
3.1.2 Business Positioning and Structural Roles
Alphabet's search and advertising business mainly includes:
Google Search & other: Search + ads on other owned traffic
YouTube ads (video ads, detailed in the next section)
Google Network: Ads from third-party websites/apps through AdSense, Ad Manager, etc.
These three components together form the Google Ads ecosystem, which is Alphabet's absolute "cash cow":
In 2024, advertising revenue is expected to account for about 78% of the group's total revenue.
In Q3 2025, advertising still accounted for over 70% of total revenue for the quarter.
3.1.3 Latest Quarter (Q3 2025) Core Data and Profit Contribution
Revenue structure (single quarter):
Total group revenue: $102.3 billion, up 16% year-on-year, marking the first time it has surpassed $100 billion.
Google Services (mainly advertising + subscriptions + hardware): Revenue of $87.1 billion, up 14% year-on-year. The advertising portion is divided into three parts:
Google Search & other: $56.6 billion, up 15% year-on-year, the largest single contributor to growth.
YouTube ads: $10.3 billion, up about 15%.
Google Network: $7.4 billion, down 2.6%, continuing to shrink slightly.
Total Google advertising revenue is approximately $74.18 billion, up 12.6% year-on-year, accounting for about 72% of the group's revenue.
Profit contribution:
Q3 Google Services operating income was approximately $33.5 billion, with an operating profit margin of 38.5%.
After deducting the impact of the €3.5 billion antitrust fine from the EU, the adjusted operating profit was about $37 billion, with a profit margin of 42.5%, an increase of about 2.2% from last year.
In the same period, Alphabet's consolidated operating profit margin was only 30.5% (33.9% excluding fines).
It is evident that the high-margin search and advertising business continues to contribute the majority of the group's operating profit; while Cloud and Other Bets have turned profitable or reduced losses, their profit volume is far smaller than that of advertising.
Short-term trends:
Search and YouTube ads have seen double-digit growth for several consecutive quarters (Q2 search up 12% year-on-year, Q3 up 14-15%), maintaining strong growth against the backdrop of rapid AI development, increasing user penetration, and fierce competition among multiple giants.
The only decline is in network advertising, primarily due to management gradually downplaying this segment and guiding ad placements towards owned traffic and high-quality ad inventory.
3.1.4 Mid-term Growth Trends and Driving Factors
High advertising share but structural adjustments:
In 2024, advertising revenue is expected to account for nearly 80% of the group's total revenue, transitioning from single-digit growth during the macro pressure period in 2022 to low double-digit growth from 2023 to 2025, with search and YouTube continuing to grow faster than the overall market.
Structurally, the share of owned traffic (Search + YouTube) is increasing, while the share of Network is declining, enhancing overall quality and bargaining power.
AI-driven enhancements in search and advertising:
By 2025, AI Overviews will cover over 1.5 billion users monthly, with AIMode fully rolled out in markets like the U.S.;
Management has repeatedly emphasized that search results with AI Overviews have ad monetization rates comparable to traditional search;
In Q1/Q2, after the full promotion of AI, Search revenue maintained a year-on-year growth rate of 10-12%, with Q3 reaching +14-15%, indicating that Google's search advertising revenue seems to be unaffected by the widespread adoption of AI search.
AIMax in Search, launched globally in September 2025, has become Google's fastest-growing AI search advertising product, unlocking billions of new search queries in just Q3 and adopted by hundreds of thousands of advertisers. The essential logic is:
Using large models to understand long-tail and complex requests.
"Mining" previously uncatchable demands and matching them with ads.
Expanding the potential market for search advertising.
Profit quality further enhanced:
As advertising growth returns to double digits, the profit margin of Google Services (adjusted) has risen to about 42-43%;
In Q3, management disclosed that paid click volume and average CPC (cost per click) both achieved mid-single-digit year-on-year growth, reflecting advertisers' willingness to pay for Google traffic is still on the rise.
Not yet evident: The long-term impact of AI development on the intent advertising market
So, does this mean that the previously feared "Google's search advertising business will be impacted by AI" has been disproven, and there is no need for concern anymore?
In my view, it is not.
Let’s first look at why the increasing penetration of AI products (including general model products like GPT, AI search products like Perplexity, and Google's own products like AI Overview and Gemini) may impact Google's advertising business.
We will first break down Google's search advertising business, which is also referred to as the "commercial intent advertising market." The term "intent" refers to the true purpose users aim to achieve when they perform an action (searching, clicking, ordering, asking).
When users conduct searches, their intents can generally be categorized into four types: informational, navigational, commercial, and transactional.
Informational: Seeking knowledge, e.g., "Does milk cause cancer?" or "How to write OKRs."
Navigational: Finding sites, e.g., "Taobao" or "招商信用卡中心."
Commercial: Researching products, e.g., "Best laptops for remote work."
Transactional: Preparing to place an order, e.g., "MacBook Air M3 JD."
The types that truly contribute high ROI and bring in the majority of revenue for Google Search are the commercial and transactional intents, with some contribution from navigational intents. Informational intents contribute less, as they create value for users but are harder to monetize through ads.
Thus, the operating profit of Google Search comes from a simple equation:
Ad Profit = Search Volume × Monetizable Intent Share × Number of Ad Slots per Page × CPC (Cost per Click) × Click-Through Rate - (Search Costs + Traffic Costs)
The penetration and gradual maturity of existing AI products have some impact on multiple aspects of this equation, with the most direct impact likely on search volume, ad space, and search costs.
Decrease in search volume: A significant number of users are no longer using Google Search, turning to other AI platforms for search inquiries, leading to a decline in the top layer of Google's search revenue funnel: total search volume. You might ask yourself, how long has it been since you searched for information on Baidu or Google after experiencing GPT, Perplexity, DeepSeek, or Doubao? Additionally, while Google's recent products like Gemini 3.0 have received excellent feedback, they do not represent a generational leap in leadership. Gemini's user perception and market share in the AI product field currently do not reach its monopolistic position in the search engine market. As users shift from traditional search to AI interaction, market shares have been reshuffled. This is the biggest potential impact.
Compression of ad space: Unlike the numerous links and ad slots displayed on search pages, AI Q&A provides more precise answers based on accurate intent judgment, often with controlled length, resulting in fewer opportunities for ad recommendations. Furthermore, GPT-type AI products differ in positioning from search engines; they function more like intelligent assistants with strong credibility attributes. In users' eyes, AI is expected to be accountable for the answers it provides. If AI's answers are driven by ad placements, leading users to feel a loss of neutrality, trust in AI will quickly decline, affecting the product's perception among users. This contrasts sharply with the information provision positioning of search engines, where "search engines provide vast amounts of information, and users are primarily responsible for filtering and discerning information."
Significant increase in search costs: The cost of an AI search is 5-10 times higher than that of traditional search. If AI Overviews are fully implemented, the annual incremental cost could reach billions or even tens of billions of dollars, consuming a large portion of profits.
So, why has Google's search advertising business not seen a decline in revenue and profit despite the significant increase in AI penetration, but rather continued to grow, and why has the net profit margin not decreased due to rising search costs? In my view, there may be the following reasons:
- Immature competitive market: The advertising market in the AI field (including general products like GPT and specialized AI searches like Perplexity) has not yet launched usable, scalable products, including a mature advertising bidding system, attribution system, and settlement capabilities. Until these basic functions are realized and advertisers complete large-scale advertising experiments with stable ROI reference data, Google search advertising will still be the preferred choice for advertisers, and the diversion of advertising budgets has not officially begun. However, companies represented by OpenAI have started exploring advertising and shopping guidance features and conducting gray tests.
The smart shopping tab of GPT has already appeared in some search box features.
In other GPT interaction pages, pop-ups guiding the use of shopping assistants also occasionally appear.
Currently in a transition period of "AI enhancing search efficiency rather than replacing search": This means that AI currently supports traditional search more than it replaces it. For example, Google's overview feature has improved the user search experience, increased user willingness to search, and retained users; similarly, features like AIMax in Search have increased the scale of advertiser placements, matching ads to more potential demands.
Delayed impact on profit margins: The increase in unit computing costs brought by AI Overviews will not be reflected as an increase in operating costs in the current financial report. Instead, it will be realized through a transmission path of "increased AI computing demand → building more data centers (reflected in accounting as capital expenditure rather than operating costs) → increase in fixed assets → subsequent years' depreciation scale rising." The first impact will be on Google's free cash flow (which has already been reflected in the current financial report), and then through depreciation, it will gradually erode profits. Additionally, Google has conducted large-scale layoffs and efficiency improvements in 2023-2024, introducing better cost discipline, which has a significant effect on maintaining profit margins.
Therefore, the impact of increased AI penetration on Google search advertising may not have truly begun to manifest yet.
3.2 YouTube: Online Video and Media Entertainment Advertising
3.2.1 Industry Overview and Competitive Landscape
The online video platform industry, where YouTube operates, has developed rapidly in recent years, continuously eating into the viewing time of traditional television and streaming:
By 2025, YouTube's monthly active users will exceed 2.7 billion, second only to Facebook, covering about 52% of global internet users;
Daily viewing time exceeds 1 billion hours, and the online video advertising market is booming, with YouTube holding a significant share in digital video advertising, especially in UGC short videos and mid-length video ads.
Challenges are also increasing:
TikTok's global monthly active users have reached about 1.59 billion and continue to rise, with short video advertising still being a high-growth emerging track;
Streaming giants like Netflix and Disney+ have launched ad-supported packages, competing with YouTube for brand advertising budgets;
YouTube itself is also promoting user-paid subscription models (YouTube Premium, YouTube Music, etc.), with subscription users exceeding 125 million, needing to dynamically balance between "advertising vs. subscriptions."
Overall trends:
User viewing habits continue to shift towards online video, and online video advertising is expected to maintain double-digit growth;
The evolution of content forms and the increase in competitors require YouTube to continuously innovate product forms (such as Shorts) to maintain user stickiness and attractiveness to advertisers.
3.2.2 Business Positioning and Structural Roles
YouTube is the core carrier of Alphabet's online video and social platform business, including:
YouTube Ads: Ads for long videos, Shorts, live broadcasts, and TV (Living Room);
Subscriptions and value-added: YouTube Premium/Music, channel payments, tips, etc. (accounted for under "Google subscriptions, platforms, and devices").
From the group's perspective:
In 2024, YouTube's advertising revenue is projected to be $36.1 billion, up 14.6% year-on-year, accounting for about 10% of Alphabet's total revenue;
On the user side, by mid-2025, monthly active users are expected to be about 2.7 billion, second only to Facebook globally.
Thus, YouTube serves as Alphabet's second growth engine in video/social/"TV-like" advertising and subscriptions, being an important branch of advertising cash flow and a key lever for expanding into TV screens and the entertainment sector.
3.2.3 Latest Quarter (Q3 2025) Core Data and Profit Contribution
Revenue and growth:
In Q3 2025, Alphabet's total revenue was $102.3 billion, up 16% year-on-year;
Among them, YouTube's advertising revenue was $10.3 billion, up 15% year-on-year, marking the first time it has surpassed $10 billion in a single quarter. Previously, YouTube advertising achieved a growth rate of +15% in both Q2 and Q3, driven by Shorts + Living Room (TV) + recovery in brand advertising.
Subscription aspect:
- Although specific subscription revenue figures for YouTube were not disclosed, management emphasized in Q3 that Google subscriptions (including YouTube Premium, Google One, etc.) overall grew by 21% year-on-year, making it one of the fastest-growing sub-items in Services.
Profit contribution:
YouTube advertising is a high-margin business within Google Services, with the main costs being revenue sharing with creators/copyright holders;
Although separate profit figures were not disclosed, the market generally believes its operating profit margin is slightly lower than search but higher than most traditional media;
Based on revenue estimates, YouTube (advertising + subscriptions) currently contributes nearly 12-15% to Alphabet's total revenue, with its profit contribution to Google Services rapidly increasing, gradually transforming from a "marginal increment" to an important pillar of the group's profitability.
Trends:
YouTube advertising has recovered from single-digit or even negative growth during the macro pressure period in 2022 to double-digit growth in 2024-2025, with its revenue contribution scale within Alphabet only second to cloud business;
This indicates that it has passed the low point of the advertising cycle and re-entered a healthy phase of "advertising + subscription dual-drive."
3.2.4 Mid-term Growth Drivers and Competitive Landscape
1) Content forms: Dual engines of Shorts and TV
Shorts (short videos): In the U.S. market, the advertising revenue generated by Shorts per hour of viewing has surpassed that of long videos, becoming an important contributor to Q3's 15% advertising growth;
Living Room (TV): Viewing time on large screens in living rooms continues to rise, with annualized revenue from interactive direct response ads on TV exceeding $1 billion. YouTube has substantially entered the TV brand advertising and performance advertising budgets, squeezing linear TV and streaming.
2) Subscriptions and ARPU uplift:
- After surpassing 125 million Premium/Music users, lower-priced packages like Premium Lite have been launched to continue increasing the overall ARPU value;
3) AI recommendations and monetization efficiency:
The 15% growth rate in YouTube advertising is significantly attributed to the growth in Shorts and Living Room (connected TVs) viewing, as well as the recommendation system and Gemini model improving content discovery efficiency;
AI mainly enhances viewing time and advertising eCPM (revenue per thousand impressions) by improving recommendation accuracy, CTR (click-through rate), retention, and creator production efficiency.
4) Competitive landscape:
Compared to long videos/streaming (Netflix, Disney+, etc.): YouTube has become the largest video streaming platform in the U.S. by viewing time, adopting a light-asset model primarily based on UGC + advertising, supplemented by subscriptions, with a content cost structure superior to pure content platforms;
Compared to short video platforms (TikTok): Competitors each have their advantages, with TikTok having strong stickiness among Generation Z. YouTube has launched Shorts to counter this, with the main advantage being the ability to inherit YouTube's existing creator ecosystem and profit system, leading to faster advertising revenue growth;
Compared to social platforms and TV advertising: Meta Reels and Facebook Watch divert some budgets, but with a comprehensive layout of "long + short + TV," YouTube is very close to an "oligopoly" position in the video advertising sub-sector;
Content and compliance risks: Facing regulatory pressures related to content review, copyright, children's privacy, and EU DMA/DSA, but these have not yet become the main battleground for antitrust lawsuits.
3.3 Cloud Computing: Google Cloud and the Global Public Cloud Industry
3.3.1 Industry Overview and Competitive Landscape
Cloud infrastructure services are one of the fastest-growing technology markets in recent years:
In 2024, global enterprise cloud service (IaaS, PaaS, and managed private cloud) spending is expected to be around $327-330 billion, with year-on-year growth rebounding to 20-23%;
In Q3 2025, global enterprise cloud service spending reached $107 billion, a surge of $7.1 billion from the previous quarter, up 27.7% year-on-year, marking the largest quarterly increase.
The market is highly concentrated among three major giants:
According to Synergy Research Group's tracking statistics of the global cloud services market, AWS, Microsoft Azure, and Google Cloud currently account for about 62% of the market share, with AWS at approximately 29%, showing a slight decline in recent years;
Azure, leveraging Microsoft's enterprise customer base, has a share close to 20% and is still increasing;
Google Cloud's share has slowly increased to about 13% in recent years, roughly the same as a year ago;
Alibaba Cloud ranks fourth with a global share of 4%.
The industry competition is characterized by an oligopoly:
AWS is the largest in scale and has the most mature product line;
Azure has advantages in the large enterprise and government markets due to its Office/Windows/enterprise account advantages;
Google Cloud is catching up with advantages in AI and big data technology, enhancing competitiveness through generative AI services like large model APIs and TPUs.
The future space for the cloud market is vast:
It is still expected to maintain a year-on-year growth rate of over 20% in 2025, benefiting from the surge in computing power demand brought about by the implementation of AI applications (the industry's GPU-as-a-service revenue growth rate has exceeded 200%);
However, competition is becoming increasingly fierce, with "new cloud forces" (CoreWeave, Oracle, Databricks, Chinese manufacturers, etc.) accelerating their share capture in segmented scenarios.
3.3.2 Business Positioning and Structural Roles
Google Cloud mainly includes two parts:
Google Cloud Platform (GCP): IaaS/PaaS (computing, storage, databases, networking), data analytics (BigQuery), AI infrastructure (TPU/GPU clusters), generative AI platforms (Vertex AI, Gemini models and APIs), etc.;
SaaS: Google Workspace: collaborative office subscriptions like Gmail, Docs, Meet, etc.
At the group level:
- In Q3 2025, Google Cloud revenue was $15.2 billion, a year-on-year increase of 34%, accounting for about 15% of Alphabet's total revenue (compared to about 12-13% the previous year), seen by outsiders as "the next major growth engine after search advertising."
In positioning, Cloud is both the main battlefield for commercializing Alphabet's AI capabilities and a key sector for hedging advertising regulatory risks and improving the quality of revenue structure.
3.3.3 Latest Quarter Core Data and Profitability
Revenue and growth rate:
In Q3 2025: Cloud revenue was $15.2 billion, a year-on-year increase of 34%, the highest growth rate among the three major segments, while Q3 2024 revenue was $11.4 billion, a year-on-year growth of 35%, maintaining over 30% growth this year on an already high base;
2025 annual trend:
Q1: $12.3 billion, year-on-year +28%;
Q2: $13.6 billion, year-on-year +32%;
Q3: $15.2 billion, year-on-year +34%.
The growth rate has increased for three consecutive quarters, showing a clear trend of "re-acceleration."
Profitability:
In Q3 2025, Google Cloud's operating profit was $3.59 billion, a year-on-year increase of 85% (compared to $1.94 billion in the same period last year), with profit growth significantly outpacing revenue growth, and the operating profit margin rising to 23%, compared to about 17% in Q3 2024, an increase of about 6% within a year;
Achieving rapid profit margin increases during a period of significantly increased AI/data center capital expenditures reflects strong operational leverage.
Contribution to group profits:
Alphabet's consolidated operating profit in Q3 2025 was $31.2 billion, of which Cloud contributed $3.6 billion, accounting for nearly 12%, compared to single digits a year ago;
In comparison, AWS's operating profit was $11.4 billion, and Microsoft Intelligent Cloud's was $13.4 billion. Google Cloud's absolute profit volume still lags behind, but its profit growth rate (+85%) significantly outpaces AWS (+10%) and Microsoft (+27%).
Cloud has transformed from an early "long-term loss" segment into a mature business with high revenue growth and high profit elasticity, rapidly increasing its weight in Alphabet's profit structure.
3.3.4 Mid-term Growth Drivers and Competitive Landscape
1) AI as the main driver:
Management has clearly stated that Q3 cloud revenue growth is primarily driven by AI infrastructure and generative AI solutions, especially model APIs based on Gemini, Vertex AI, and AI-optimized computing power;
Third-party reports indicate that AI-related revenue has reached "tens of billions" in a single quarter, rapidly increasing its share in Cloud revenue;
Q3 Cloud's unfulfilled orders reached $155 billion, a significant increase quarter-on-quarter, with about half expected to convert to revenue in the next two years—indicating strong revenue certainty in the future without considering new customers.
2) Continuous improvement in profit quality:
Cloud profit margins have increased from 17% to 23-24%, reflecting significant improvements in gross margins per unit of computing/storage supported by high-value AI workloads, against the backdrop of Alphabet's capital expenditure guidance being raised to $91-93 billion (mainly for AI/Cloud infrastructure);
The fixed cost dilution effect is gradually being released.
3) Customer structure upgrade:
Customers are shifting from "long-tail SaaS + traditional enterprises testing the waters" to "large enterprises + AI labs + industry-leading clients";
AI labs and traditional large enterprises are running in parallel, significantly improving order quality and stickiness.
5) Competitive landscape:
Under the three giants' structure, Google Cloud ranks third in size and first in growth rate, steadily increasing its share at the expense of "other cloud vendors";
Compared to AWS and Azure:
Disadvantages in traditional enterprise ERP/industry cloud and channel depth;
Advantages in data analytics (BigQuery), AI/ML (Vertex AI, Gemini), Kubernetes, and high-performance computing (TPU).
"New cloud forces" such as CoreWeave, Oracle, Databricks, and some regional vendors pose localized challenges to the three giants in AI/data/local compliance scenarios.
3.4 Subscriptions, Platforms, and Consumer Hardware
3.4.1 Industry and Ecological Background (Operating Systems and Hardware)
Alphabet's layout in the hardware and operating system fields includes:
- Android mobile ecosystem, Pixel smartphone series, WearOS smartwatches, Chromebook laptops, Nest smart home products, etc.
In terms of industry structure:
The Android system itself occupies about 71% of the global mobile operating system market share (iOS about 28%), holding an absolute dominant position. Although the Android system does not directly generate revenue for the group, most smartphone manufacturers using the Android system are required to install Google's ecosystem products and set Google as the default search engine, becoming the main source of traffic and product distribution for Google in the mobile market;
However, Alphabet's influence in its own brand hardware is relatively limited:
Global smartphone shipments are around 1.2-1.3 billion units annually, with Pixel phone sales accounting for less than 2%, mainly having a certain share in a few markets like North America and Japan;
The smartphone market is primarily led by Samsung and Apple (with a combined share of over 50%), while other Android manufacturers like Xiaomi, OPPO, and vivo share the remaining market.
The smart hardware industry is highly competitive and has low profit margins, but it still holds unique significance for the ecological strategy:
Google aims to complete the "cloud-edge" ecological closed loop through hardware, exploring a vertical integration model similar to Apple's;
Ensuring that the Android platform is not overly constrained by third-party manufacturers.
In terms of revenue structure:
- In 2024, the "Subscriptions, Platforms, and Devices" (SPD) category generated $40.34 billion in revenue, accounting for about 11.5% of the company's revenue, including revenue from app market Play, hardware sales, and YouTube/cloud service subscriptions.
3.4.2 Business Positioning and Structural Roles (SPD)
The hardware and other platform business lines consist of three parts:
Consumer Subscriptions: YouTube TV, YouTube Music & Premium, NFL Sunday Ticket, Google One, etc.;
Platforms: Revenue from Google Play app and in-app purchases;
Devices: Pixel series devices (phones, tablets), Pixel Watch, Pixel Buds, Nest/Chromecast smart home and streaming devices.
In Google Services, SPD is the second-largest non-advertising revenue source after advertising, mainly responsible for:
Providing high stickiness and predictable subscription revenue, improving the overall stability of the revenue structure;
Monetizing mobile traffic and developer ecosystems through Play and the Android ecosystem;
Acting as "AI terminals + showcase devices" through hardware like Pixel/Nest, demonstrating Gemini's capabilities on the terminal side and solidifying user binding to the Google ecosystem.
3.4.3 Latest Quarter Performance and Profit Contribution
Revenue and growth rate:
In Q3 2025, Alphabet's total revenue was $102.35 billion, a year-on-year increase of 16%;
Among them, SPD revenue was $12.87 billion, up 20.8% compared to $10.66 billion in Q3 2024;
Roughly speaking:
SPD accounts for about 12-13% of Alphabet's total revenue;
It accounts for about 15% of Google Services revenue.
Profit contribution (qualitative):
Alphabet does not disclose SPD profit margins separately, but:
- Subscriptions (YouTube Premium/TV, Google One) and Play revenue share are both high-margin digital services, while hardware margins are lower and even close to breakeven;
Combining the 10-K statement that "SPD growth is primarily driven by subscription revenue, especially from YouTube services and Google One," it can be reasonably inferred that:
The overall profit margin of SPD within Google Services is "above average," slightly lower than pure advertising business;
The true profit contributors are subscriptions and platforms, while hardware plays a more strategic and branding role.
From a trend perspective, SPD revenue increased from $34.69 billion in 2023 to $40.34 billion in 2024, an increase of $5.7 billion, with a year-on-year growth of 16.4%, clearly driven by subscription growth; in Q3 2025, the quarterly growth rate further increased to about 21%, indicating that this line is accelerating its contribution to the group's profits.
3.4.4 Mid-term Growth Drivers and Competitive Landscape
1) Subscriptions: YouTube + Google One as the absolute main engine
YouTube Music & Premium: As of March 2025, paid users (including trials) have exceeded 125 million;
YouTube TV: Subscriptions exceed 8 million, with sports rights like NFL Sunday Ticket driving high ARPU;
Google One: As a cloud storage + value-added rights package, the number of subscribers continues to grow, identified by the CFO as the second-largest contributor to SPD growth.
Both the 10-K and management statements indicate that the "cash cow" portion of SPD has shifted from the early Play to the high-margin recurring revenue from YouTube series subscriptions + Google One.
2) Platforms: Play is in the mature stage, providing stable cash flow
Android's approximately 70% global OS share provides stable revenue for Play;
The revenue scale is large (though not officially disclosed, industry estimates suggest user spending is around $55-60 billion/year, corresponding to Play's revenue of $6-9 billion/year) and relatively stable, with growth rates lower than subscriptions but higher margins;
Medium to long-term risks mainly come from EU and US regulations on commission rates, bundled installations, and third-party payments.
3) Hardware: Pixel and others play more of a "strategic + branding" role
Pixel remains a "niche brand" globally, with a low single-digit market share; in the US market, following the Pixel 10 launch, its share increased from 2-3% to 3-4%;
The gap with Apple/Samsung remains significant, with competition focused on AI photography, native Android update speed, and integration with Google services;
Pixel Watch, Pixel Buds, Nest, and other wearable and home products benchmark against Apple Watch/AirPods/Amazon Echo & Ring, primarily serving as data entry points and experience showcases;
Management has made it clear that for the next 2-3 years, smartphones will still be the center of consumer experience, and AI hardware (like glasses) has not yet reached the replacement stage.
3.5 Autonomous Driving and Waymo: Mobility Technology Track
3.5.1 Industry Overview and Technical Route
The global Robotaxi industry is still in its early stages but is transitioning from "burning money on R&D" to "seizing market share":
The current market size is still small (annual revenue of less than $1 billion), but various institutions generally predict a compound growth rate of 50-70% from 2025 to 2030;
2024-2025 is seen as a turning point: commercial routes are gradually opening in cities like San Francisco, Phoenix, and Los Angeles, with Robotaxi evolving from "technology experiments" to "regional businesses."
The technical and commercial routes can be roughly divided into three categories: 1) Heavy asset/full-stack faction (Lidar + high-precision maps):
Representatives: Waymo (Google), Zoox (Amazon), Cruise (General Motors);
Using multi-sensor fusion + high-precision maps + rule/AI hybrid, vehicle modification costs are high, but safety performance is best in complex road conditions;
2) Pure vision/end-to-end faction:
Representatives: Tesla Cybercab, etc.;
Based on cameras + end-to-end neural networks, costs are low, generalization ability is strong, but interpretability is weak (AI black box issue), and regulatory scrutiny is stricter;
3) "Chinese faction" and vehicle-road-cloud integration:
Representatives: Baidu Apollo, Pony.ai, WeRide, etc.;
Relying on vehicle-road collaboration (roadside sensors, V2X) and policy support from urban road network data, achieving rapid scaling and gross profit breakeven in specific cities, with outstanding cost control.
The industry still faces technical bottlenecks (long-tail scenarios, safety reliability) and regulatory uncertainties. Several Robotaxi accidents in 2025 have sparked discussions on tightening regulations, indicating that full commercialization still requires time.
3.5.2 Waymo Business Positioning and Latest Developments
Waymo is a subsidiary of Alphabet focused on Level 4 autonomous driving, originating from the Google self-driving car project launched in 2009, primarily focusing on:
C-end Robotaxi mobility services (Waymo One);
Future potential freight and B-end mobility solutions.
In terms of financial structure, Waymo is included in Other Bets along with Verily, Calico, and X:
In 2024, Other Bets had annual revenue of $1.648 billion and an operating loss of $4.444 billion;
In the first nine months of 2025, revenue was $1.167 billion, slightly down year-on-year;
Waymo is generally viewed as the largest and most promising project for commercialization within Other Bets, but it is still positioned as "high investment, early revenue, long-term option."
Operational scale and expansion:
City coverage: Providing commercial Robotaxi services in cities like Phoenix, San Francisco, Los Angeles, Austin, and Atlanta;
Fleet size: As of November 2025, the operational fleet consists of about 2,500 vehicles (mainly modified Jaguar I-PACE models);
Driving and passenger transport:
Announcement: Over 100 million miles of autonomous driving completed on public roads;
By the end of February 2025, disclosed over 200,000 rides per week, with cumulative paid rides exceeding 10 million in 2025.
Latest expansion:
In November 2025, California expanded Waymo's driverless permit scope, allowing it to operate driverless in a larger Bay Area and Southern California region, covering approximately 47,493 square miles;
Approved to provide driverless services on major highways (101, 280) and routes to airports, significantly expanding the urban operational network;
The sixth-generation hardware platform (Waymo Driver Gen 6) has upgraded sensors and computing power while significantly reducing costs, laying the foundation for large-scale deployment.
3.5.3 Financial Contribution and Mid-term Trends
Alphabet does not disclose Waymo's revenue separately, only providing the overall figure for Other Bets:
In 2024, Other Bets had revenue of $1.648 billion and an operating loss of $4.444 billion;
In Q4 2024, Other Bets had quarterly revenue of about $400 million and an operating loss of $1.2 billion;
Third-party estimates suggest that Waymo's mobility revenue in 2024 was about $125 million, expected to exceed $1.3 billion by 2027.
Alphabet has not disclosed Waymo's financial data separately, but Waymo is included in the Other Bets segment. Between 2023 and 2025, Other Bets' annual operating losses have consistently remained around $4 billion, while revenue is only in the low billions. Given that Waymo has the longest investment time, the highest capital and operational costs in Other Bets, and its commercialization revenue is still at a low level, the market generally views Waymo as one of the main sources of losses in this segment, continuously dragging down Alphabet's overall profits.
Operational and revenue curve (third-party estimates):
Rider-only annual mileage: approximately 8 million miles in 2023 → 40.8 million miles in 2024 → expected to reach 324 million miles by 2027 (compound growth rate close to 100%);
Annual paid rides: approximately 5.69 million in 2024 → expected to reach 15.4 million in 2025 → about 48 million in 2027;
Revenue: approximately $125 million in 2024 → expected to exceed $1.3 billion by 2027.
Although these figures are estimates, they indicate a trend: the scale is still small, the growth curve is steep, transitioning from "pilot" to "regional business."
Capital and cost curve:
From 2020 to 2024, cumulative external financing was approximately $11.1 billion, with the most recent fundraising of $5.6 billion in October 2024, post-investment valuation exceeding $45 billion;
The sixth-generation hardware significantly reduces per-vehicle costs, but the overall model remains capital-intensive and operationally heavy;
The mid-term key points are: hardware cost reduction + vehicle utilization improvement + urban replication, and whether it can gradually improve unit economics.
3.5.4 Competitive Landscape, Moat, and Risks
US Market:
Waymo is leading in the number of cities, fully driverless operation mileage, and paid rides;
General Motors' Cruise has had its license suspended due to accidents, making it difficult to pose a threat in the short term;
Zoox operates free experience projects in places like Las Vegas, but its scale lags behind;
Tesla plans to launch Cybercab in 2026, but its technical route (pure vision) and regulatory feasibility remain controversial, making it a potential major challenger to Waymo in the long term.
China and other regions:
Baidu Apollo Go provides Robotaxi services in over a dozen cities, including Wuhan, Beijing, Shanghai, Shenzhen, and Chongqing, with order volumes exceeding 1.4 million in Q1 2025, about 50-60% of Waymo's;
Various institutions predict that Robotaxi software revenue could grow several times over the next 20 years, but the current global market size is still less than $1 billion.
Waymo's moat:
Technology and data accumulation: >100 million miles of autonomous driving mileage, massive simulation and rider-only VMT (pure driverless mileage without safety drivers) data, creating algorithmic and safety advantages;
Integrated hardware and software design, self-developed sensors and computing platforms, with long-term cost optimization potential;
Synergy with Alphabet's ecosystem: Maps, AI, and cloud infrastructure provide computational power and data support.
Key risks:
Unit economics remain unproven, with external doubts about whether "billions of dollars in investment can be recouped through operations in dozens of cities";
Safety and public opinion risks: A serious accident could lead to license freezes, putting pressure on expansion pace;
Policy and social acceptance: Local governments and residents' concerns about traffic safety, employment, and privacy may slow down the scaling process.
3.6 The AI Industry and Alphabet's AI Business Line
Before analyzing the AI industry and Alphabet's "AI business line," it is necessary to define "what is the AI industry" and its components.
3.6.1 Global AI Industry Structure and Evolution
1) Industry Composition and Scale Breakdown
The AI industry presents a structure of "heavy infrastructure, rapidly rising applications," which can be divided into infrastructure layer, model and platform layer, and application and service layer:
Infrastructure layer (approximately 45-50%, $135-150 billion):
Computing chips: GPUs (NVIDIA Blackwell/Rubin), various ASICs (such as Google's TPU);
Servers and networks: high-density AI servers, high-bandwidth memory, optical interconnects;
Energy and data centers: liquid-cooled data centers modified for AI loads.
Features: Currently the best cash flow and highest certainty segment, with strong training demand, but inference computing expenditure has already accounted for >40% and is continuously rising.
Model and platform layer (approximately 20-25%, $60-75 billion):
Basic large models: OpenAI, Google Gemini, Anthropic Claude, Meta Llama, etc.;
MLOps (Machine Learning Operations) and toolchains: vector databases, data labeling, model hosting platforms;
Cloud service AI increments: Azure AI, Google Cloud Vertex AI, AWS Bedrock, etc.
Features: API price wars are fierce, with general model API call prices dropping by about 80% in a year, and the impact of open-source models is significant, showing a trend of "commoditization."
Application and service layer (approximately 30%, about $90 billion):
Enterprise applications: CRM with embedded agents, office suites, code assistants, etc.;
Consumer applications: search, companionship applications, creative tools, etc.;
Vertical solutions: AI pharmaceuticals, legal contract review, financial risk control, etc.
Features: Fastest growth, having transitioned from tech toys to commercial monetization, with enterprises beginning to pay for "capable intelligent agents."
2) Growth Rate: From Explosion to Deep Water
Overall growth rate: Maintaining at 26-30% in 2024-2025;
Separately, the application layer growth rate is >35% (third-party estimates), the infrastructure layer is about 25%, and the model layer is about 20%, corresponding to explosive and mature phases;
The business model is evolving from "charging per head for SaaS" to "charging based on work results," with typical cases like Intercom, Salesforce Agentforce, Sierra, Adobe Firefly, Waymo, leading to significant savings in labor costs and a service delivery charging model, rapidly increasing AI penetration across industries.
3) The Paradox of the "Seemingly Unprofitable" Model Layer and Structural Opportunities:
API unit prices are declining, open-source model impacts, and price wars are leading to a downward trend in "revenue per token," but leading platforms can still:
Reduce unit costs through economies of scale and technological advancements;
Increase ARPU by bundling PaaS/SaaS, charging for agents/workflows;
Gain long-term bargaining power by binding cloud infrastructure and developer ecosystems;
The future landscape is likely to be: a few model platform giants + a batch of vertical industry model solution providers making profits, while a large number of low-differentiation general models gradually die out.
4) Four Major Trends from 2026 to 2030: 1) From Chat to Action: The era of agents is fully arriving, with AI directly "doing work," promoting the further popularization of pay-for-results models, and reducing the proportion of labor costs in enterprises; 2) From Cloud Dominance to Edge-Cloud Collaboration: Edge AI explosion, with smartphones and computers as edge computing centers, leading to a wave of AIPC/AI smartphones; 3) From Training Computing Power to Inference Computing Power: Electricity and energy become new bottlenecks, with new energy infrastructure like SMR (small modular reactors) becoming key tracks; 4) The Rise of "Sovereign AI": AI's comprehensive capabilities become a national-level core capability and competitive key, with the importance of "AI autonomy" further increasing, and governments and sovereign funds investing heavily in local models and computing infrastructure.
Overall, the AI industry is at a turning point of "gradually improving infrastructure and applications beginning to commercialize":
The infrastructure layer remains a cash cow, but the explosive growth phase has passed;
The application layer will be the main battlefield for the next batch of trillion-dollar giants after 2026;
The model and platform layer is gradually evolving into a new type of infrastructure characterized by "high investment, high economies of scale," with a few leading players capturing the majority of profits.
3.6.2 AI Industry Bubble Assessment
Before assessing the "AI bubble," we first need to answer two questions:
What is the AI bubble?
How serious is the AI bubble, and how will it affect our assessment of Alphabet?
After clarifying these two questions, we can evaluate the key issues:
What is the current level of the AI bubble?
How does the current level of the bubble actually affect Alphabet's valuation and future?
What is the AI bubble?
The AI bubble refers to the significant overestimation of expectations, stock prices, and capital investments surrounding artificial intelligence compared to the real cash flows and productivity improvements that can be generated in the foreseeable future.
Bubble proponents argue that the value creation and efficiency improvements brought by AI are not as high as currently expected. Therefore, the substantial infrastructure investments made based on these overly optimistic expectations, including chip procurement and data center construction, will ultimately lead to significant depreciation of equipment and fixed assets due to insufficient actual demand, directly eroding corporate profits. Additionally, companies in the AI-related industry chain will also need to significantly lower their growth expectations for business revenue and operating profits, leading to a sharp decline in valuation levels.
The anti-bubble camp's view is the opposite or more neutral.
The direct impact of the AI bubble on Alphabet
Alphabet's core narrative today can be summarized in three sentences:
The advertising engine is still operating efficiently (Search + YouTube);
Cloud is growing and turning positive under the push of AI demand;
AI (Gemini + TPU + Vertex + AI Search) is the core of the next stage of growth and moat.
If we believe that AI is in a serious bubble phase, then Google's second and third narratives face the risk of collapse:
Cloud AI demand is overestimated, and growth and profit expectations for GCP, TPU, and Vertex AI need to be discounted;
The fixed assets converted from large-scale AI capital expenditures face significant losses due to value depreciation and faster depreciation rates, leading to a rapid decline in net profits.
Debating the AI bubble: Main points from both sides
Main points of the bubble argument:
Extreme valuation and concentration, with stock market gains heavily reliant on a few AI leaders;
AI-related tech companies now account for about 44% of the S&P 500's market value, contributing about two-thirds of the index's gains in 2025, similar to the internet bubble from the 1990s to 2000;
Capital expenditures are severely ahead of demand, with excessive infrastructure construction;
Global AI-related investments could exceed $5 trillion over the next five years, with Google alone spending nearly $100 billion this year, but downstream demand is expanding slowly, making investments far exceed future revenue potential;
Financial concerns about potential fraud, circularly inflating revenue, and overly optimistic depreciation.
The entire ecosystem has a situation of "supplier financing," where upstream suppliers provide financing to downstream customers to purchase their products (a typical example being NVIDIA's equity investment in OpenAI and CoreWeave, with the latter two purchasing GPUs from NVIDIA). In this case, NVIDIA gains orders (revenue) and equity in the invested companies on its balance sheet, making its financial reports look good in the short term. However, if downstream AI demand does not keep up and downstream companies face operational difficulties, not only will orders shrink, but the value of their equity will also depreciate. Additionally, most leading cloud providers like Microsoft, Google, and Amazon generally adopt a depreciation period of 5-6 years for equipment. However, due to the rapid product iteration of chips like GPUs, the optimal performance utilization time is only about 3 years (after which they handle lower-difficulty tasks). Notable Wall Street short-seller Michael Burry believes this approach underestimates annual depreciation in the short term and exaggerates the company's net profit, constituting a form of financial fraud.
Conversely, the main reasons for believing that the current bubble is not high/reasonable are:
- The profits and cash flows of current AI leaders are real, not the "zero-profit market dream rate" of 2000.
Currently representative AI companies, whether upstream chip developers like NVIDIA and manufacturers like TSMC, or midstream cloud platform giants like Google, Amazon, and Microsoft, all have strong profitability and cash flow, unlike internet companies during the bubble period, many of which were not yet profitable and spent mostly on financing. If we only look at PE multiples, the forward P/E ratios of current leading companies for the next year are mostly in the range of 30-40 times or even lower. Although this is higher than historical averages, it is still far better than during the internet bubble period. More importantly, aside from NVIDIA, other large companies like Google, Microsoft, and Amazon still derive the majority of their revenue and profits from traditional businesses (although the contribution from AI businesses is rising rapidly). Even if the logic of the AI industry were to be completely disproven (which is nearly impossible), they still have a strong business foundation to support their market value, making it difficult to replicate the situation in 2000 when many companies saw declines of over 70% or even 90%.
- Technology and demand are "hard"; AI is bringing visible productivity and revenue.
Microsoft CEO Satya Nadella recently stated that Azure's revenue growth due to AI is nearing or exceeding 40%. This claim has also been confirmed by companies like Meta and Google, as well as major Chinese firms like Tencent and Alibaba. In recent financial reports and earnings calls, company executives have stated that AI has directly or indirectly improved the profitability and efficiency of their core businesses. If the efficiency gains from AI for large companies can still be considered rare cases, I believe another type of data better illustrates the rapid growth of AI demand: the AI service offerings (including computing power) from major cloud providers are in a state of supply shortage, with main chips fully loaded, and even older GPU products still in service. For example, in the Q3 2025 earnings call, Alphabet's management stated that Google Cloud's unfulfilled orders reached $155 billion, a 46% quarter-over-quarter increase and an 82% year-over-year increase, emphasizing that "this growth is primarily driven by AI demand." In the same month, Alibaba's CEO Wu Yongming also stated, "The current pace of AI server launches on Alibaba Cloud is severely lagging behind the growth rate of customer orders, and the backlog of orders is continuing to expand, with future potential still accelerating." If NVIDIA's optimism about AI can be seen as "the tail wagging the dog," then the real monetary purchases by downstream enterprise customers for AI cloud resources reflect the current reality of the AI industry—demand is real and indeed growing rapidly, primarily concentrated in the enterprise sector.
- Depreciation impact is limited; recurring revenue is real investment and accounts for a small proportion.
Looking at the "depreciation fraud" argument, it may be true that setting a uniform depreciation period of 5-6 years for the fixed asset category "servers/network equipment," which includes AI hardware, is a bit long. However, we must consider two points: 1. AI chips are only a part of "servers/network equipment" (roughly estimated at 40-60%). Even if this portion of assets has a rapid product iteration cycle, the core service life may be around 3 years. However, other complete server/network/data center infrastructure, viewed through a 5-8 year accounting lifespan, is reasonable. Moreover, even if high-end AI chips are replaced due to product iteration, they can still serve low-value tasks that do not require high efficiency, meaning their actual lifespan is likely longer than 3 years (in a context of supply exceeding demand, the "expansion" of computing power is more important). Therefore, while setting the overall depreciation period for "servers/network equipment" at 5-6 years may be slightly long, it is not outrageous. 2. Even if we calculate the depreciation period for chips at 3 years, the corresponding underreported depreciation amount would only be in the tens of billions per year, which is negligible compared to the over $100 billion net profit of leading AI companies, resulting in a single-digit percentage impact. For example, if we calculate Google's capital expenditure for 2025 at $91-93 billion (the latest estimate from management's Q3 earnings call), assuming that 50% of this is for rapidly depreciating AI chips, that would correspond to $45.5 billion. If we change the depreciation period from 6 years to 3 years, the additional annual depreciation amount would be $7.58 billion, which only accounts for 6.1% of Google's annual net profit (TTM) of $124.2 billion. Even if we include the depreciation of AI-related capital expenditures from 2023 and 2024, the cumulative expected impact would be around 10%, which is not a decisive blow to profits.
Now looking at the issues of recurring revenue and supplier financing, this issue is actually not closely related to Google, with the main target of criticism being NVIDIA. Critics argue that NVIDIA provides financing to its downstream customers, allowing them to use the funds to purchase NVIDIA's GPUs, thereby artificially inflating revenue and boosting stock prices. However, if we examine NVIDIA's actual investment cash flow, in its Q1 2025 financial report, the amount for "purchases of non-marketable equity securities" was $1.486 billion, while its corresponding annual revenue (TTM) was $130.5 billion, meaning the former accounted for only 1.14% of the latter. Assuming NVIDIA's external investment purpose is indeed to enable these companies to directly buy GPUs (which is not the case; it is more about consolidating the CUDA ecosystem in the long term), its contribution to revenue can be considered negligible. As for the strategic plan disclosed by NVIDIA and OpenAI in September this year, which involves a maximum investment of $100 billion, according to NVIDIA CFO Colette Kress on December 2, this investment agreement has not yet been finalized, and thus has not had any actual financial impact.
Considering both positive and negative viewpoints, my perspective on the AI bubble and its impact on Alphabet at this current point in time is:
AI technology and demand are real, and it is a direction that Alphabet must embrace in the long term. Missing out on it could likely lead to exiting the table of leading players, a risk that far outweighs the limited losses from equipment depreciation caused by excessive capital investment.
The fundamental risk in the industry is the actual demand for downstream AI applications being insufficient, leading to significant capital investments facing asset write-downs or massive depreciation in the short to medium term. From this perspective, the companies with the highest risk are those like CoreWeave, which are heavy asset, high-leverage (with significant debt financing), and solely focused on the AI sector. Other similar companies include Lambda.
For companies like Alphabet (as well as Microsoft, Amazon, and Meta), the risks are much smaller. On one hand, their main revenue and profits are stable, providing a good profit buffer. Secondly, even if the value of AI fixed assets on their balance sheets is significantly written down or depreciated, the absolute amount of the write-down is relatively small compared to their market value. Finally, if the downstream demand released by AI is insufficient, then the currently widely estimated future growth rate of over 20% for AI model layer revenue will certainly slow down, and the valuations of AI leaders represented by Alphabet will also face a correction. However, considering that even before the explosion of large models, their P/E ratios (TTM) have consistently remained in the range of 20-30 times (in previous years, due to antitrust lawsuits and concerns about GPT-like products impacting Google search ads, it dropped to around 18 times), the downward valuation space is also relatively limited.
3.6.2 Alphabet's AI Business Line
Google's AI is not a standalone division but rather a "foundation" that spans across various main lines of Alphabet. From the perspective of AI, it can be divided into three categories:
Models and Research: Google DeepMind/Research is responsible for the development and training of foundational models like Gemini, Imagen, and Veo;
Product Monetization:
Search & Ads: AIOverviews, AIMode, AIMax in Search, etc., are changing the forms of search and advertising;
YouTube: Recommendations, content understanding, ad targeting;
Cloud: Gemini API, Vertex AI, AI Hypercomputer (integrated computing power + storage + network);
Endpoints: Pixel + Gemini Nano (edge-side inference);
Waymo: Autonomous driving perception and decision-making models.
AI Infrastructure and Chips: Self-developed TPUs (v1–v7), Axion CPUs, Jupiter network (Google's self-developed high-speed network architecture for data centers), and optical interconnects, which serve as the computational foundation for all of the above.
From a financial perspective, AI revenue is mainly "buried" within Search & Ads, Cloud, and other business segments, without separate disclosure. However, from the growth rates of various businesses and the continuously expanding capital expenditures, it is evident that AI has become a core capital focus and growth driver for Alphabet.
Business data and capital expenditures (Q3 2025):
Cloud: Q3 2025 revenue of $15.2 billion, a year-on-year increase of 34%. Media outlets like Reuters generally attribute this acceleration to "strong demand for AI infrastructure and services (including the Gemini model)";
Search and YouTube: Q3 search and YouTube ads grew by about 15%, with AIOverviews, AIMax, PMax, and other AI features being one of the core drivers;
Subscriptions and Other Services: YouTube/Google One subscription revenue growth >20%, also benefiting from AI's contributions to recommendations and enhanced experiences.
Capital Expenditures:
Alphabet plans to spend $75 billion on capital expenditures in 2025, with subsequent guidance raised to $91-93 billion, far exceeding the $52.5 billion in 2024;
The official focus is clearly on "supporting AI research and its implementation in services like search and cloud";
Executives recently stated in an employee meeting that the company must "double AI service capabilities every six months," aiming for a 1000-fold increase over the next 5-6 years, effectively writing continuous capacity expansion into operational goals.
Market Position of Custom AI Chips (TPU):
In the AI data center chip market, NVIDIA holds about 75-80% market share, with the remainder mostly represented by Google's TPU and self-developed ASICs (around 10-20%) and a small amount from AMD;
As of now, Google does not directly sell TPU chips but rents out computing power through Google Cloud (however, it has begun discussions with major companies like Meta to deploy TPUs directly in their data centers by 2027):
The value of TPUs is primarily reflected in the increase in Cloud revenue and internal service gross margins, rather than traditional chip sales;
The self-developed and scenario-focused TPU + Jupiter network allows Google to outperform standard NVIDIA GPU solutions in terms of performance/cost ratio in certain scenarios.
Major Customer Cases:
The most typical and currently the largest in scale—Anthropic: In October 2025, Anthropic announced an expanded agreement with Google Cloud, planning to use up to 1 million TPUs to train and serve Claude, with a contract value in the hundreds of billions, making it the largest TPU commitment from Google to a single external customer to date;
Others: Cohere (a customized large model platform for enterprises), Midjourney has migrated some inference workloads to TPU v5e/v6e for better cost performance (for example, Midjourney's inference costs reduced by ~65%, and Cohere's throughput increased by about 3 times);
As for the recently much-discussed collaboration with Meta, it is still in the negotiation stage and has not been formally confirmed.
However, the majority of TPU usage is still internal: Gemini/GWS (search, YouTube, advertising), Photos/Maps, and research/product lines like DeepMind/AlphaFold are all running TPUs on a large scale. But TPUs have evolved from internal tools to viable external alternatives, forming substantial competition for NVIDIA GPUs and providing a long-term source of revenue for Google Cloud AI.
Summary: In the global three-layer AI structure, Alphabet occupies:
Infrastructure Layer: Self-developed TPU/Axion + Jupiter network + data centers;
Model and Platform Layer: Gemini series and Vertex AI platform;
Application and Service Layer: Software/hardware entry points like search, YouTube, Workspace, Android/Pixel.
This is also why it is regarded as an "AI full-stack platform." Although the price war for model APIs and the impact of open-source have compressed the profit margins of "purely selling models," for Alphabet, AI has been deeply embedded in advertising, cloud, and subscription lines:
On the revenue side, growth is driven by enhancing product capabilities and expanding new scenarios;
On the cost and structural side, self-developed chips and infrastructure optimization release operational leverage, reducing costs and increasing efficiency;
On a strategic level, AI is the key factor that will determine its success or failure in the "new software stack" battlefield over the next 5-10 years.
3.6.3 Key Question: How much market share can Google's TPU architecture capture from NVIDIA?
Regarding this question, we will explore three aspects: 1. The advantages and disadvantages of TPU compared to NVIDIA's GPU architecture; 2. Alternative scenarios; 3. Share projections for the next 3-5 years.
- Advantages and Disadvantages of TPU Compared to NVIDIA's GPU Architecture
TPU's Main Advantages
a. Cost & Energy Efficiency (especially in large-scale clusters)
TPU is a self-developed ASIC by Google, deeply customized for matrix operations and Google's own software stack. In terms of computing performance/energy consumption, it typically outperforms contemporaneous NVIDIA GPUs for specific workloads (large model training + inference).
For a company like Google, which spends tens of billions on computing power costs annually, even a 20-30% overall cost advantage is strategic—TPUs exist to eliminate the passive tax on NVIDIA's margins.
b. Consistency and Controllability in Large-Scale Clusters
TPU Pods are designed from the outset as "clusters of hundreds of thousands to millions of chips" planned as a whole, with interconnects, topology, and scheduling designed uniformly.
For tasks like training/inference of models such as Gemini and Claude that run on tens of thousands of accelerators, TPUs have inherent advantages in training stability, inter-chip communication, fault tolerance, and scheduling.
TPU's Disadvantages
a. Ecosystem: Far Inferior to CUDA
The entire deep learning ecosystem built over more than a decade, including toolchains, frameworks (like PyTorch, JAX), libraries, and community optimization practices, revolves around CUDA. Even though XLA/JAX (XLA is Google's self-developed computing compiler) works well on TPUs, the breadth of the ecosystem, the number of tutorials, the number of ready-made projects, and third-party tool support cannot compete with GPU + CUDA.
For developers/companies currently in the CUDA ecosystem, the migration cost is a direct "real money" expense. Transitioning a mature PyTorch + CUDA system to TPU/XLA incurs costs that include: engineering costs (rewriting/adapting training scripts, distributed strategies, inference services, monitoring and alerting, deployment toolchains), models and libraries (many third-party libraries, ops, and inference optimization plugins are written around CUDA; they either do not exist on TPUs or require finding alternatives), and team mindset and skills (engineers are already very familiar with NVIDIA's toolchain and tuning methods—new systems mean starting over and trial and error). For many startups/small teams, human resources are the most scarce, and the time of engineers is often more valuable than the savings on cloud bills. If performance/stability issues arise during the migration process, the business risks are borne by them. Therefore, this calculation only makes sense when two conditions are met: the computing bill is large enough (in the tens of millions to hundreds of millions), and the model will exist long-term and undergo multiple iterations, allowing migration costs to be amortized over several years. This is why TPU's customers are mostly large enterprises.
b. Availability: TPU is Only Available on Google Cloud (Currently)
TPUs mean that the potential customer base for TPUs is limited to the market share of Google Cloud (currently about 13% of public cloud IaaS/PaaS), while NVIDIA GPUs can run on AWS/Azure/GCP/self-built data centers/various small clouds/local clusters.
For most enterprise CIOs, adopting a "multi-cloud strategy" and "avoiding lock-in" has become a consensus, which naturally favors choosing GPUs that can operate across clouds and on-premises.
Although Google has hinted at considering directly selling TPUs for deployment in enterprise-owned data centers in the future, this is more of a privilege for a few extremely large customers (like Meta).
c. Flexibility and Compatibility are Worse
GPUs are general-purpose parallel computing accelerators that can run training, inference, graphics, scientific computing, and various model architectures;
TPUs focus on matrix-dense training and inference, with far less support for "non-mainstream architectures/novel operators/niche workloads" compared to GPUs;
For teams pursuing rapid experimentation, heterogeneous models, and research purposes, GPUs remain the default option.
d. Iteration Pace is Slower
NVIDIA has essentially entered an "annual update" rhythm (Hopper → Blackwell → Rubin) and is iterating repeatedly at the packaging, interconnect, and system levels;
TPU updates occur at a relatively slower pace (typically every 1.5-2 years).
- Scenarios Where TPU Can Actually Replace GPUs and Typical Customers
The scenarios most likely to migrate to TPUs include:
a. Large Model Training: Extremely high computing consumption, cost-sensitive, and less dependent on the ecosystem
Typical Characteristics:
Repeated training/iteration of "one or a few large models" (not hundreds of small models mixed), with long-term stable business;
Model architectures are relatively standardized (Transformer/MoE variants);
Internally possess a strong engineering team capable of bearing migration costs.
Typical Customers:
Anthropic—signed a contract for up to a million TPUs, currently the largest external customer for TPUs based on publicly available information.
Some self-developed large model SaaS/cloud vendors (for example, some training tasks from Salesforce and Cohere).
b. Large-Scale Inference: High concurrency, extremely sensitive to cost and energy efficiency
Typical Characteristics:
Search, advertising, recommendations, feeds, long text/multimodal generation, large-scale online Q&A;
"Cost per token" directly determines gross margins;
Extremely high requirements for latency and throughput.
Typical Customers:
Google itself: Search/YouTube/Ads/Workspace;
Some large AI application providers (finance, content platforms, etc.) willing to fully commit to Google.
Scenarios Where GPUs Are Difficult to Replace:
A large number of small to medium models, experimental projects, and research purposes, where the GPU ecosystem advantages dominate;
Large enterprises requiring "multi-cloud + on-premises hybrid deployment";
Research teams using a lot of non-standard operators and custom kernels;
C-end startups (the first reaction is almost always to choose AWS/Azure + GPU, as the team's talent path is "PyTorch + CUDA").
- Share Projections for TPU vs. NVIDIA in the Next 3-5 Years
Let's first look at the general landscape for 2025:
Training Side:
Nvidia GPU: ≈ 90%
TPU: ≈ 2-3% (mainly Google internal + Anthropic, etc.)
Others (AMD/Trainium/MI300/ASIC): remaining small share
Inference Side:
Nvidia GPU: >80%
TPU: single digits to 10% (highly concentrated in Google internal)
Others (AMD/CPU/FPGA/self-developed accelerators): several diversions
Overall, Nvidia is an absolute monopolist at around 90%, while TPU currently serves as a "significant but limited impact" second pole.
Projections for the landscape in 3-5 years, if I were to provide a relatively neutral range:
For the training market:
Nvidia GPU: drops from 95%+ to 75-80%
Google TPU: increases to 10-15%
Others (Trainium+MI+ASIC): 5-10%
Factors driving share changes:
Increased TPU usage scale from single customers like Anthropic and Meta;
Continued growth in Google's own training usage;
Some enterprises wishing to reduce single-point dependency on Nvidia for cost or strategic reasons.
For the inference market:
Considering the gradual maturity of training, the slowing iteration speed of large-scale training, and the continuous explosion of demand on the application side, the future inference market will be much larger than training, making TPU's penetration more evident:
Nvidia GPU: drops from 80-85% to 60-70%
Google TPU: increases to 15-20%
Other dedicated inference chips/ASIC/CPU+NPU: 10-20%
Factors driving share changes:
Continued growth of internal inference volume at Google;
Inference services being more sensitive to success, with an increase in external Google Cloud customers;
Other clouds (AWS/Azure) with their own Trainium/Inferentia also becoming more mature, even starting to output externally, thus capturing some GPU market share.
So, in summary (training + inference):
Nvidia: drops from today's ~90% share to a range of 65-75%;
Google TPU: rises from ~2-3% to a range of 12-20%;
Others (AWS/AMD/self-developed ASIC): together capturing the remaining 10-20%.
This means:
TPU has the potential to grow from "marginal second" to "significant second pole" in the next 3-5 years, likely capturing about 10-20 percentage points of market share from Nvidia. However, Nvidia will still remain the absolute leader unless there is a paradigm-level architectural shift (for example, a completely new paradigm of non-Transformer AI becoming the new mainstream).
### 4. Management and Governance Structure
4.1 Core Management Team and Stability
Alphabet has an experienced and overall stable leadership team.
Current CEO Sundar Pichai joined Google in 2004, became CEO of Google in 2015, and has served as CEO of Alphabet since 2019, having worked at the company for over twenty years and deeply familiar with its culture and business. During his tenure, the company has successfully transitioned multiple times from "desktop-first" to "mobile-first" and then to "AI-first," maintaining steady growth in core businesses such as search advertising, YouTube, and cloud computing.
In terms of management style, Pichai is more akin to a "professional manager of a super-scale tech group":
His strengths lie in emphasizing operational efficiency, cost discipline, and the continuous strengthening of existing moats—this includes safeguarding the profitability of search and advertising businesses, narrowing cloud business losses, and implementing large-scale layoffs and cost restructuring;
There are also criticisms in the market, suggesting that he is relatively conservative in risk-taking and betting on disruptive innovation, which has led Google to lag behind Microsoft and OpenAI in the pace of generative AI commercialization. This controversy was particularly prominent during the industry upheaval triggered by ChatGPT in 2022-2023.
Co-founders Larry Page and Sergey Brin stepped down from day-to-day management in 2019 but still serve as directors and retain significant influence over the company's major strategic directions. During the AI wave from 2023 to 2025, Brin has significantly increased his involvement in AI projects, with multiple media reports indicating that he returns to the office almost daily, intensively participating in the work of the Gemini/Google DeepMind team, and urging AI employees internally to "come to the office at least five days a week and work about 60 hours" to accelerate the pace of the AGI race.
On the CFO front, Ruth Porat, who has long served as CFO, transitioned to President and Chief Investment Officer of Alphabet and Google in September 2023, responsible for the company's investment portfolio (including GV, CapitalG), Other Bets, real estate, and workspace management, playing a key role in communication with regulatory and government agencies in various countries. In the context of tightening antitrust regulations and rising geopolitical uncertainties, her deep connections and experience on Wall Street and in Washington remain important assets for the company.
Anat Ashkenazi, who succeeded Porat as CFO, joined Alphabet on July 31, 2024, from pharmaceutical giant Eli Lilly. She led long-term capital expenditure decisions related to R&D and capacity expansion at Eli Lilly, familiar with "high investment, high uncertainty" portfolio management. The outside world generally believes this aligns with the current characteristics of investment in AI model development and data center construction. Since taking office, she has repeatedly emphasized in public that while maintaining high-intensity investment in AI and cloud infrastructure, it is essential to support long-term profitability by reshaping the cost structure and improving resource efficiency. In Q3 2025, Alphabet significantly increased capital expenditures while achieving an operating profit margin increase from 32.3% to 33.9%, reflecting that the "high investment + high discipline" financial management approach is being implemented.
Overall, despite changes in management in the CFO position and a few other key roles over the past two years, Alphabet's core leadership has maintained a high degree of continuity in personnel composition and strategic orientation. In response to the macroeconomic slowdown and the pressure of increased AI investments on cost structures, the company has demonstrated a certain level of cost adjustment determination and execution through layoffs of about 12,000 people, approximately 6% of its workforce, starting in 2023, along with subsequent small-scale structural layoffs in 2024.
4.2 Corporate Governance Structure
Alphabet employs a multi-tiered equity and voting rights structure. The company currently has three classes of shares:
Class A common stock (GOOGL): 1 vote per share, publicly traded;
Class C stock (GOOG): no voting rights, publicly traded;
Class B stock: 10 votes per share, held only by founders and a few insiders, not publicly traded.
Under this structure, although Larry Page and Sergey Brin together hold less than 10% of the economic rights, they control over 51% of the voting rights through Class B super-voting shares, along with other insiders, thus maintaining de facto control over the board composition and major strategic directions.
This structure of "dispersed economic rights, highly concentrated control in the founders" allows the company to continue making substantial investments in long-term R&D, infrastructure, and Other Bets, even in the face of short-term market fluctuations or public pressure. However, it also continues to raise questions from some institutional investors and governance experts. In recent years, almost every shareholder meeting has seen proposals from shareholders calling for reforms to the dual/triple-class share structure, promoting "one share, one vote," or setting sunset clauses for super-voting rights. The external shareholder approval rate is often around 90%, but due to the founders' control of the actual majority of voting rights, these proposals have yet to pass.
In the structure of common stock shareholders, passive index funds and large asset management companies (such as Vanguard, BlackRock, Fidelity, etc.) are the main external shareholders of Alphabet, but due to their inferior voting rights, their direct influence on major company decisions is limited. The company formally establishes audit and compliance committees, compensation committees, and nomination and governance committees composed of independent directors, and has developed a set of corporate governance guidelines to enhance board independence and transparency.
In terms of capital return policy, Alphabet launched its dividend plan for the first time in 2024, announcing a quarterly cash dividend of $0.20 per share, while also authorizing an additional $70 billion in stock buybacks, marking a shift in capital allocation from "single buyback" to a dual approach of "buyback + dividend." In Q4 2024, the company returned approximately $17.5 billion to shareholders through the repurchase of about $15.1 billion in stock and the payment of about $2.4 billion in dividends, with total capital returns for the year approaching $70 billion; starting in 2025, the quarterly dividend was further slightly increased to $0.21. This series of actions indicates that while maintaining high-intensity capital expenditures in AI and cloud, the management is also actively responding to long-term shareholders' demands for cash returns and governance improvements.
In summary, Alphabet's governance model highly reflects the characteristics of "founder control + strong management + high capital return": founders lock in long-term strategic control through super-voting rights, the board maintains a certain level of independence and compliance structure in form, and common shareholders primarily share in the company's growth through stock price performance and cash returns, with limited voice in changes to the governance structure itself.
### 5. Core Competitiveness and Moat Analysis
The fundamental reason Alphabet can maintain a leading position in the highly competitive tech industry over the long term lies in its construction of a composite moat across five dimensions: "traffic entry, intent market, multi-product ecosystem, technological infrastructure, and data flywheel." As the company enters the AI era, it seeks to reinforce these existing moats through full-stack AI capabilities.
5.1 Endpoints and Traffic Entry: Default Settings + Usage Habits
Alphabet has at least 7 products with over 2 billion active users for more than 20 months, including the Chrome browser, Android system, Google search bar, YouTube app, Gmail/Maps, etc., which together form the "internet entry layer" for users. The first reaction of a large number of users when "seeking information / watching videos / navigating / sending emails" is to open products within the Google ecosystem, creating strong product usage habits and mindsets. Unless there are products that are significantly better than Google's offerings, users are unlikely to change their behavior.
The role of AI enhancement:
Embedding Gemini / AISearch / AI into Maps, Gmail, and Android means that "as long as you open Google's entry point, you can directly use AI," and improving the user experience of these products through AI will keep the "entry moat" effective in the AI era—users do not need to download new apps or switch platforms.
5.2 Search and Advertising "Intent Market": Still the Main Choice for Advertisers
Google's core asset remains capturing "search intent with a willingness to pay" and matching advertisers' needs within the market mechanism. Although GPT-like products provide a new AI question-and-answer experience and have gained a massive user base, they have not yet formed a mature, reliable, and ROI-clear intent market. Google remains the primary choice for advertisers in intent search matching.
The role of AI enhancement:
The most direct effect is reflected in Google's provision of AI question-and-answer experiences of equal quality to GPT through Gemini, AIoverview, and AI modes in search functions, retaining a large number of users who might have migrated. Additionally, AI's ability to automate ad placement optimization (automatic bidding, automatic creative, automatic audience segmentation) has significantly improved ad performance and revenue, and there are already attempts to embed new ad placements like "sponsored answers" and "product cards" in the new AI search format. Although this has not yet been fully rolled out, considering Alphabet's deep experience and vast data/user/advertiser resources in intent and ad matching products, it remains the most promising player to build an advanced AI model advertising platform, likely maintaining its position in the AI era's "intent market."
5.3 Multi-Product Ecosystem and User Stickiness: Daily Work and Life Surrounded by It
Individual users have accumulated a large amount of data assets and highly personalized settings across Search, YouTube, Maps, Gmail, Photos, Drive, Android, Chrome, and account systems. Enterprises operate their digital business through Google Cloud, Workspace (Gmail, Docs, Sheets, Slides, Drive, Meet), Chrome Enterprise, and Android/Chrome. Both individuals and enterprises face high switching costs.
The role of AI enhancement:
Gemini is embedded in various products as an AI assistant, such as the Workspace, Gmail assistant, and writing and analysis assistants in Docs/Sheets. This not only further enhances the user experience of the products but also makes it increasingly difficult for users to leave this ecosystem once the increasingly agent-like AI is fully integrated into personal and enterprise workflows.
5.4 Technology and Infrastructure: From TPU to Full-Stack AI, Scale Effects in the New Era
From end-user applications to TPU clusters, Alphabet possesses full-stack AI capabilities from applications to infrastructure:
Infrastructure layer: self-developed TPU series chips and AI-optimized data centers;
Model and platform layer: Gemini family models and their inference services, as well as unified platforms like Vertex AI, Agent Builder, and Model Garden;
Application and service layer: applications and terminal systems such as Search / YouTube / Chrome / Workspace / Maps / Android.
These layers not only collaborate with each other but also ensure that every unit of capital expenditure ultimately reflects improvements in the experience of all products, with costs shared across the entire product line, creating scale effects in the AI era.
5.5 Data and Feedback Flywheel: High-Value Interaction Data Creating a Better AI Foundation
Search clicks, ad impressions/conversions, YouTube views and interactions, map navigation, and editing behaviors in Gmail/Docs generate massive amounts of high-value user behavior data, which are crucial for training recommendation systems, search ranking, ad engines, and aligning large models. This feedback is further used for parameter tuning, alignment, and model improvement, forming a cycle of "better experience → more usage → more feedback → better AI." For pure model companies (which only obtain limited interaction data through APIs or single apps), replicating this flywheel is very difficult.
Overall, Alphabet's corporate moat is still built on "global traffic entry + search and advertising intent market + multi-product ecosystem and data feedback flywheel," with full-stack AI (TPU, AI data centers, Gemini models, and Vertex platform) serving as an amplifier that spans from underlying infrastructure to upper-layer products: it not only reduces the cost of implementing AI in its own products but also outputs the same capabilities to enterprise customers through Google Cloud, further thickening the company's traditional moat in the AI era rather than replacing it.
### 6. Financial Analysis
Based on the financial data from the past five years, we analyze Alphabet's key financial metrics to assess the company's performance trends and financial health (data in USD). Alphabet is currently in a phase of "recovering to double-digit revenue growth, profitability returning to historical highs, maintaining strong free cash flow under extremely high AI/cloud capital expenditures, and an extremely healthy balance sheet."
*TTM 2025 = Data for the 12 months ending Q3 2025
6.1 Revenue and Growth: Recovering to Stable Double Digits
6.1.1 Scale and Growth Rate
Revenue grew from $257.6 billion in 2021 to $350 billion in 2024, reaching $385.5 billion in TTM 2025, with a four-year compound growth rate of about 11% from 2021 to TTM 2025.
Year-over-year growth rates:
2022: +9.8% (significantly slowed under macro and exchange rate pressures)
2023: +8.7% (mainly due to cyclical recovery in advertising and cloud business)
2024: +13.9% (both advertising and cloud accelerated, with AI starting to contribute)
TTM 2025: +10.1% (continuing to maintain high growth)
Looking at a single quarter, Q3 2025 revenue was $102.3 billion, up +16% year-over-year, marking the first time it surpassed $100 billion in a single quarter.
6.1.2 Structure: Advertising Remains the Main Engine, Cloud and Subscriptions Become the Second Growth Curve
Advertising revenue in 2024 is approximately $264.6 billion, accounting for about 76% of total revenue.
Cloud business revenue in 2024 is $43.2 billion (+31%), with Q3 2025 cloud revenue of $15.16 billion (up +34% year-over-year), becoming the main source of the overall excess growth.
"Subscriptions, platforms, and devices" (including YouTube subscriptions, Google One, hardware, etc.) generated $12.87 billion in revenue in Q3 2025, up +20.8%, with growth rates exceeding the overall average.
Revenue summary: Revenue has recovered to a robust low double-digit growth, with incremental growth increasingly coming from cloud and subscriptions, rather than relying solely on traditional search advertising.
6.2 Profit and Profitability: Returning to or Slightly Exceeding Historical Highs in 2024-2025
6.2.1 Profitability: Gross Margin, Operating Margin, Net Margin
Gross Margin:
- 2021: approximately 56.9% → 2024: 58.2% → TTM 2025: 59.2%, showing a continuous upward trend.
Operating Profit and Operating Margin:
Operating Profit:
2021: $78.7 billion
2022: $74.8 billion
2023: $84.3 billion
2024: $114.2 billion
TTM 2025: $125.9 billion.
Operating Margin:
2021: 30.6%
2022: 26.5%
2023: 27.4%
2024: 32.6%
TTM 2025: 32.7%.
Net Profit and Net Margin:
Net Profit (GAAP):
2021: $76 billion
2022: $60 billion
2023: $73.8 billion
2024: $100.1 billion
TTM 2025: $124.3 billion.
Net Margin:
2021: 29.5%
2022: 21.2%
2023: 24.0%
2024: 28.6%
TTM 2025: 32.2% (partly driven by around $22 billion in investment income/asset disposal gains in 2025).
For Q3 2025: Net profit was approximately $35 billion, up +33% year-over-year, reflecting accelerated profitability in advertising and cloud, with contributions from other income.
6.2.3 Return Rates: ROE / ROA
Annual ROE (GAAP):
2021: approximately 30%
2022: approximately 23-24%
2023: approximately 26%
2024: 30.8%;
As of TTM Q3 2025, ROE is approximately 32%, and ROA is approximately 16%.
Summary: The macroeconomic and cost shocks in 2022 led to a temporary decline in profitability, but from 2023 to 2025, through cost reductions, advertising recovery, and cloud business profitability, profit margins and ROE have fully returned to high levels, demonstrating a strong ability for profit recovery.
6.3 Expense Structure and Operational Efficiency: Cost Control Effective While Maintaining High R&D Intensity
6.3.1 Operating Expense Structure
R&D Expenses:
2021: $31.5 billion
2024: $47.5 billion, TTM 2025: $53.8 billion;
The proportion of revenue increased from about 12% to around 13-14%, reflecting continued high investment in AI, data centers, and cloud.
Sales and Administrative Expenses:
2021: $36.4 billion → 2024: $42 billion → TTM 2025: $48.4 billion;
The proportion of revenue decreased from about 14% to nearly 12%, indicating that economies of scale and the layoffs and cost optimizations in 2023-2024 have begun to show results.
Total operating expenses as a percentage of revenue decreased from over 26% in 2021 to the mid-20% range in 2024-2025, significantly improving operational leverage.
6.3.2 Operational Efficiency
Operating profit margin briefly fell to around 26% in 2022 but stabilized at over 32% from 2024 to TTM 2025, indicating effective "streamlining" in personnel, marketing, and infrastructure depreciation while advertising recovered and the cloud turned profitable.
TTM 2025 ROE and ROA are approximately 32% and 16%, respectively. Given the premise of "a large amount still in the investment phase, with no high debt leverage," this efficiency level is among the top tier in large-cap technology.
Summary: Alphabet has managed to increase its overall operational efficiency while continuously increasing investment in AI R&D through optimization of labor and management expenses.
6.4 Free Cash Flow and Capital Expenditures: Entering a Heavy Capital Expenditure Cycle, but Cash Flow Remains Abundant
6.4.1 Operating Cash Flow and Free Cash Flow
Operating Cash Flow (OCF):
2021: $91.6 billion
2022: $91.5 billion
2023: $101.7 billion
2024: $125.3 billion
TTM 2025: $151.4 billion.
Capital Expenditures:
2021: $24.6 billion
2022: $31.5 billion
2023: $32.3 billion
2024: $52.5 billion (mainly for technical infrastructure, chips, data centers)
TTM 2025: $77.9 billion, with Q3 2025 capital expenditures of approximately $23.95 billion, about 49% of that quarter's operating cash flow.
Free Cash Flow (FCF = OCF – Capital Expenditures):
2021: $67 billion (FCF margin approximately 26%)
2022: $60 billion
2023: $69.5 billion
2024: $72.8 billion
TTM 2025: $73.6 billion, FCF margin approximately 19%.
Key Points:
Operating cash flow nearly doubled from 2021 to TTM 2025, while free cash flow remained stable at over $70 billion.
FCF margin decreased from 26% in 2021 to 19% in TTM 2025, with the compression mainly due to a significant increase in AI/cloud-related capital expenditures, rather than a deterioration in operational quality.
6.4.2 Capital Expenditure Outlook
The CFO raised the full-year 2025 capital expenditure guidance from $85 billion to $91-93 billion in Q2 and Q3 2025, primarily for AI data centers and self-developed/purchased AI chip capacity (TPU + NVIDIA).
Compared to Microsoft and Meta, Alphabet's capital expenditures as a percentage of operating cash flow in Q3 2025 were only about 50%, significantly lower than the 65%+ levels of the latter two, indicating stronger cash flow "buffering capability."
Summary: The company has entered a heavy capital expenditure cycle in the AI era, and a short-term pressure on free cash flow is a reasonable cost; however, supported by $70 billion in FCF and $150 billion in OCF, the strategy of "large investments while also repurchasing and paying dividends" still has a sufficient safety margin.
6.5 Asset Efficiency and Debt Ratio: Asset Expansion Outpaces Liabilities, Maintaining a Net Cash Position
6.5.1 Asset Scale and Asset Efficiency
Total Assets:
2021: $359.3 billion
2022: $365.3 billion
2023: $402.4 billion
2024: $450.3 billion
Q3 2025: $536.5 billion.
Asset growth mainly comes from:
Technical infrastructure increased from $110.6 billion in 2021 to $184.1 billion in Q3 2025; if related construction in progress is included, the total is about $254 billion;
Long-term investments and goodwill increased with acquisitions and equity investments.
The "asset turnover ratio" of revenue to total assets has remained stable in the range of 0.7-0.8, indicating that asset utilization efficiency has been maintained despite significant balance sheet expansion.
6.5.2 Debt Structure and Leverage Level
Total Liabilities:
- 2021: $107.6 billion → 2024: $125.2 billion → Q3 2025: $149.6 billion.
The debt ratio (total liabilities / total assets) has remained in the range of 28-30%, indicating very low overall leverage.
Interest-bearing debt (short + long term) was approximately $30.4 billion in 2024 and about $44.2 billion in Q3 2025, but:
Cash and short-term investments totaled $98.5 billion in Q3 2025,
Net cash remains approximately $54.3 billion, down from $111.1 billion in 2021.
3) Shareholder Returns and Capital Structure
From 2021 to TTM 2025, the company has repurchased a significant amount of stock: approximately $62.2 billion in 2024, and still repurchasing $55.8 billion in TTM 2025, while also starting to pay dividends (dividend expenditure of about $7.36 billion in 2024, nearly $10 billion in TTM 2025).
Despite ongoing large-scale repurchases and high capital expenditures, the company maintains hundreds of billions in net cash, indicating a very robust capital structure, with ample room to continue returning value to shareholders through repurchases and acquisitions in the future.
Summary: Alphabet has a typical "no rigid leverage, very thick cash" balance sheet—during the heavy investment cycle in AI, its asset expansion relies mainly on internal cash flow rather than debt, resulting in very low financial risk.
Overall Conclusion: As of Q3 2025, Alphabet's financial condition can be summarized as—high-quality revenue growth + high profitability + high R&D investment + high capital expenditures + high free cash flow + low leverage. This means the company has the capacity to sustain high capital expenditures during the AI/cloud heavy investment cycle over the next 3-5 years, while also having room to continue repurchases, dividends, and strategic acquisitions, placing its financial health and risk resistance at the top level among global internet leaders.
### 7. Valuation Analysis
We use mainstream valuation metrics such as market capitalization, price-to-earnings ratio (P/E), enterprise value/EBITDA (EV/EBITDA), and PEG, and compare them with peer companies in the industry. We also incorporate DCF cash flow discounting and segment valuation to cross-evaluate Alphabet's current market valuation level.
7.1 Valuation Benchmarks and Data Standards
First, clarify the data benchmarks for valuation:
Reporting Standards: U.S. GAAP, fiscal year is the calendar year.
Time Frame: TTM as of September 30, 2025 (Q4 2024–Q3 2025), stock price and valuation multiples are taken as of early December 2025.
Key Financial Data:
TTM Revenue: $385.48 billion
TTM Net Profit: $124.25 billion, year-over-year +31.8%
TTM EPS (diluted): $10.23 per share
TTM EBITDA: approximately $145.17 billion
TTM Free Cash Flow: $73.6 billion
Market Data:
Stock Price: approximately $321 per share (December 5, 2025)
Market Capitalization: approximately $3.88–3.9 trillion
Enterprise Value (EV): approximately $3.82 trillion
Cash and Short-term Investments: $98.5 billion; Total Debt: $44.2 billion, Net Cash approximately $54.3 billion
Based on this, the following valuation metrics are all based on TTM financial data as of Q3 2025 + stock price in early December 2025.
7.2 Overall Valuation Level: P/E, EV/EBITDA, and Cash Flow Yield
Price-to-Earnings Ratio (P/E, TTM): 31.8 times
Compared to Alphabet's own history: Over the past decade, the P/E has mostly fluctuated in the range of 25-35 times (with a significant compression in valuation in 2022, and a rebound from 2023 to 2025), currently sitting at the higher end of its historical range.
EV/EBITDA (TTM): 26.4 times
In the current interest rate environment, a 26.4x EV/EBITDA corresponds to an approximate 3.78% "EBITDA yield," which aligns with the company's high ROE and strong cash flow, but is significantly higher than the traditional "value range" (usually 10-15 times, typical for leading consumer goods, energy, telecommunications, and utility companies).
Free Cash Flow Valuation
TTM Free Cash Flow (FCF): $73.6 billion
Corresponding:
FCF / EV ≈ 1.9%
FCF / Market Capitalization ≈ 1.9%
7.3 Comparison with Peer Companies: P/E, EV/EBITDA, and PEG
I selected Microsoft, Amazon, and Meta as the main comparable companies (all core internet platform players in advertising/cloud/AI). The core valuation metrics are summarized below (all as of early December 2025, TTM basis):
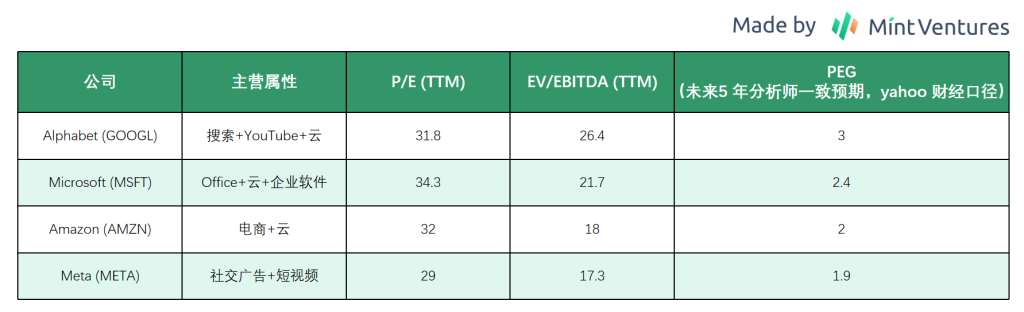
Key Observations:
- P/E Dimension
Alphabet's TTM P/E of 31.8 is slightly lower than Microsoft's, roughly on par with Amazon, and about 10% higher than Meta. Among the "AI leaders," Alphabet is positioned in the upper mid-range but is not the most expensive.
- EV/EBITDA Dimension
Alphabet's EV/EBITDA of approximately 26.4x is among the highest, with Microsoft following, and significantly higher than Meta and Amazon. This reflects that the market prices Alphabet's overall profitability quality and cash flow stability significantly higher than pure e-commerce/social advertising companies, and even higher than Microsoft's "office-like infrastructure" pricing.
- PEG (Price/Earnings Growth) Dimension
- Alphabet: Analysts' consensus for Alphabet's EPS compound annual growth rate over the next 3-5 years is about 10-11%, slightly lower than Microsoft and Amazon, corresponding to a PEG of around 3, which is also among the highest.
Summary: Based on P/E and EV/EBITDA, Alphabet's valuation is at a mid-high level among AI leaders.
7.4 DCF Cross-Verification: Current Market Value Implied Growth Assumptions
Without creating a detailed year-by-year model, a simplified DCF cross-verification using the current TTM free cash flow is employed to assess whether the current valuation implies aggressive growth expectations.
Assumption Framework:
Base Free Cash Flow: TTM FCF = $73.6 billion.
Forecast Period: Next 5 years.
Mid-term FCF Growth Rate (g₁): Scenario assumption of 10-12% (slightly higher than current revenue growth, considering cloud/AI penetration and economies of scale).
Terminal Growth Rate (g₂): 2.5-3.0% (close to long-term nominal GDP growth assumptions).
Weighted Average Cost of Capital (WACC): 7-9% range (considering Alphabet's net cash, profitability stability, and current interest rates).
Based on this, several typical scenarios for estimating EV using the free cash flow model (FCFF) are calculated (results rounded):

We can see that the current market gives Google an EV of $3.82 trillion, significantly higher than the conservative/benchmark/optimistic scenarios mentioned above. However, we need to note: 1. The current FCF is already a result of the heavy capital expenditure cycle in AI; if capital expenditures decrease in the future, FCF recovery will correspond to a higher discounted valuation; 2. The above simplified DCF valuation does not reflect the potential new profit curve and growth that AI/TPU business may bring.
7.5 Sum-of-the-Parts Valuation (SOTP): Implied Valuation by Business Line
In the sum-of-the-parts valuation, Alphabet can be roughly divided into four segments:
Google Services (Search, YouTube, Android & Play, subscriptions, etc.)
Google Cloud
Other Bets (Waymo, Verily, etc.)
Net Cash and Financial Assets
7.5.1 Profit Splitting Working Assumptions
Since recent financial reports have not fully disclosed the profit situation of each segment, we will make some assumptions based on the 2024 annual report and the Q3 2025 segment disclosures to derive the profit levels of the above segments as the basis for business segment valuation:
In 2024, Google Cloud revenue is $43.2 billion, a year-on-year increase of 31%;
In Q2/Q3 2025, Cloud revenue year-on-year growth rate remains in the range of 28-34%, corresponding to an annualized revenue exceeding $50 billion;
In Q3 2025, Cloud revenue is $15.16 billion, with operating profit of $3.594 billion, corresponding to an operating profit margin of approximately 23.7%.
Based on this, to estimate TTM segment profits, the following conservative assumptions are made:
Cloud TTM revenue ≈ $58 billion (projected from the 2024 figure of $43.2 billion at an approximate 34% growth rate)
Cloud TTM operating profit margin estimated at 23-24%, corresponding to operating profit of about $14 billion, with after-tax net profit of about $11.5 billion;
TTM total net profit is $124.25 billion, so excluding Cloud, Google Services + Other Bets + corporate level totals approximately $112.7 billion in net profit.
Further assuming Other Bets incurs an annual loss of $3-4 billion, Google Services' net profit is roughly in the range of $116-117 billion.
This breakdown is roughly consistent with the structure derived from the 2024 segment operating profit projections: Services contributes the vast majority of profits, Cloud contributes about 10% of net profit, and Other Bets incurs a small loss.
7.5.2 Segment Valuation Range
Based on comparable company multiples, a slightly conservative but not pessimistic multiple range is taken for each segment:
- Google Services (Search + YouTube + Play/Subscriptions)
- Corresponding valuation range approximately $3.15–3.50 trillion.
Business Attributes: High ROE, high cash flow, growth slowing but still with moderate growth around 10%.
Reference: Mature high-growth advertising/software platforms typically trade in the 25-30x TTM P/E range.
Valuation Assumption: For the Services segment, approximately $11.67 billion in net profit is given a 27-30x P/E:
Google Cloud
Business Attributes: Revenue growth of 28-34%, operating profit margin over 20%, close to the early maturity stage of AWS/Microsoft Azure.
AWS's current EV/Sales is approximately 5-6x; considering Google Cloud's slightly smaller scale, faster growth, and AI full-stack potential, it can be given an 8-10x TTM Sales:
- Based on TTM revenue of approximately $58 billion, corresponding valuation is $463-579 billion.
- Other Bets (Waymo, etc.)
- Range assumption of $50-80 billion.
Currently still overall loss-making, lacking visible profit forecasts in the short term.
Given the option value of projects like autonomous driving and life sciences, a "loss not counted, given an option value" approach can be taken:
Net Cash and Financial Assets
- Cash and short-term investments of $98.5 billion, total debt of $44.2 billion, net cash approximately $54.3 billion.
Roughly summing the midpoint of the ranges:
Services: approximately $3.33 trillion
Cloud: approximately $521 billion
Other Bets: approximately $65 billion
Net Cash: approximately $54 billion
The total implied segment valuation midpoint is approximately $3.97 trillion, which is very close to the current $3.9 trillion market capitalization.
7.6 Comprehensive Valuation Judgment
Considering P/E, EV/EBITDA, PEG, DCF, and SOTP from several angles, the following judgments can be made:
- Relative Valuation (vs. Peers):
Alphabet's P/E is roughly comparable to Microsoft/Amazon, slightly higher than Meta;
EV/EBITDA is the highest among the four, reflecting the market's pricing of its profitability quality and AI capabilities close to that of "software giants + infrastructure";
PEG is around 3, also higher than other companies.
- Absolute Valuation (DCF Perspective):
Under relatively traditional assumptions (WACC 8-9%, mid-term FCF growth rate 10-11%), based on current high capital expenditure cycle data, the DCF gives a reasonable EV range mostly in the $2-2.3 trillion level, significantly lower than the current $3.8 trillion EV, indicating strong conservativeness;
To support the current valuation, a recovery in free cash flow (decrease in capital expenditures) is needed, along with mid-term FCF growth rates above 12% or even higher, essentially providing a premium for the AI-driven second growth curve.
- Segment Valuation:
- Under relatively conservative multiple assumptions, the SOTP midpoint is approximately $3.9-4.0 trillion, which aligns closely with the current market capitalization.
Valuation Conclusion
Based on the TTM performance as of Q3 2025, Alphabet's current valuation is a "reasonably expensive/slightly premium quality target," reflecting the secondary growth expectations from AI-driven cloud services, but has not yet entered a bubble range completely disconnected from fundamentals.
For medium to long-term investors, the margin of safety is not wide, and future returns will depend more on: 1) whether AI search and the Gemini system can substantively monetize in advertising and cloud to achieve an EPS compound annual growth rate of over 10-12%; 2) whether the FCF profit margin can rebound to the 22-25% range after the high capital expenditure cycle ends; 3) whether antitrust and AI regulations will limit its integration capabilities in search/advertising/cloud platforms.
From the current standpoint, if you are optimistic about downstream demand in the AI industry and believe that Alphabet's medium to long-term EPS/FCF growth can maintain in the low double digits (above 12%), then the current valuation is acceptable, but it will require time to digest the multiple; it is a relatively "high-quality β" rather than an "obviously mispriced α." However, if you are more conservative about AI monetization and the regulatory environment, you should view Alphabet as a "high-quality but currently not cheap" long-term target, rather than an obviously undervalued heavy investment opportunity.
8. Risks and Challenges
Despite Alphabet's significant competitive advantages and robust financial performance, the company still faces a series of risks and uncertainties that cannot be ignored and need to be continuously monitored.
8.1 Regulatory and Antitrust Risks
This remains Alphabet's most significant external risk source. As the absolute leader in the global search and digital advertising market, Google has long been under scrutiny from regulatory agencies in various countries.
U.S. Antitrust Lawsuits and Rulings:
From 2020 to 2023, the U.S. Department of Justice and several states filed antitrust lawsuits against Google regarding search distribution agreements, advertising technology, and other areas.
In 2024, the D.C. District Court ruled that Google violated Section 2 of the Sherman Act in the general search service market; the 2025 ruling requires Google to cease certain exclusive default distribution agreements and open some search data and indexes to competitors, but did not adopt the Department of Justice's request to divest Chrome or Android, nor did it fully prohibit default search contracts with Apple and others. The market generally views the ruling as "relatively mild."
This means that the probability of being "forced to divest Chrome/Android" in the short term has further decreased, but the negotiation costs for default entry have increased, and the obligations for data sharing have intensified, which will somewhat weaken the strength of its "entry moat."
Ongoing Pressure from the EU and the DMA Framework:
From 2017 to 2019, the European Commission imposed fines totaling approximately €8.2 billion on Google for cases related to shopping search, Android bundling, and its own advertising services, with some fines (such as the €1.49 billion AdSense case in 2019) being overturned by courts in 2024.
In 2025, the European Commission fined Google €3.45 billion for its advertising technology business and issued several preliminary objections regarding its Play rules and "self-preference" behavior under the Digital Markets Act (DMA) framework.
The DMA has officially designated Google as a "gatekeeper," requiring it not to give unfair advantages to its own services in ranking, indexing, and crawling, and imposing stricter constraints on pre-installation on Android, cross-service data combination usage, and third-party traffic diversion.
On December 9, 2025, the European Commission announced an antitrust investigation into Google, focusing on the company's use of online content to develop artificial intelligence (AI). The Commission stated that Google uses content from online publishers and content uploaded to the video-sharing platform YouTube for AI training, and it is investigating whether this violates EU competition laws.
Additionally, dissatisfaction among websites, media, and apps regarding AI Overviews / AI search "taking data and siphoning traffic" is intensifying, and they have begun to counteract through lawsuits and regulatory lobbying; if a large number of significant content providers choose to restrict crawling or seek to share revenue, Alphabet's "data flywheel" and AI search experience will be affected.
Overall, the short to medium-term regulatory risks mainly manifest as: rising compliance costs, decreased business flexibility, and gradual dilution of default entry and data advantages; the probability of being forcibly divested has decreased after recent rulings, but it cannot be completely ruled out in the long term.
8.2 Competitive Risks: Strong Rivals on All Fronts
The technology industry changes rapidly, and Alphabet faces strong competitors in nearly every business line:
Search and Information Retrieval:
In the traditional web search field, Google still holds an absolute share, but generative AI is reshaping the path of "user questions—getting answers." OpenAI, Perplexity, Microsoft Edge + Copilot, and emerging AI browsers are attempting to bypass traditional search result pages and directly respond to user intent with AI.
If users shift en masse to Q&A-style AI products, and these products establish independent advertising or transaction loops, Google's monopoly advantage in the "intent market" will be eroded.
Digital Advertising:
Meta and Amazon continue to eat into Google's advertising share, with the former building its own "intent pool" in social and short video scenarios, and the latter in e-commerce search and retail media.
Advertisers are increasingly allocating budgets dynamically across multiple channels such as "search, social, short video, e-commerce, CTV," and any weakening of algorithms, tools, or attribution advantages in any segment could lead to budget migration to other platforms.
Cloud Computing and AI Infrastructure:
In the IaaS/PaaS market, AWS and Azure maintain their lead due to an earlier start, a broader enterprise customer base, and a rich ecosystem of tools. Google Cloud needs to continue investing in product lines, sales channels, and ecosystem partners to maintain its market share.
In the AI model and computing power layer, OpenAI, Anthropic, Meta, xAI, and others are rapidly iterating models, while NVIDIA, AWS, and Microsoft are building their own "computing power + platform + ecosystem" closed loops through GPUs/ASICs and cloud platforms. If Google falls behind in model quality, inference costs, or developer ecosystems, it may lose some influence in the AI era.
Autonomous Driving and Other Frontier Businesses:
- Waymo is at the forefront globally in terms of technology maturity and safety data, having publicly operated Robotaxi in multiple cities, but the pace of commercialization and regulatory uncertainty remains significant; meanwhile, Tesla's FSD and the Chinese Robotaxi camp (such as Baidu, Pony.ai, etc.) are accelerating their rollout, and the competitive landscape is still not fully defined.
In summary, Alphabet has transitioned from being "unmatched in search advertising" to "simultaneously competing with several tech giants across multiple fronts such as search, social, e-commerce, cloud, AI, and autonomous driving." This "full-line confrontation" model requires the company to maintain high-intensity investment in product innovation and execution; otherwise, if it stumbles in any key business line, it may face significant penalties in valuation and growth expectations.
8.3 Technology Substitution and Paradigm Shift Risks
Paradigm shifts in the technology industry often occur suddenly and structurally; once a new paradigm is accepted by the market, the profitability of the old model can collapse rapidly. For Alphabet, potential substitutions and disruptions come from multiple directions:
Information Retrieval Paths Shifting from General Search to Vertical Scenarios and AI Q&A: If users become more accustomed to obtaining information and making decisions through vertical apps (e-commerce, content communities, short videos) or AI assistants, rather than first opening a browser to search, the importance of Google search may decline temporarily.
New Computing Platforms and Operating Systems: Currently, Google controls the mobile entry point through Android, but if new hardware forms (AR/VR devices, smart glasses, in-car systems, spatial computing devices, etc.) become mainstream, and the operating system layer is dominated by other vendors, a situation similar to "Microsoft missing the smart phone in the mobile era" could arise. Google has laid out plans in AR glasses and quantum computing, but the technological and commercial paths of these projects remain highly uncertain.
Information Flow and Social Distribution Models: Social media and algorithmic information flows are increasingly occupying a larger share of daily information consumption, with some "low-intent, low-price" information queries having already migrated from general search to information flow distribution. Google is attempting to position itself in this area through products like Discover, but compared to platforms like TikTok, Instagram, and Douyin, its advantages in content ecology and user engagement time are not significant.
Historical experience shows that industry leaders often fail not because they lose in current competition, but because they misjudge or execute poorly during the next wave of platform migration. Alphabet needs to maintain sufficient trial-and-error and strategic patience in new entry points (AI browsers, smart terminals), new operating system forms, and new distribution models.
8.4 Macroeconomic and Market Cycle Risks
Most of Alphabet's revenue (search advertising, YouTube advertising, cloud computing, etc.) is somewhat cyclical and highly correlated with the global macro economy and corporate IT/marketing budgets:
During macroeconomic downturns or periods of weakening expectations, companies often cut advertising and cloud spending. In early 2020, Google experienced a rare year-on-year decline in revenue in a single quarter due to the pandemic; in 2022, against the backdrop of a strong dollar and global economic slowdown, Alphabet disclosed a 10% revenue growth for the year, which was 14% at constant exchange rates, with foreign exchange factors lowering growth by about 4 percentage points for the year.
Geopolitical conflicts, trade frictions, sanctions, and export controls can also disrupt cross-border advertising demand, hardware sales, and cloud regional expansion.
On the capital market side, if the market re-prices AI-related assets overall (for example, shifting from "growth premium" to "cash flow discount"), Alphabet, as a core weight stock in the AI concept, may face simultaneous corrections in stock price and valuation multiples.
Overall, Alphabet's anti-cyclical ability is significantly stronger than that of small and medium-sized advertising/cloud companies—during economic downturns, advertisers tend to prefer platforms like Google that offer quantifiable ROI and clear conversion chains. However, its business cannot rise independently of the macro environment, and cyclical fluctuations still impact revenue and valuation.
8.5 AI Investment and "Bubble" Risks
Current capital markets and industry expectations for AI in the medium to long term are extremely optimistic. From GPUs/TPUs to data centers, models, and applications, the valuations and capital expenditures of related assets are at high levels. Alphabet is also making significant upfront investments: in 2024, capital expenditures will reach $52.5 billion, and in 2025, management has raised the full-year capital expenditure guidance multiple times from over $75 billion to $91-93 billion, primarily directed towards AI data centers and self-developed/purchased AI chips.
In this context, there are several types of "AI bubble" risks:
Demand may fall short of expectations: If enterprise-level AI projects are implemented more slowly than the market imagines, or if the actual ROI is far lower than advertised, the growth rate of cloud and model-related revenues may slow down, and even the intensity of price wars may further increase, significantly extending the payback period for Alphabet's AI infrastructure investments.
Changes in technology or regulatory pathways: If more cost-effective competing models/open-source solutions emerge, or if regulations impose stringent requirements on the data used for model training, energy consumption, carbon emissions, and environmental protection, it may compress Alphabet's economic returns on computing power and models.
"De-AI" transactions at the valuation level: Once the market shifts from "AI premium trading" to "defensive or value trading," AI-weighted stocks, including Alphabet, may experience a simultaneous contraction in valuation multiples in a short period, even if the fundamentals remain robust.
Although Alphabet has a leading advantage in models, TPUs, and cloud infrastructure, and possesses strong commercialization potential through multiple entry points such as Search/Workspace/Android, it is also resonating with the asset prices and capital expenditures of this AI cycle. If the incremental cash flows brought by AI cannot be realized into sufficiently high EPS/FCF growth within the next 3-5 years, there is a risk that the current valuation premium surrounding AI may be compressed.
免责声明:本文章仅代表作者个人观点,不代表本平台的立场和观点。本文章仅供信息分享,不构成对任何人的任何投资建议。用户与作者之间的任何争议,与本平台无关。如网页中刊载的文章或图片涉及侵权,请提供相关的权利证明和身份证明发送邮件到support@aicoin.com,本平台相关工作人员将会进行核查。


